Ma Speedometer Dashboard
- 지표
- Davit Beridze
- 버전: 1.0
- 활성화: 5
There is No use in the Testing Demo. You will understand nothing from running flashing numbers. It is a Dashboard. Just try to understand idea, get it and I will help in everything further.
Symbols must be separated by commas (,) and entered into the parameters exactly as displayed by your broker to ensure they are recognized in the dashboard. These symbols will be used for analysis by the indicator.
With one click open any pair any timeframe directly from dashboard
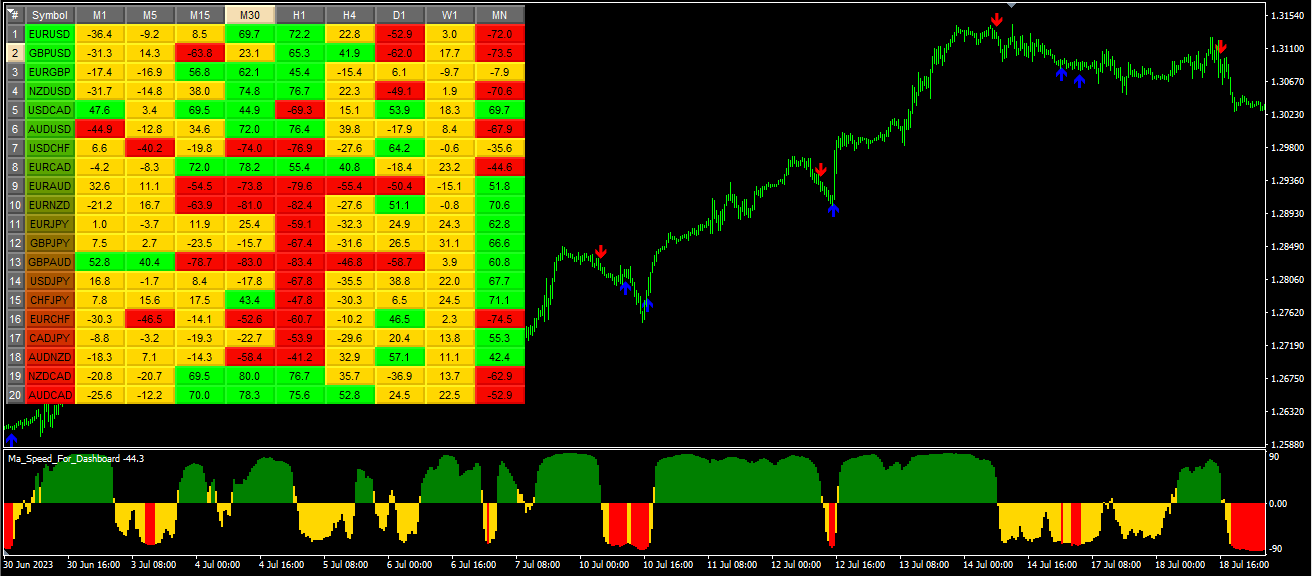
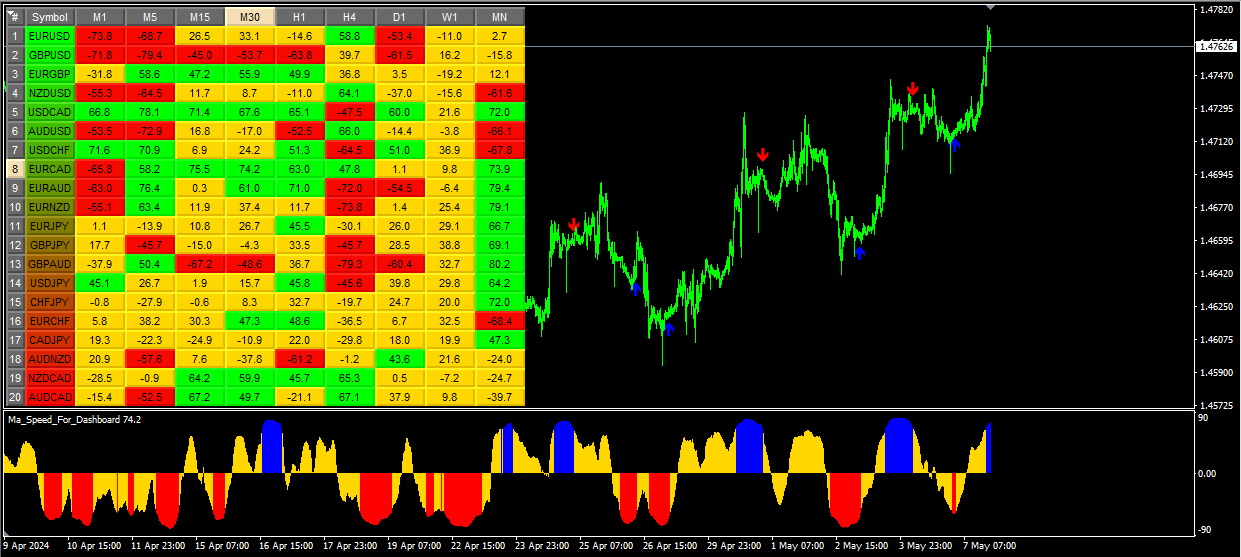
The MA Speedometer Dashboard is a highly functional MetaTrader 4 (MT4) indicator designed to enhance trading strategies through dynamic market analysis. It offers robust features for identifying market trends, trading in sideways markets, and exiting flat market conditions, all based on moving average angles. As a special bonus, customers also receive a special version of the MA Speedometer indicator, which serves as the foundation of the MA Speedometer Dashboard.
Key Features:
-
Comprehensive Trend Analysis:
The dashboard uses moving average (MA) angles to detect potential market trends. Traders can easily spot the start of strong upward or downward trends through color-coded signals:- Green: Indicates the beginning of a strong uptrend, providing an entry opportunity.
- Red: Indicates the beginning of a strong downtrend, also offering an entry point.
- Yellow: Signals flat or sideways markets, suggesting potential exit points.
-
Multi-Timeframe Monitoring:
The dashboard supports multiple timeframes, from M1 to MN, allowing traders to analyze market conditions at granular and broader levels. This feature caters to various trading styles, including day trading and longer-term investment. -
Interactive Dashboard:
The interactive interface allows traders to quickly navigate between different currency pairs and timeframes. By clicking on the dashboard, MT4 automatically opens a chart for the selected currency and timeframe, enhancing usability and efficiency. -
Customizable Parameters:
Traders can customize the moving average period, method, and angle thresholds to align the dashboard with their preferred trading strategies. This flexibility makes the tool adaptable to diverse market conditions and trading approaches. -
Visual Alerts:
The dashboard's intuitive design includes visual alerts and easy-to-read labels for various market conditions. This feature enhances situational awareness, helping traders make informed decisions quickly.
Bonus Offer:
As a special offer, customers receive a unique version of the MA Speedometer indicator as a bonus gift. This indicator forms the base of the MA Speedometer Dashboard, allowing for even more detailed analysis.
Here's a description of each input parameter:
-
Symbols : This parameter is a string input where you can specify a list of symbols separated by commas ( , ). These symbols will be used for analysis by the indicator.
-
StartBar : This parameter is an integer input representing the starting bar for calculating the moving average angle.
-
MaPeriod : This parameter is an integer input representing the period used for calculating the moving average.
-
MaMethod : This parameter is an enumeration input representing the method used for calculating the moving average. It can take values from the ENUM_MA_METHOD enumeration, which likely includes options like Simple Moving Average (SMA), Exponential Moving Average (EMA), etc.
-
Level_Up_M1 to Level_Dn_MN1 : These parameters are integer inputs representing the upper and lower levels for different timeframes (M1 to MN1). They are used to determine the background color of the buttons based on the angle of the moving average.
-
X-Size and Y-Size : These parameters are integer inputs representing the width and height of the buttons, respectively.
Summary:
The MA Speedometer Dashboard offers traders a comprehensive tool for market analysis, catering to both trend traders and those preferring sideways markets. Its flexibility, interactive interface, and customizable parameters make it a valuable addition to any trader’s toolkit, helping to navigate the complexities of the forex market with greater precision and insight.


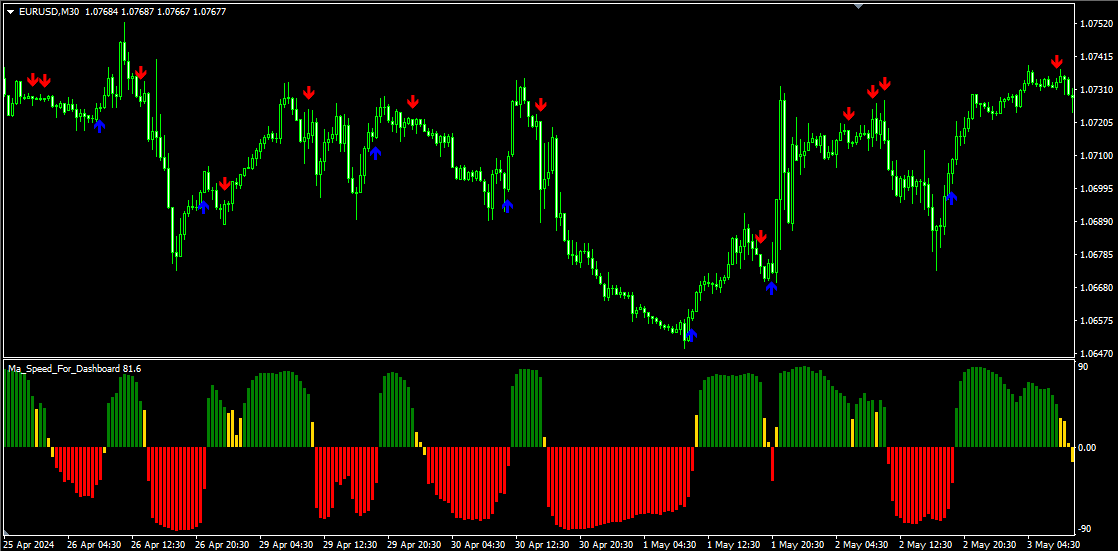


Great dashboard based on the innovative idea of MA angle changes on various instruments desired. The steeper the MA angle, the greater the momentum. Find the instruments with best momentum. Very clever idea. The bonus indicator is very helpful and gives great signals based on the same concept of MA angles, fully customizable.