RSI Pro Analyser MT4
- 지표
- Frederic Jacques Collomb
- 버전: 1.0
- 활성화: 5
RSI Pro Analyser Indicator는 동시에 여러 시간대에 걸쳐 정보에 입각한 결정을 내리려는 트레이더를 위해 설계된 강력한 도구입니다. 이 지표는 RSI를 사용하여 과매수, 과매도 및 추세 신호를 제공하므로 시장 진입 기회를 더 쉽게 식별할 수 있습니다. 주요 장점은 다양한 시장 상황을 나타내는 명확하고 뚜렷한 색상 코드 덕분에 읽기 쉽다는 것입니다.
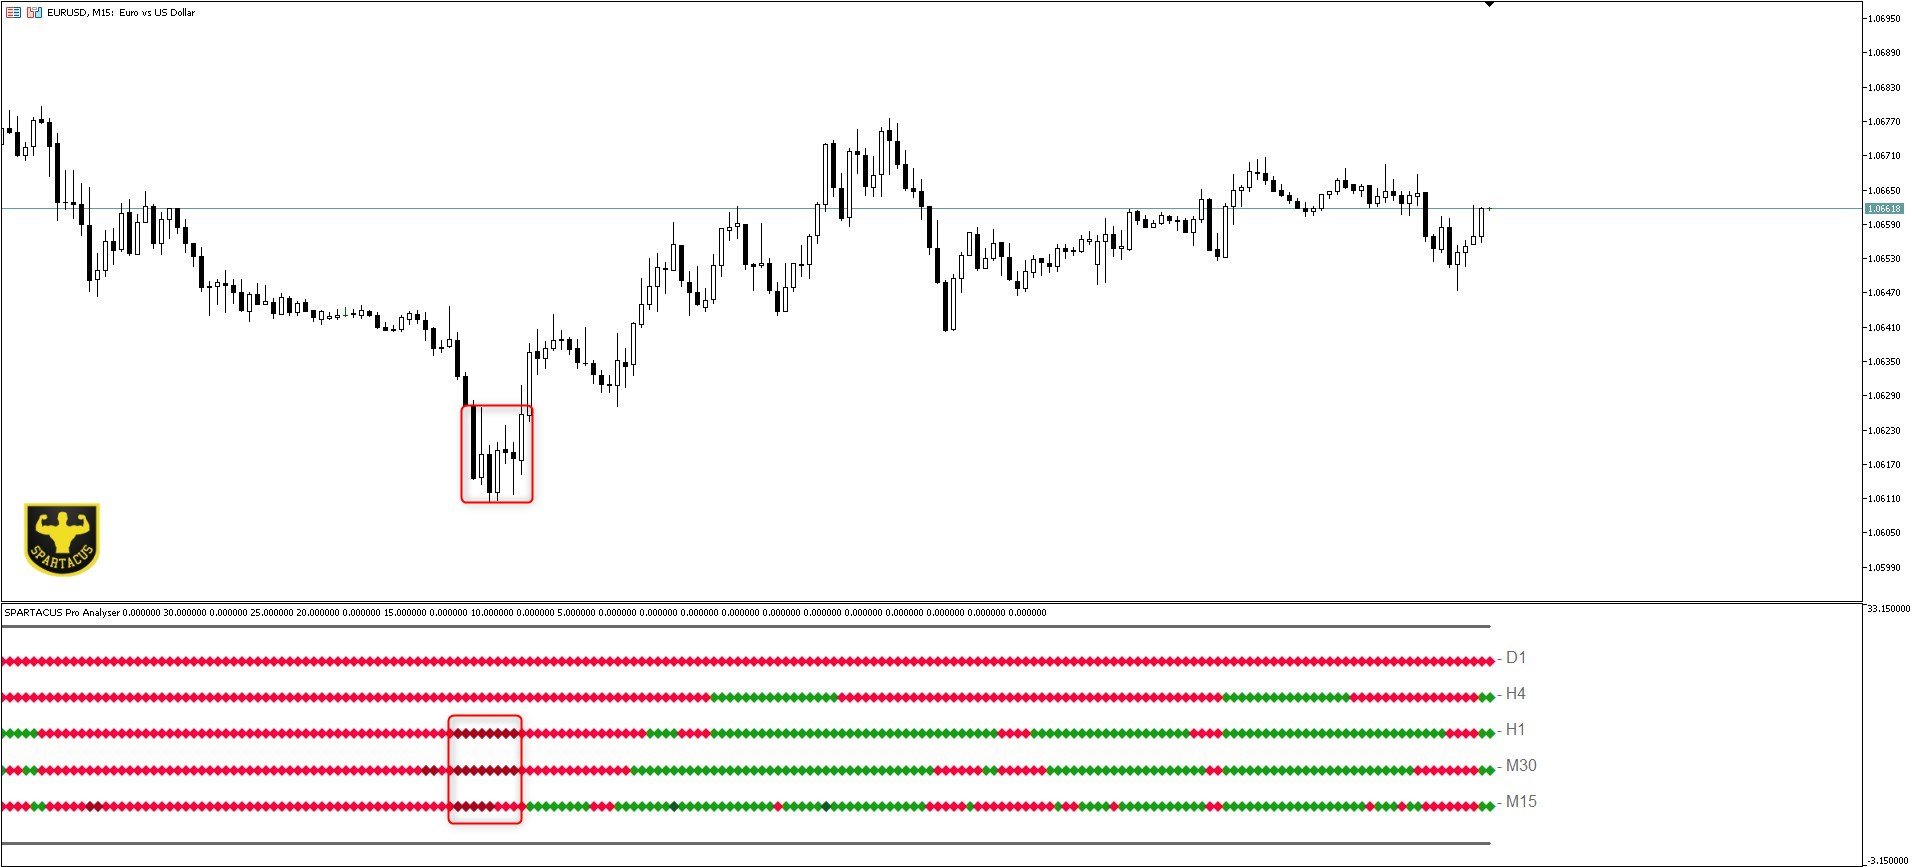
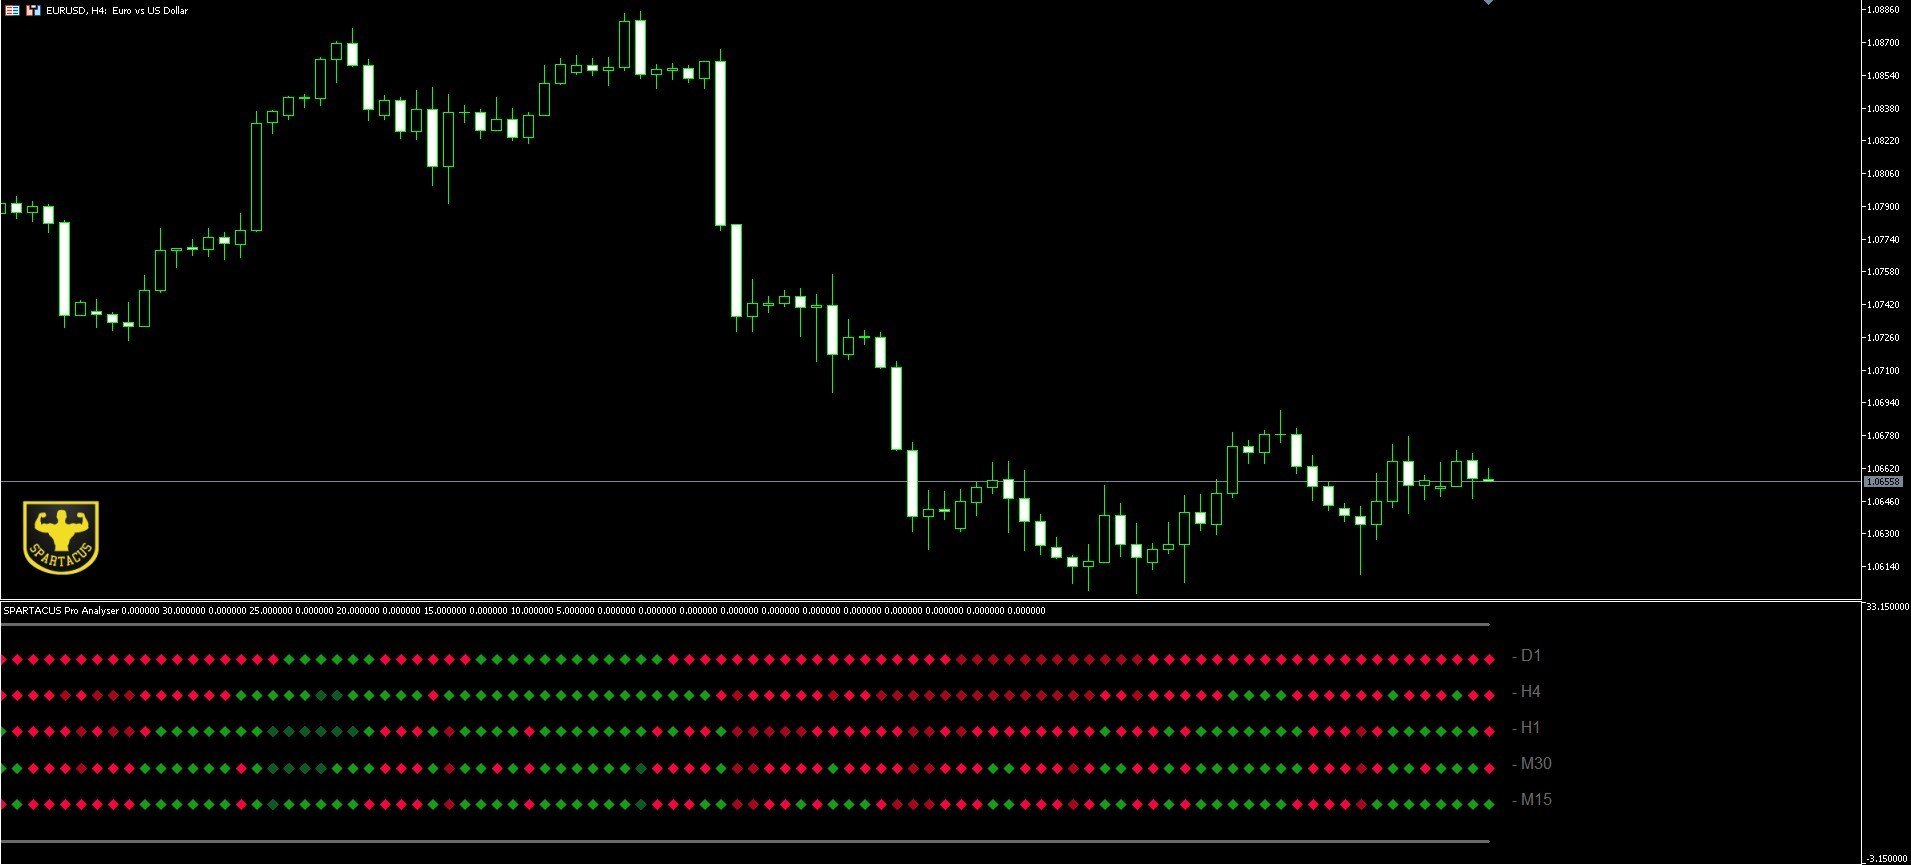
이 지표는 RSI 값과 관련 신호를 5가지 서로 다른 시간대(D,H4,H1,M30,M15)로 표시하므로 거래자는 포괄적인 시장 관점을 얻고 여러 시간대에 대해 정보에 입각한 결정을 내릴 수 있습니다.
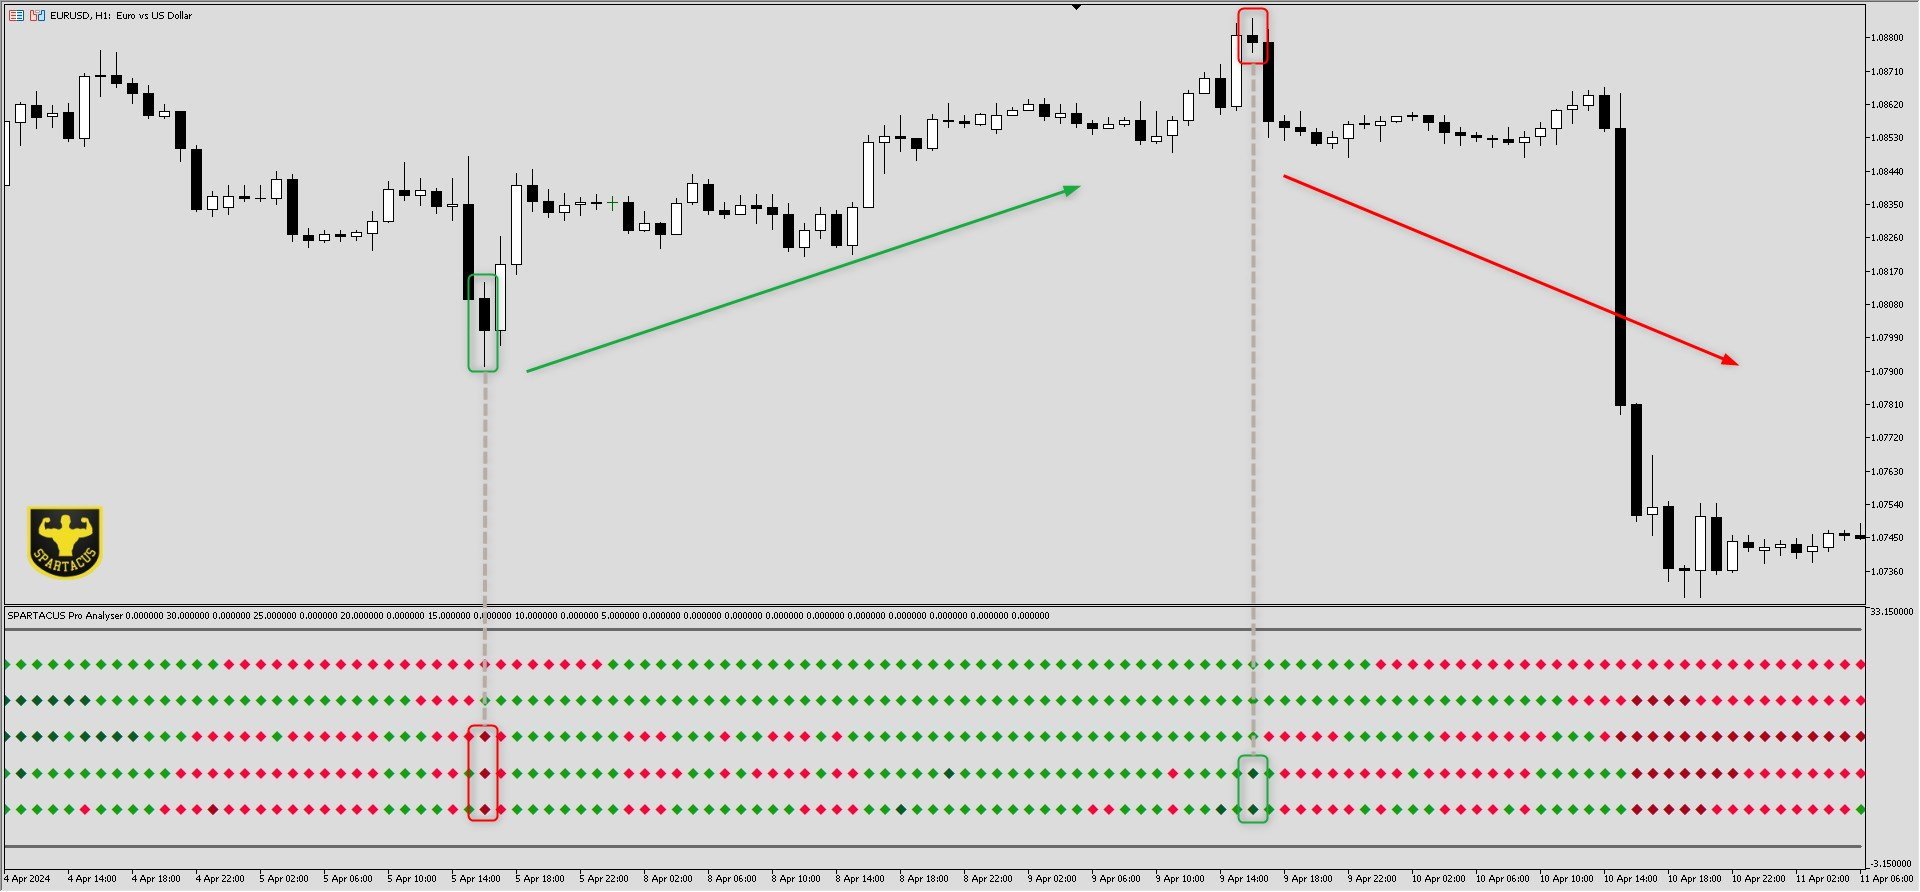
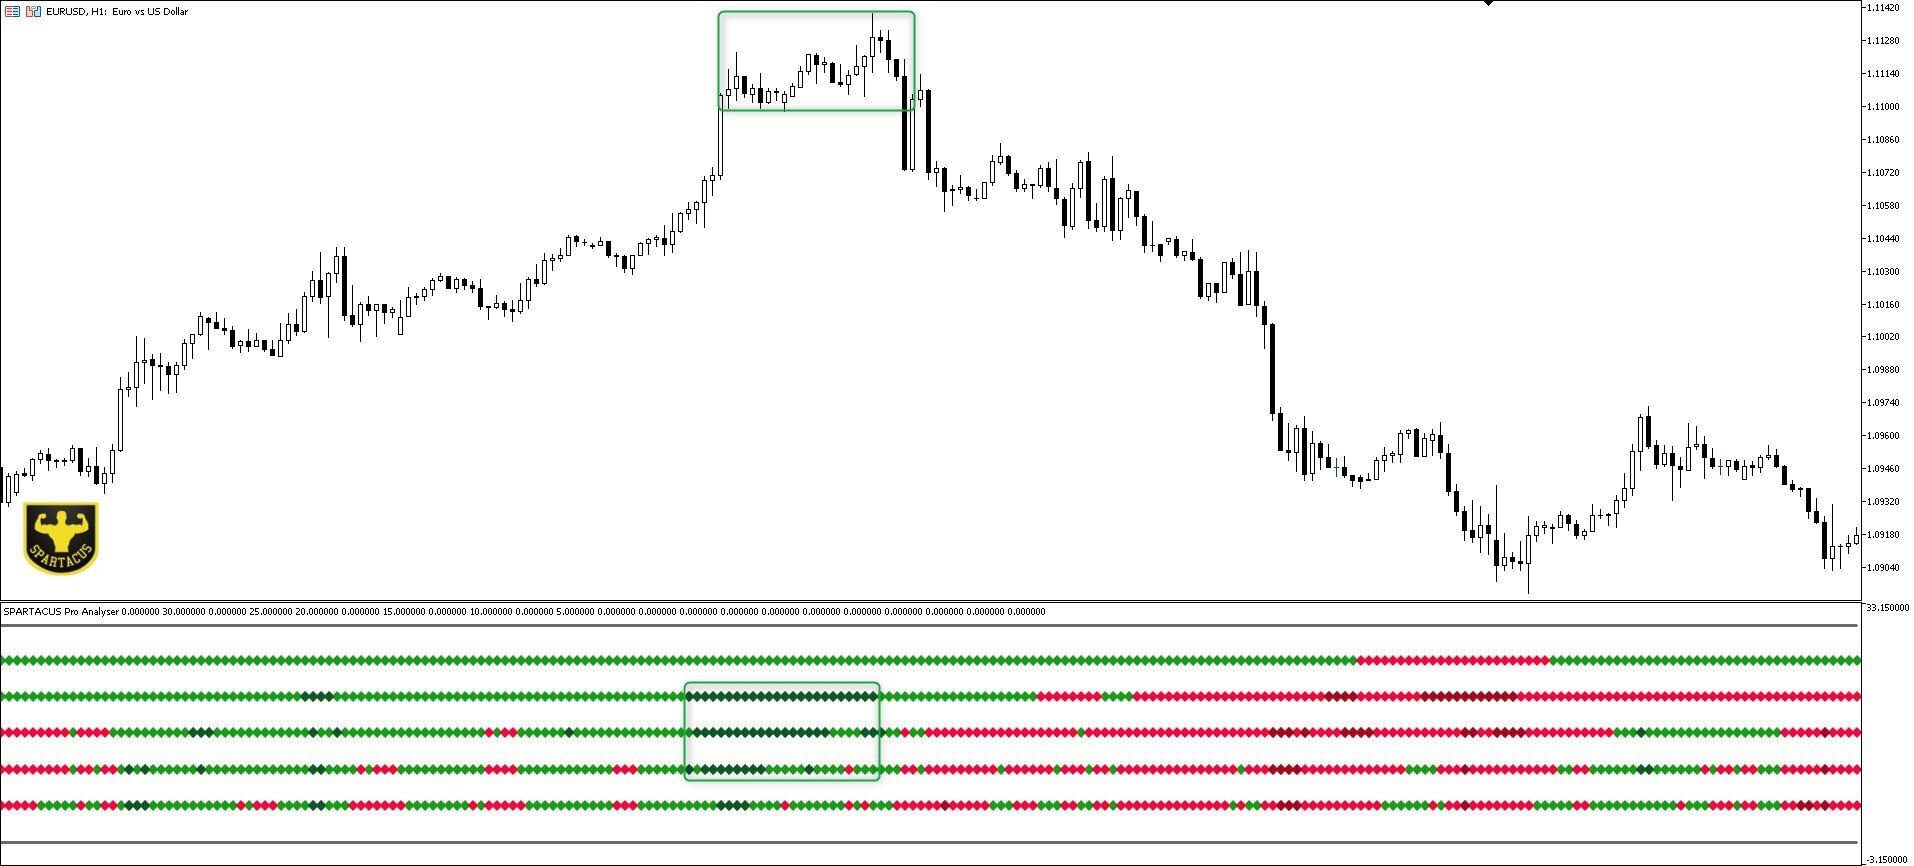
색상 변경을 사용하여 다양한 기간에 걸친 추세와 잠재적 반전을 식별합니다. 과매수 및 과매도 영역을 찾아 역추세 또는 추세 반전 거래 기회를 찾아보세요.
빨간색: 하락세를 나타내는 RSI.
녹색: 상승 추세를 나타내는 RSI.
진한 빨간색: RSI가 과매도 영역을 나타냅니다.
진한 녹색: RSI가 과매수 영역을 나타냅니다.
팝업, 이메일, 푸시 알림을 통해 정확한 알림을 통해 구매 및 판매 항목에 대한 알림을 받을 수도 있습니다.
RSI Pro Analyser 지표는 거래자의 의사결정 과정을 보완하는 도구입니다. 시장 개요를 파악하려면 다른 지표 및 분석과 함께 사용하는 것이 좋습니다.
MT5 버전.
입력 매개변수:
Period RSI: 14(기본값), 선호도에 따라 조정 가능.
Enable/disable alert: 팝업/메일, 푸시 알림 등 3가지 유형의 알림을 활성화 또는 비활성화합니다.
Buy/Sell text: 완전히 구성 가능한 경고 텍스트입니다.
SPARTACUS®2024
이 지표는 RSI 값과 관련 신호를 5가지 서로 다른 시간대(D,H4,H1,M30,M15)로 표시하므로 거래자는 포괄적인 시장 관점을 얻고 여러 시간대에 대해 정보에 입각한 결정을 내릴 수 있습니다.
색상 변경을 사용하여 다양한 기간에 걸친 추세와 잠재적 반전을 식별합니다. 과매수 및 과매도 영역을 찾아 역추세 또는 추세 반전 거래 기회를 찾아보세요.
빨간색: 하락세를 나타내는 RSI.
녹색: 상승 추세를 나타내는 RSI.
진한 빨간색: RSI가 과매도 영역을 나타냅니다.
진한 녹색: RSI가 과매수 영역을 나타냅니다.
팝업, 이메일, 푸시 알림을 통해 정확한 알림을 통해 구매 및 판매 항목에 대한 알림을 받을 수도 있습니다.
RSI Pro Analyser 지표는 거래자의 의사결정 과정을 보완하는 도구입니다. 시장 개요를 파악하려면 다른 지표 및 분석과 함께 사용하는 것이 좋습니다.
MT5 버전.
입력 매개변수:
Period RSI: 14(기본값), 선호도에 따라 조정 가능.
Enable/disable alert: 팝업/메일, 푸시 알림 등 3가지 유형의 알림을 활성화 또는 비활성화합니다.
Buy/Sell text: 완전히 구성 가능한 경고 텍스트입니다.
SPARTACUS®2024