MA Killer MT5
- 지표
- Frederic Jacques Collomb
- 버전: 1.0
- 활성화: 5
MA Killer Indicator는 이동 평균을 사용하는 트레이더를 위한 최고의 무기입니다. 이는 관리 패널에서 직접 액세스할 수 있는 여러 도구를 사용하는 완전한 시스템입니다. 해당 도구 덕분에 시장 개요를 파악하고 입사를 위한 의사 결정에 귀중한 도움을 받을 수 있습니다.
그것은 다음과 같이 구성됩니다:
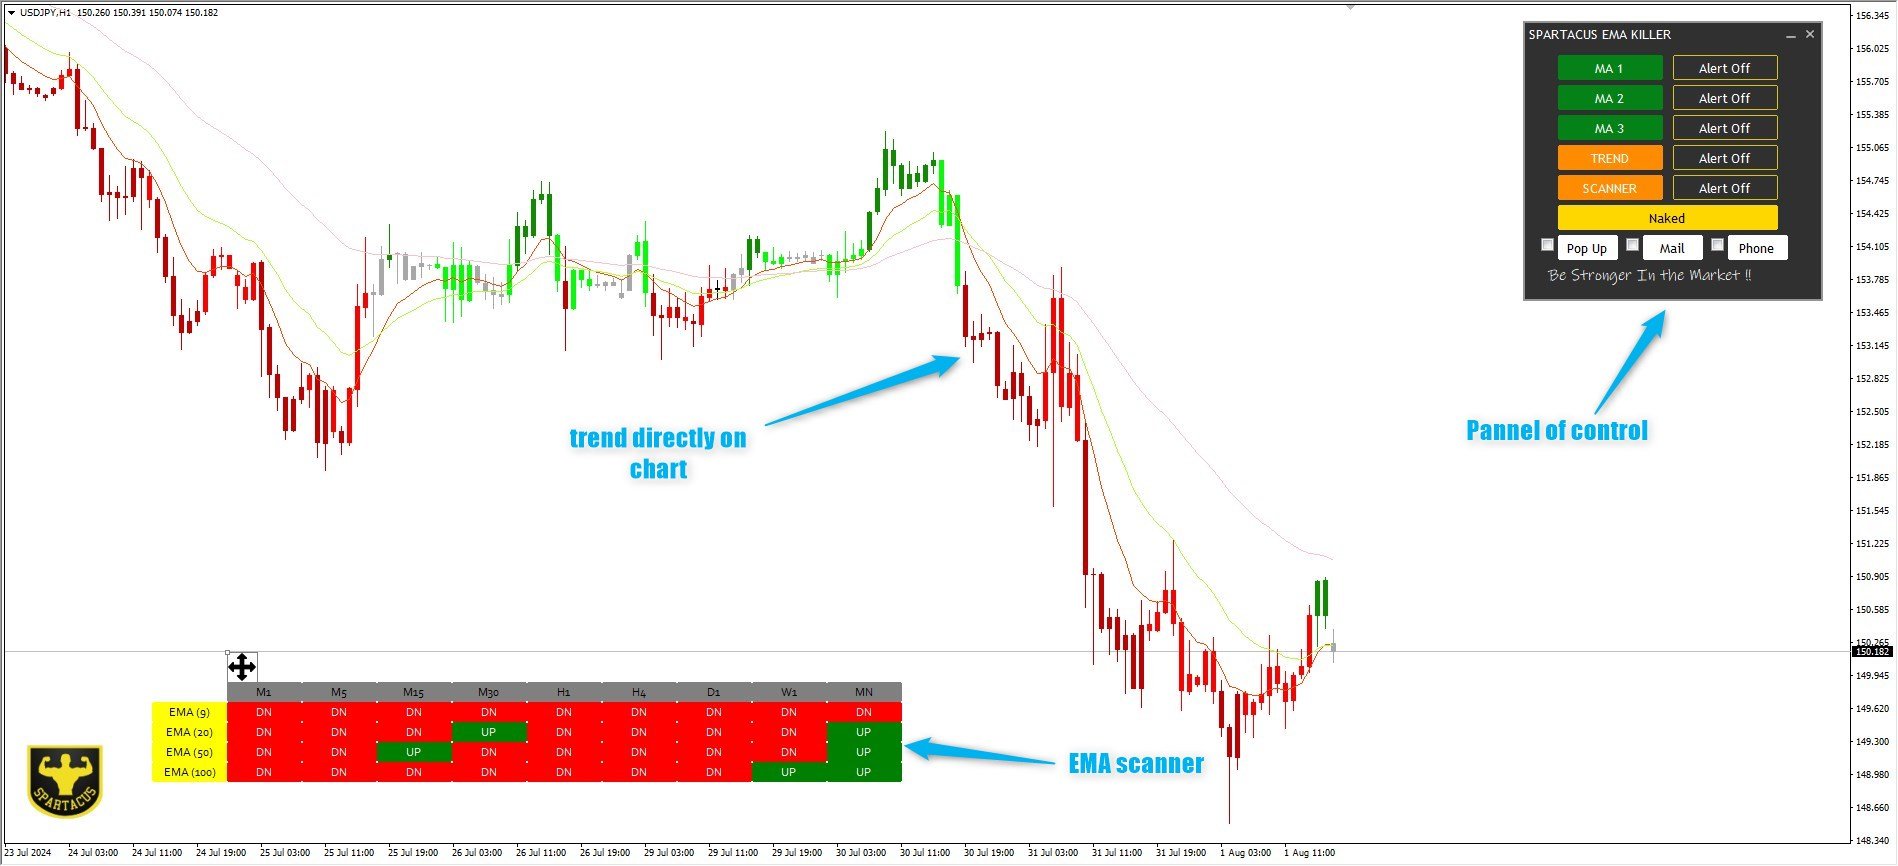
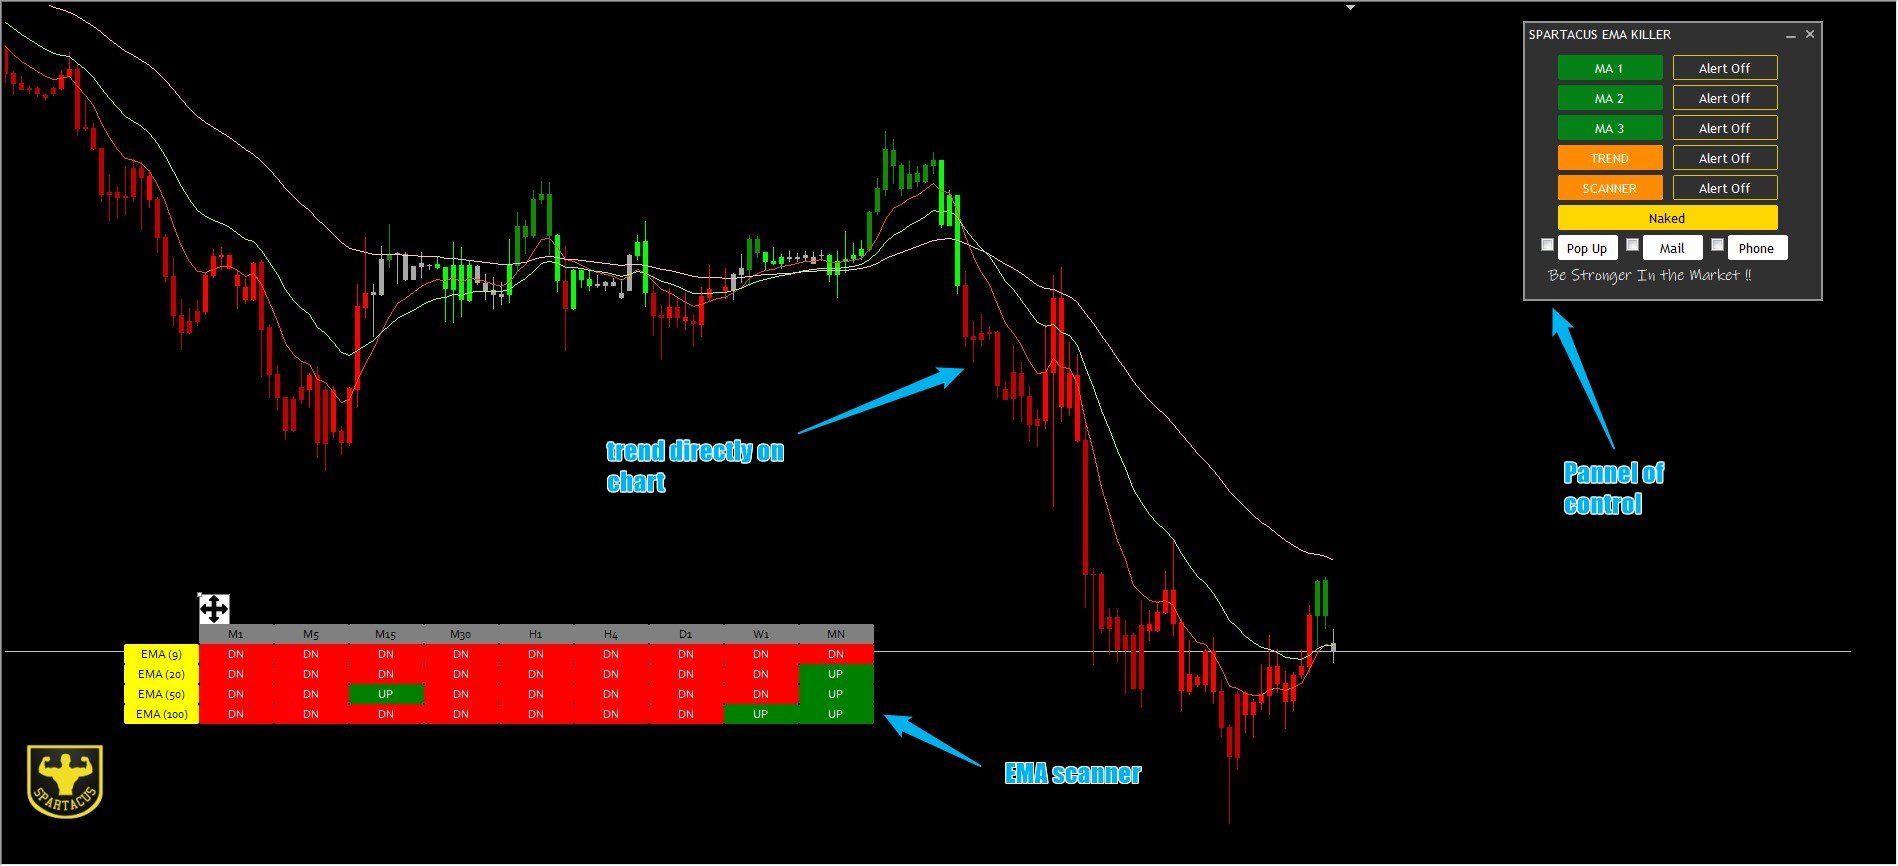
- 색상 코드를 사용하여 차트에 추세를 직접 표시하는 추세 차트 마스터 표시기입니다. 이 추세는 두 개의 이동 평균과 여러 오실레이터를 사용하는 알고리즘으로 계산됩니다.
- 9개 시간 단위에 걸쳐 여러 이동 평균(최대 4개)과 관련된 가격 위치를 표시하는 시장 스캐너인 이동 평균 스캐너 표시기입니다.
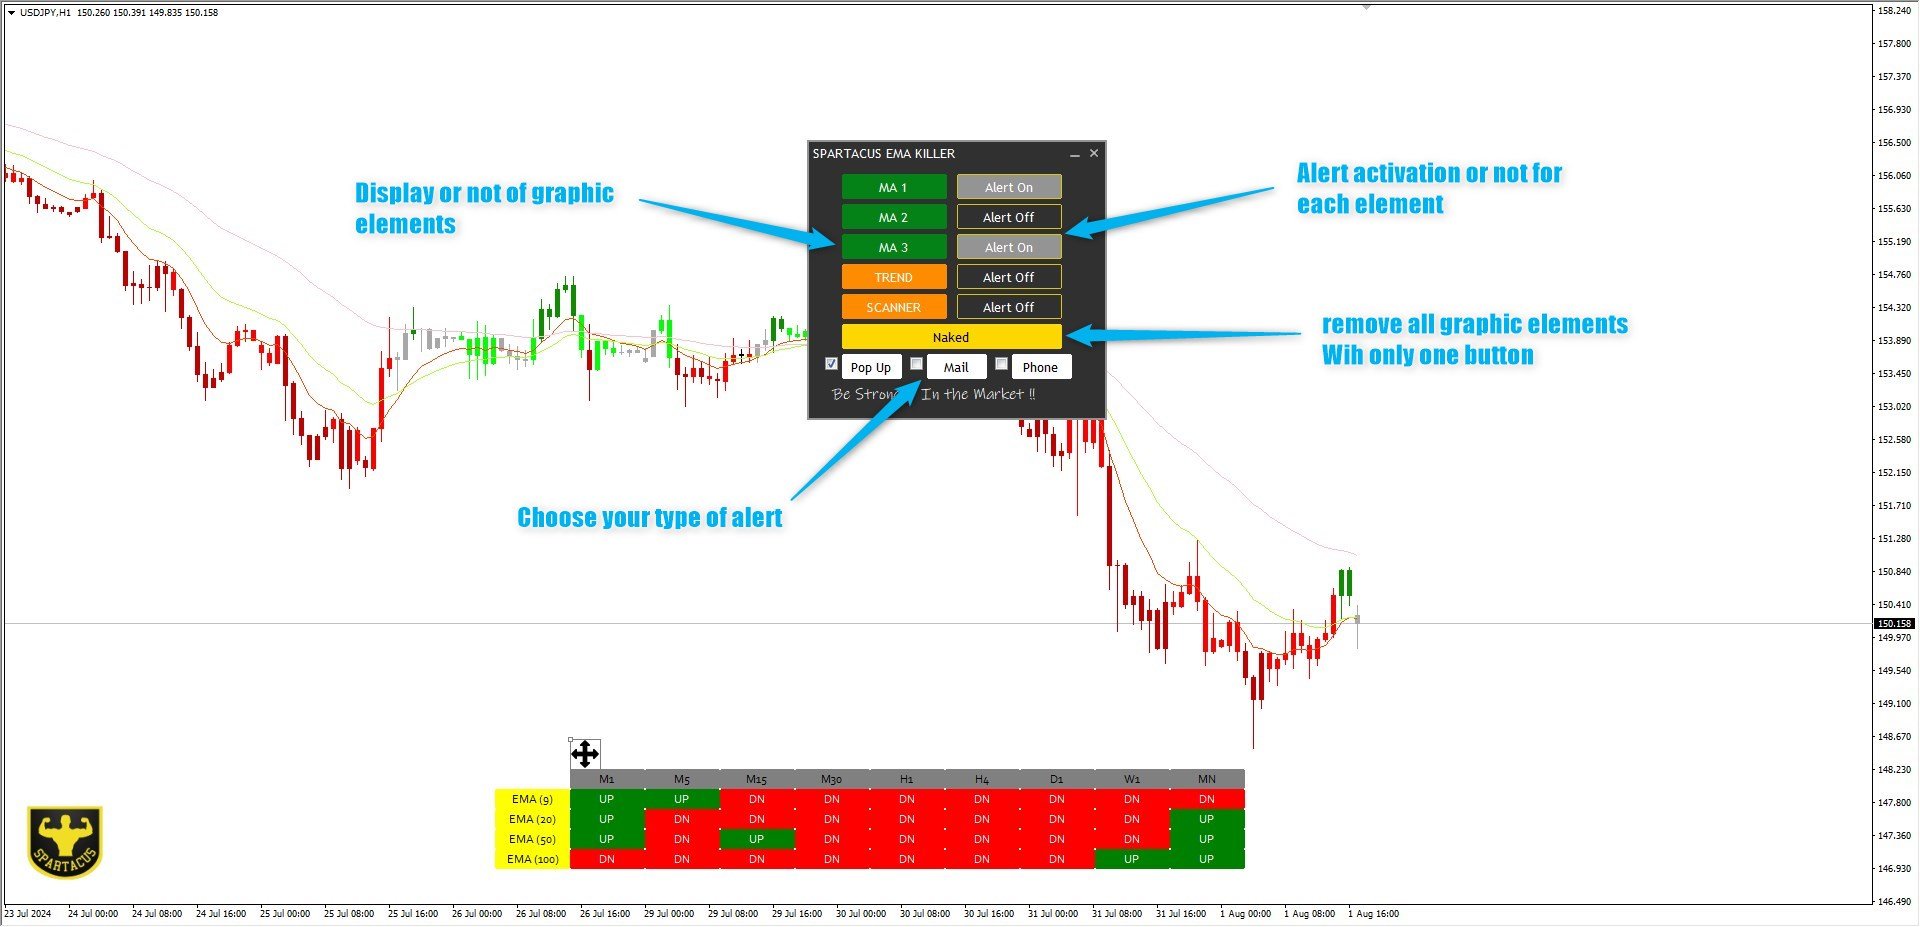
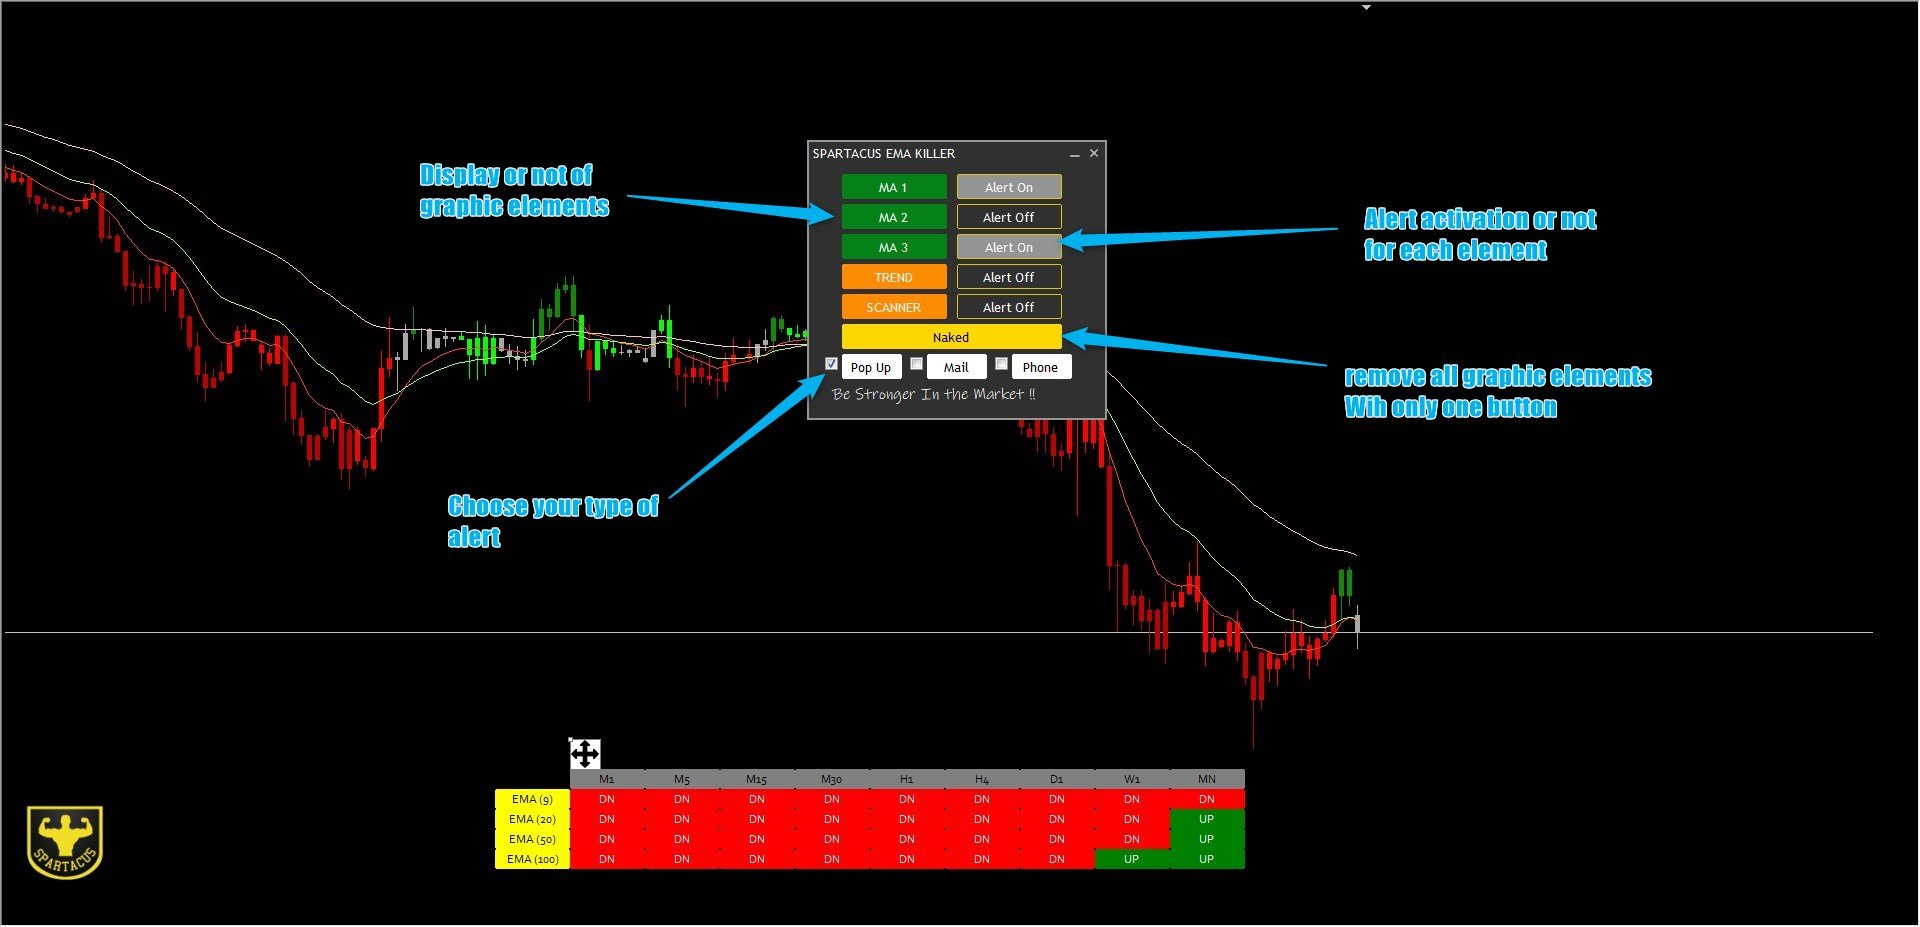
- 여러 이동평균을 독립적으로 표시할지 여부입니다. 표시기 탭을 통해 추가하거나 제거할 필요가 없습니다.
각 시스템에는 팝업, 이메일 및 푸시 알림을 통해 받을 수 있는 경고가 있습니다. 경고는 제어판을 통해 직접 활성화되거나 활성화되지 않을 수 있습니다.
모든 것은 그래픽에 직접 표시되는 제어판에 의해 관리됩니다. 이 관리 패널을 사용하면 한 번의 클릭으로 각 기능을 표시하거나 표시하지 않을 수 있을 뿐만 아니라 한 번의 클릭으로 경고를 관리할 수 있습니다.
단 한 번의 클릭으로 모든 요소를 제거할 수 있는 "네이키드 차트" 기능도 있습니다.
모든 것은 귀하의 작업을 더 쉽게 만들어 귀하가 의사 결정에만 집중할 수 있도록 설계되었습니다.
모든 시스템 구성요소는 표시기 조정 매개변수를 통해 조정 가능합니다.
모든 경고 텍스트는 사용자 정의할 수 있습니다.
SPARTACUS©2024