Market Sentiment Meter
- 지표
- Vitalii Zakharuk
- 버전: 1.0
- 활성화: 5
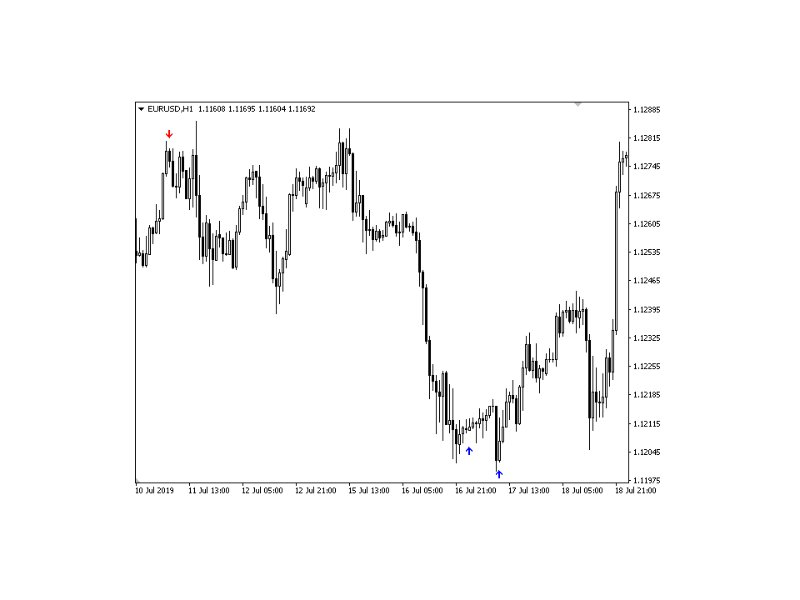
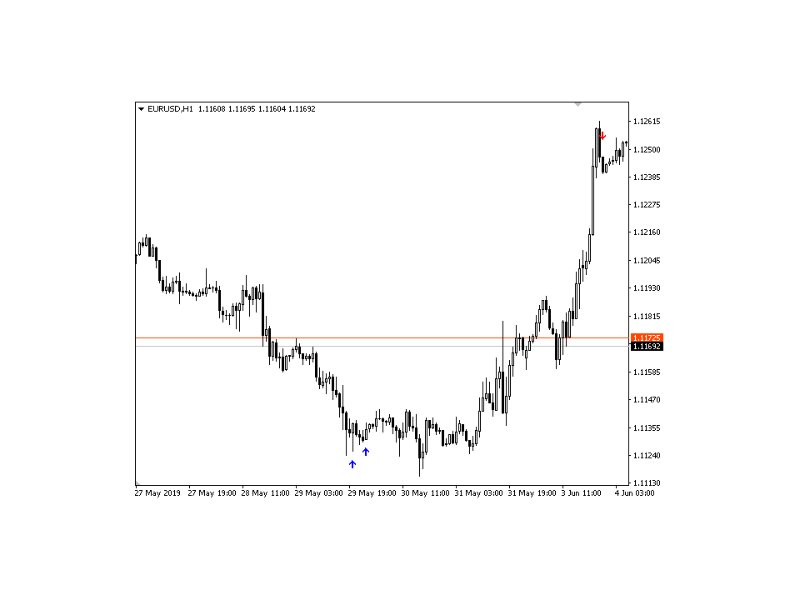
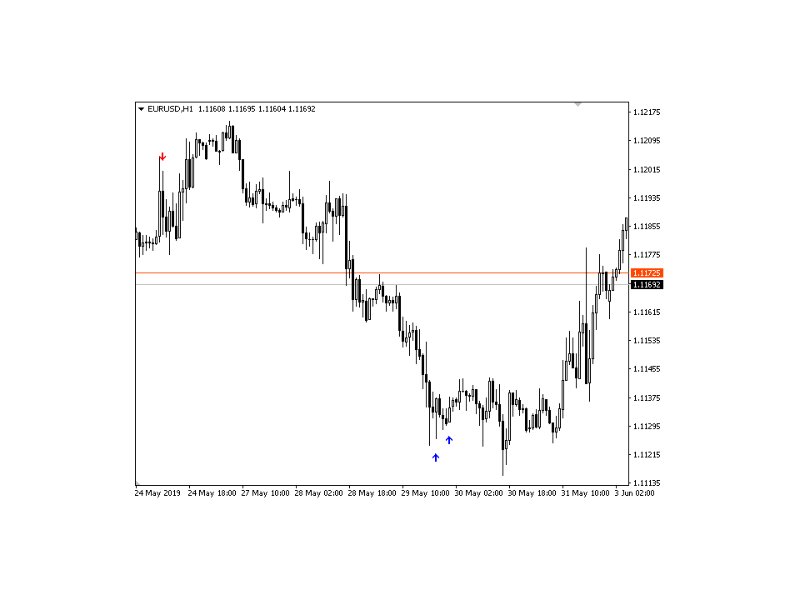
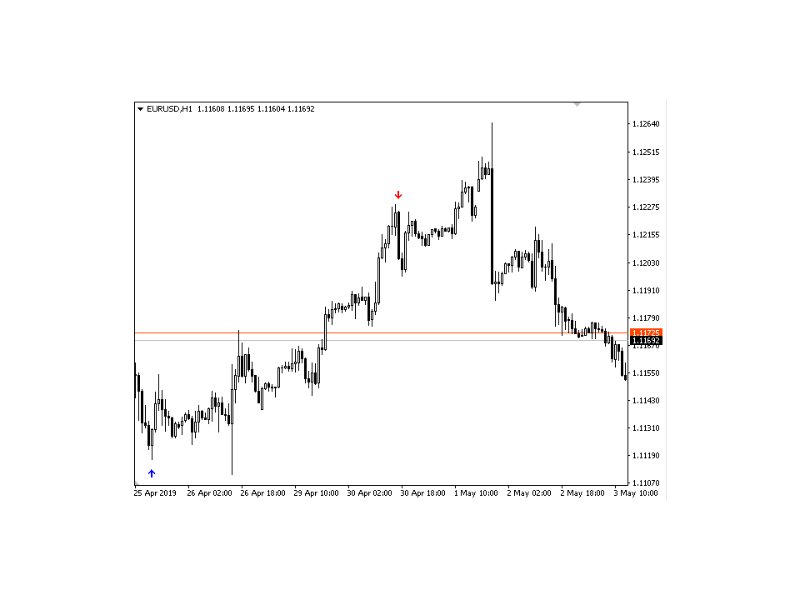
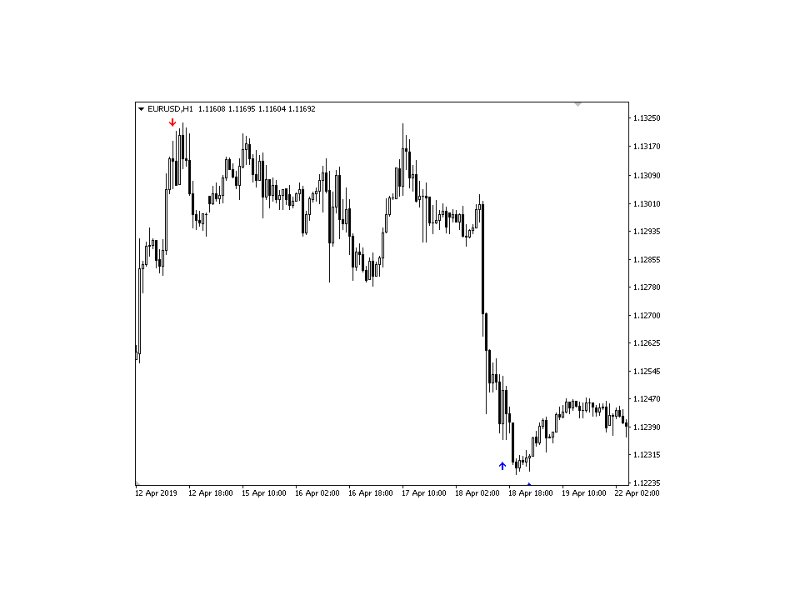
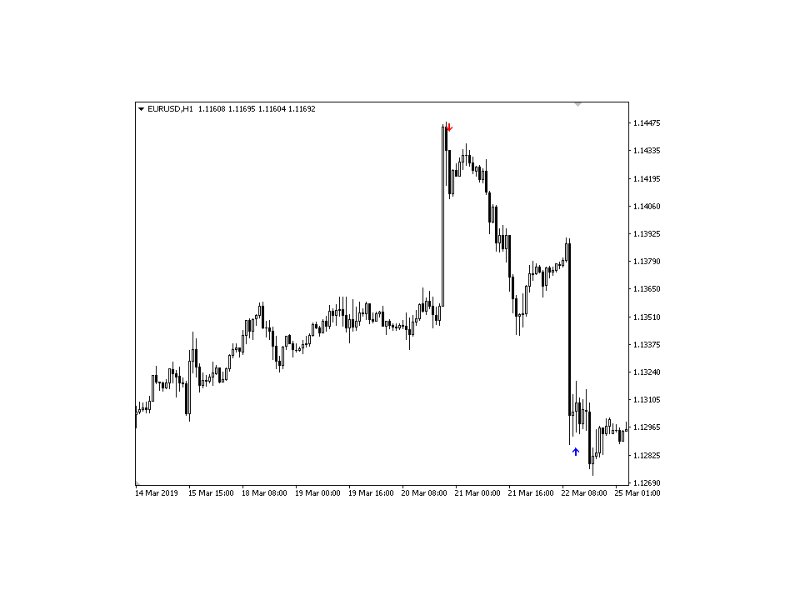
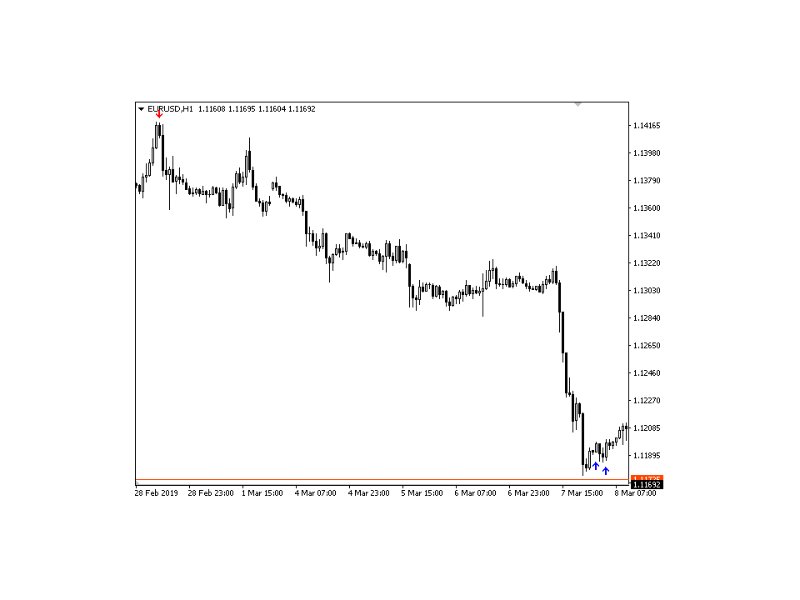
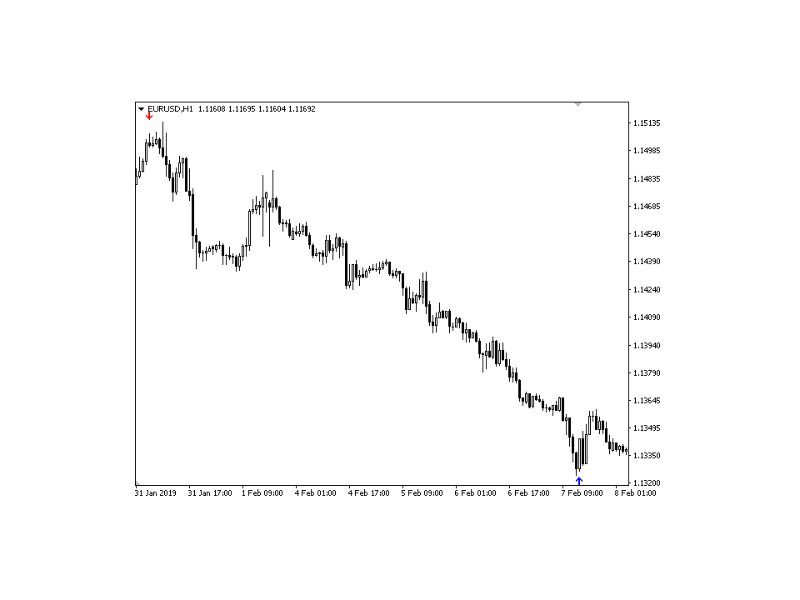
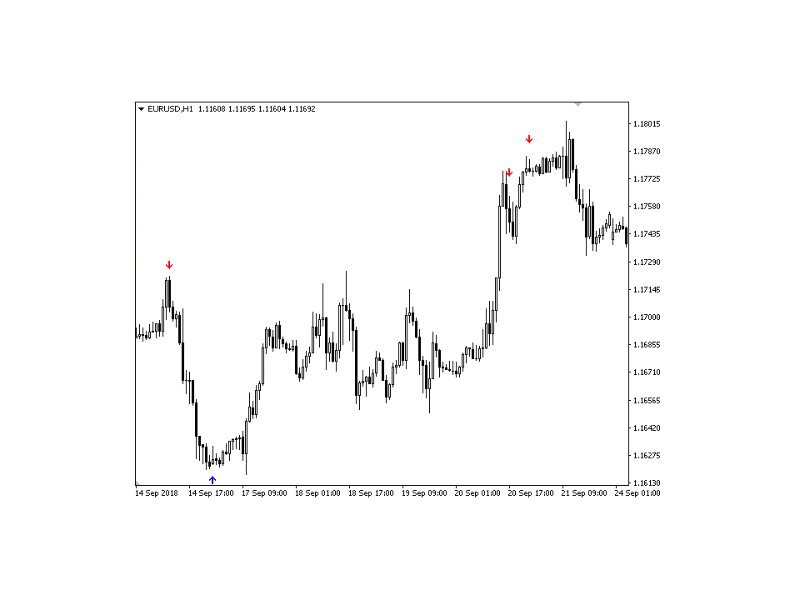
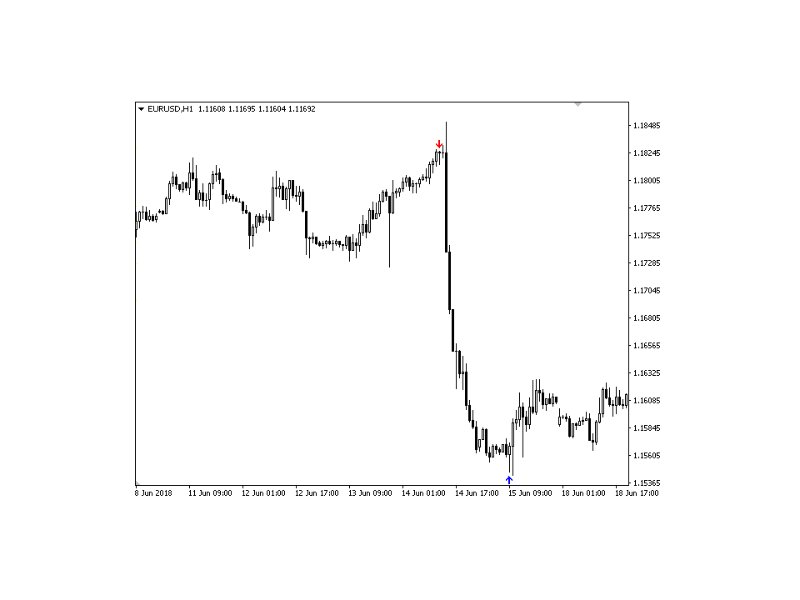
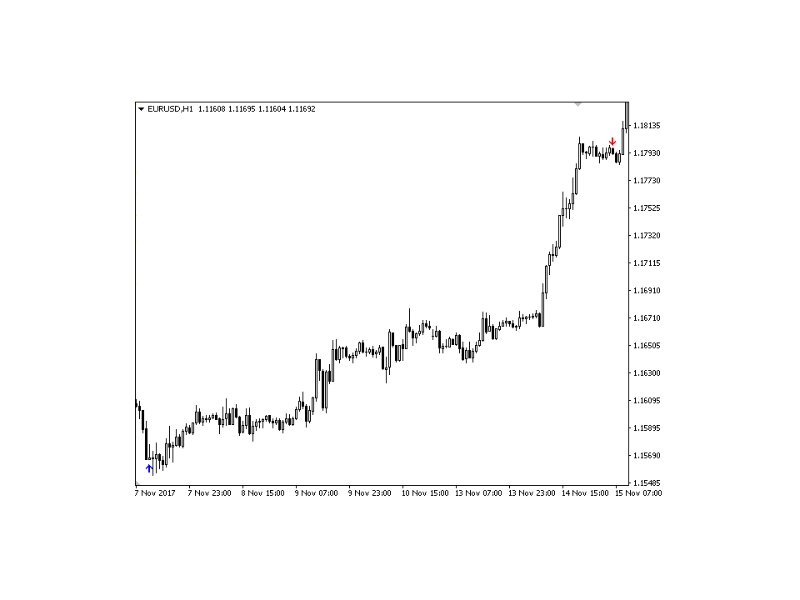
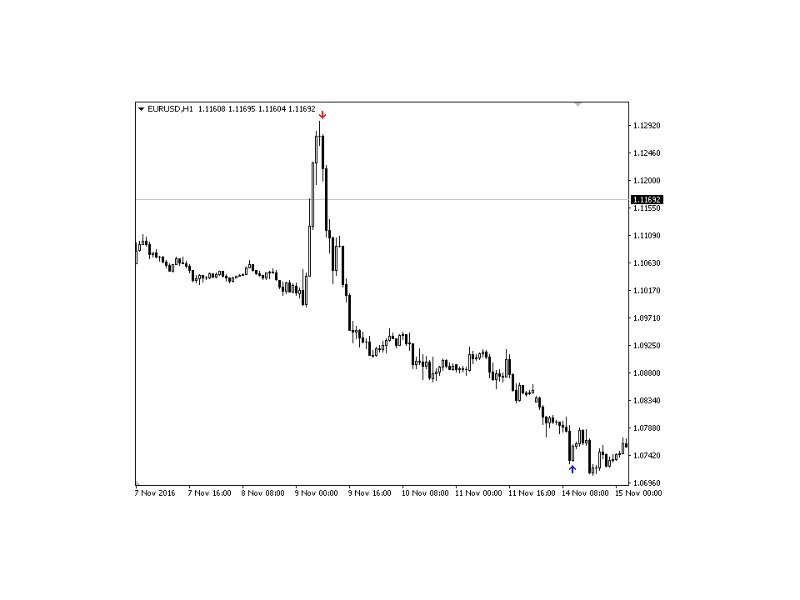
The Market Sentiment Meter indicator calculates the saturation levels of the price chart. A signal to exit the oversold zone indicates a buying opportunity, and a signal to exit the overbought zone indicates a selling opportunity. Typically, for this indicator you need to set relative values for the overbought (Top) and oversold (Bottom) levels.
Often a good trend can be seen visually on the price chart. However, an experienced trader must clearly understand the current distribution of forces in the market before entering a trade. The indicator helps the trader make decisions by providing appropriate signals.
Parameters of the "Market Sentiment Meter" indicator:
- Period: This parameter determines the number of bars used to calculate the saturation levels of the price chart. The higher the value, the smoother the indicator will be, and vice versa.
- Top: The level that defines the overbought area. When the indicator reaches or exceeds this value, the market is considered overbought and this can be a signal to sell.
- Bottom: The level that defines the oversold area. When the indicator reaches or falls below this value, the market is considered oversold and this can be a signal to buy.
- IsSound: This option allows you to turn on or off the sound signals that the indicator can generate when crossing levels.
These settings allow traders to tailor the indicator to their trading strategies and preferences, helping them determine when to enter and exit the market based on the saturation levels of the price chart.

