OriginalSuperTrend
- 지표
- Volkan Mustafaoglu
- 버전: 1.0
- 활성화: 5
Supertrend is a trend following indicator based on the Average True Range (ATR) .
Calculating the odd line combines trend detection and volatility.
It can be used to detect changes in trend direction and position stops.
Basic knowledge
Supertrend is a trend following indicator. It takes up space on the main chart and its plots show the current trend. A Supertrend can be used for varying durations (daily, weekly, intraday, etc.) and varying instruments (stocks, futures or forex).
Supertrend has a variety of entries that you can adjust to suit your trading strategy. Adjusting these settings allows you to make the indicator more or less sensitive to price changes.
For Supertrend entries you can set atrLength and multiplier:
- The atrLength setting is the loopback length for ATR calculation;
- The multiplier is what the ATR is multiplied by to balance the bands in price.
What to pay attention to?
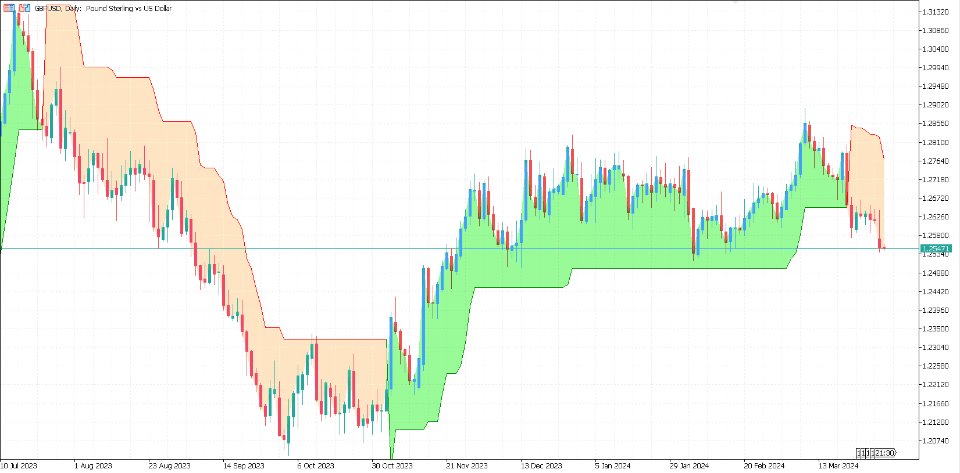
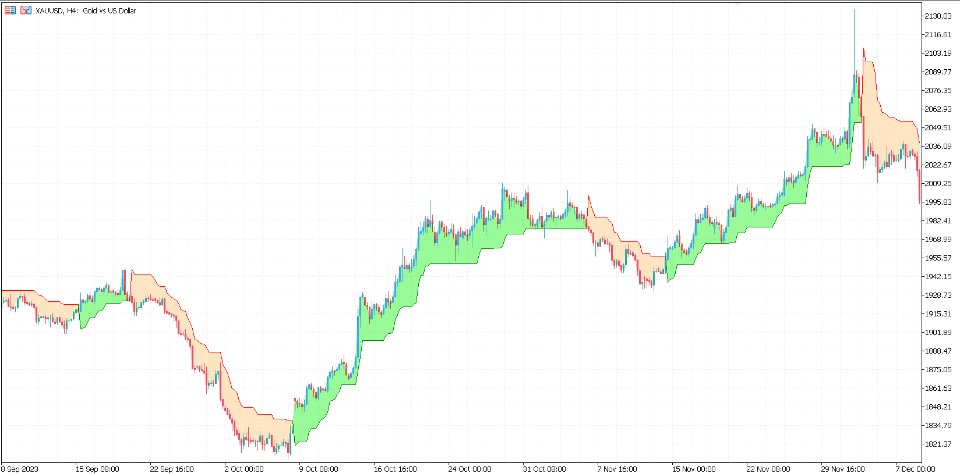
When the price falls below the indicator curve, it turns red and indicates a downtrend.
Conversely, when the price moves above the curve, the indicator turns green, indicating an uptrend.
After every close above or below the supertrend, a new trend emerges.


