Mastering the RSI MT5
- 지표
- Nguyen Anh Tung
- 버전: 1.7
- 활성화: 10
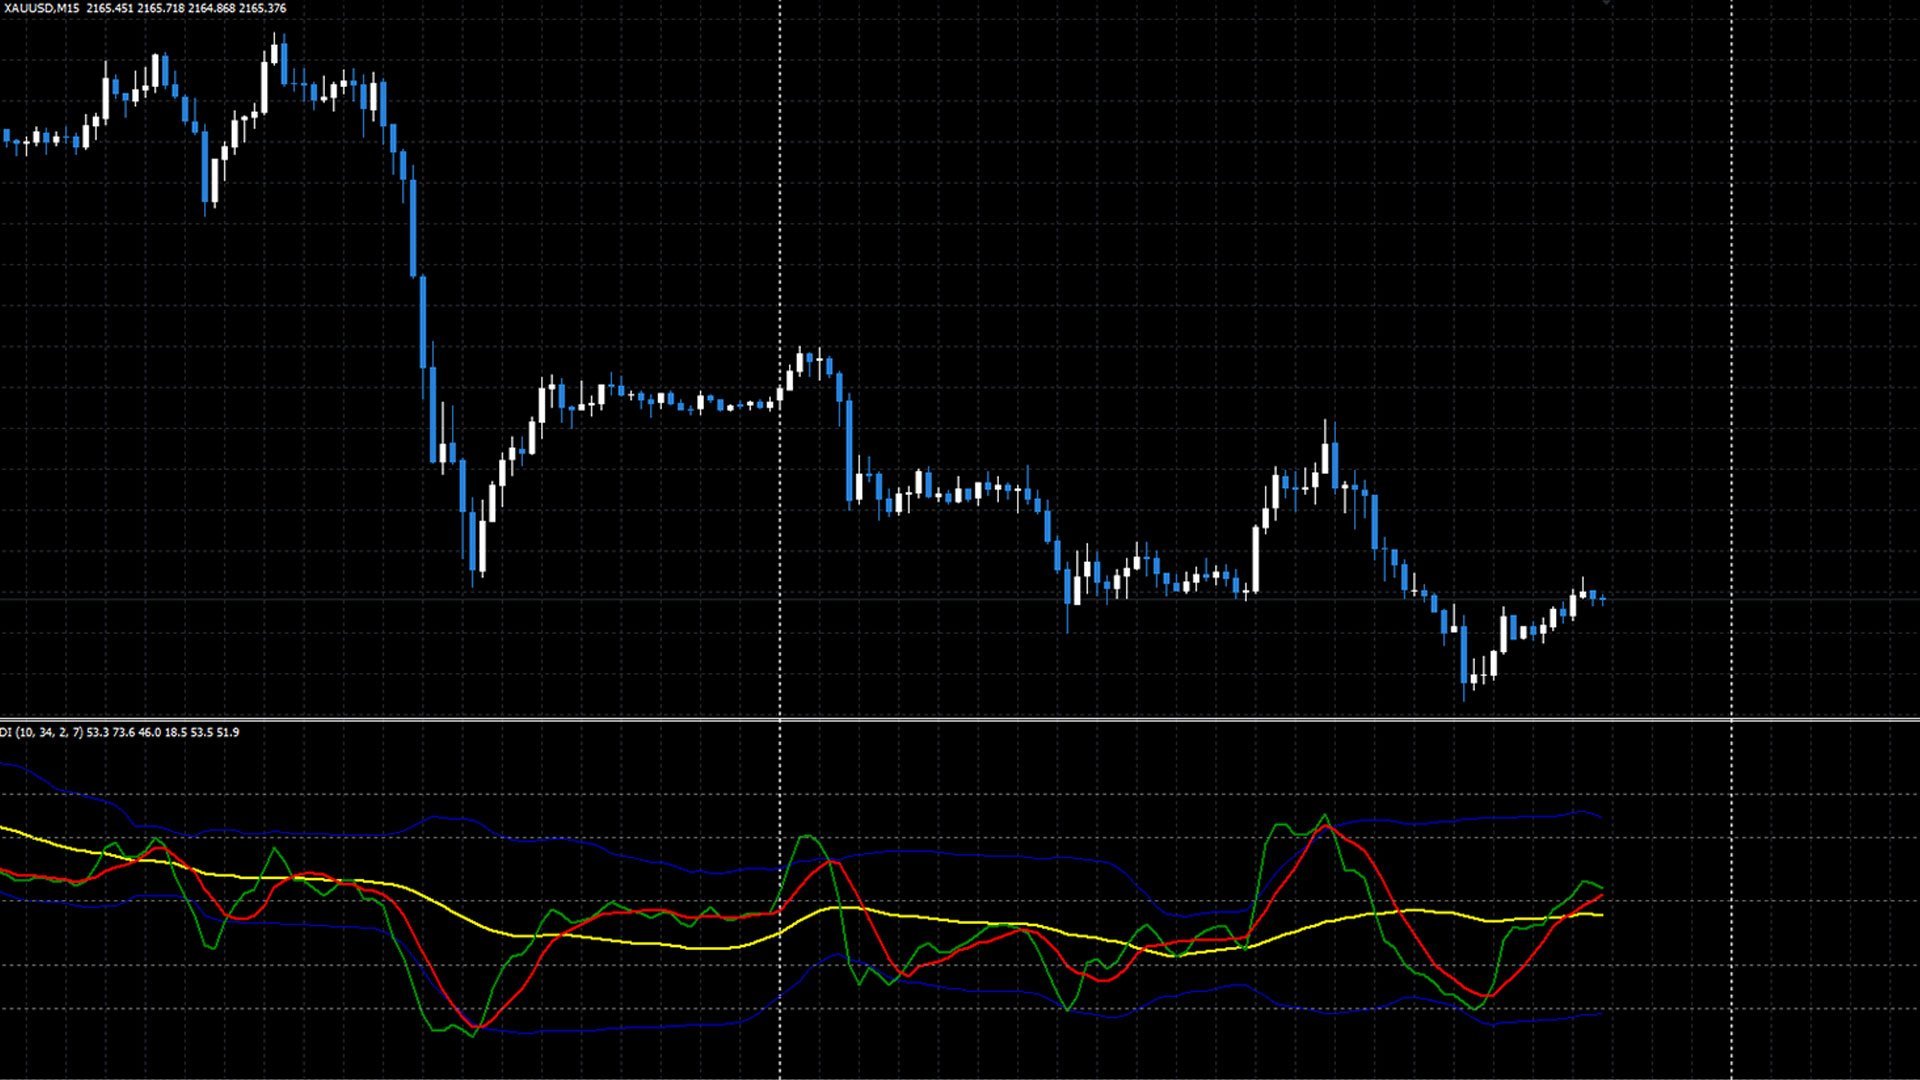
The RSI Advanced tool will help traders capture trends and optimal entry points by:
- Enter a Buy order when the green line crosses the yellow line. Provided that the yellow line is near line 32 or 20
- Enter a Sell order when the green line crosses the yellow line. Provided that the yellow line is near line 68 or 80
Additionally, you can combine it with the convergence divergence that occurs at the green line.
**When you purchase the Mastering the RSI MT4 or Mastering the RSI MT5 indicator, you will receive a guide to using the Mastering the RSI method. Just read and seriously follow, you will achieve basic profits.
Please contact me to receive the English document once you have purchased and give a good review for the Mastering the RSI indicator


TỐt