Macd Scalping Strategy USDJPY
- 지표
- Fatima Hosseini
- 버전: 1.0
Download the free USDJPY version here.
MACD Indicator
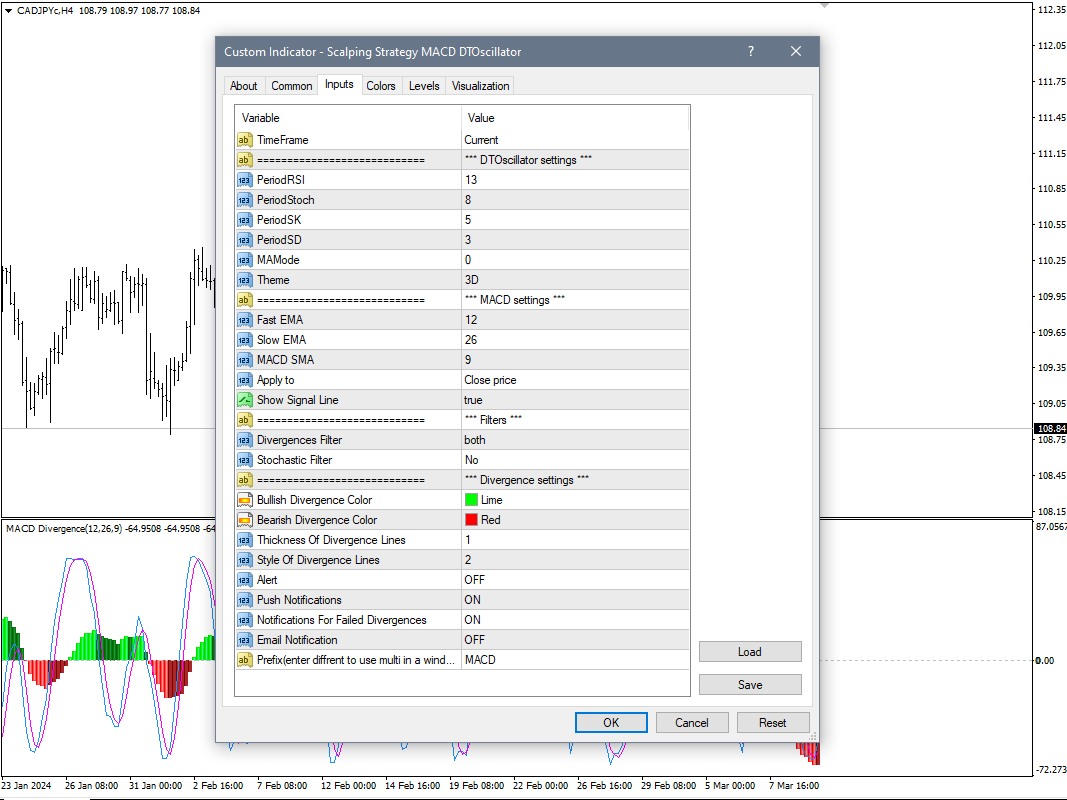
The Moving Average Convergence and Divergence (MACD) is a trend following momentum indicator which shows the relationship between two moving averages that we chose and configure them on the indicator. The MACD is calculated by subtracting the 26-period exponential moving average and the 12 period D.A.M. These are the default parameters when you put the MACD indicator on the charts, and the period is usually 9 which means the last 9 candles.
DT-Oscillator
This is Robert C. Miner's DT Oscillator, a version of the Stochastics & RSI.
The DT Oscillator Indicator is a momentum indicator which identifies and indicates momentum direction as a two lined oscillator. It is an oscillator which is derived from two popular oscillators, which are the Relative Strength Index (RSI) and the Stochastic Oscillator (SO).
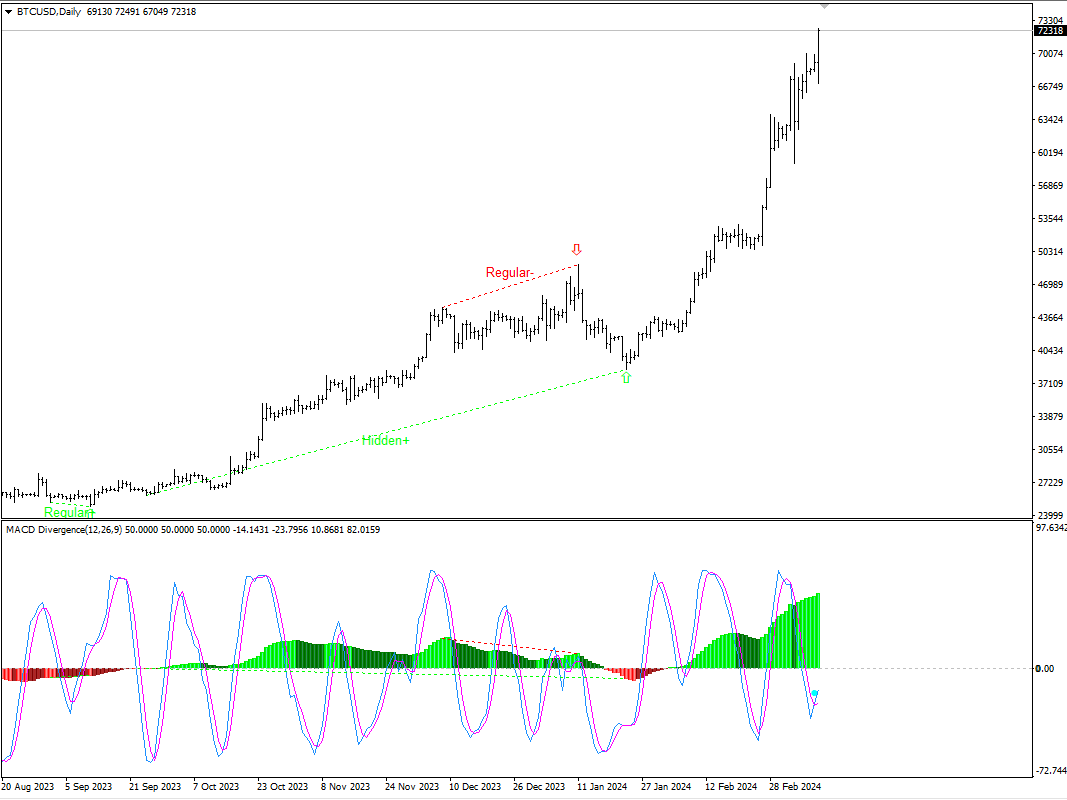
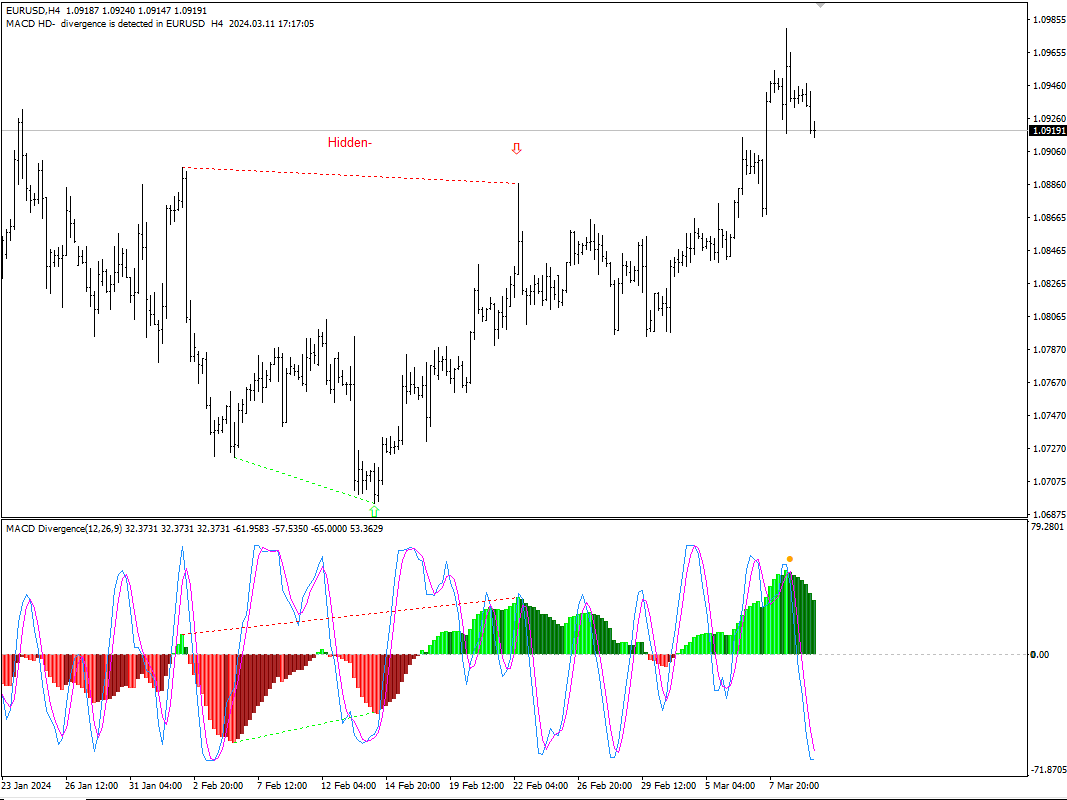
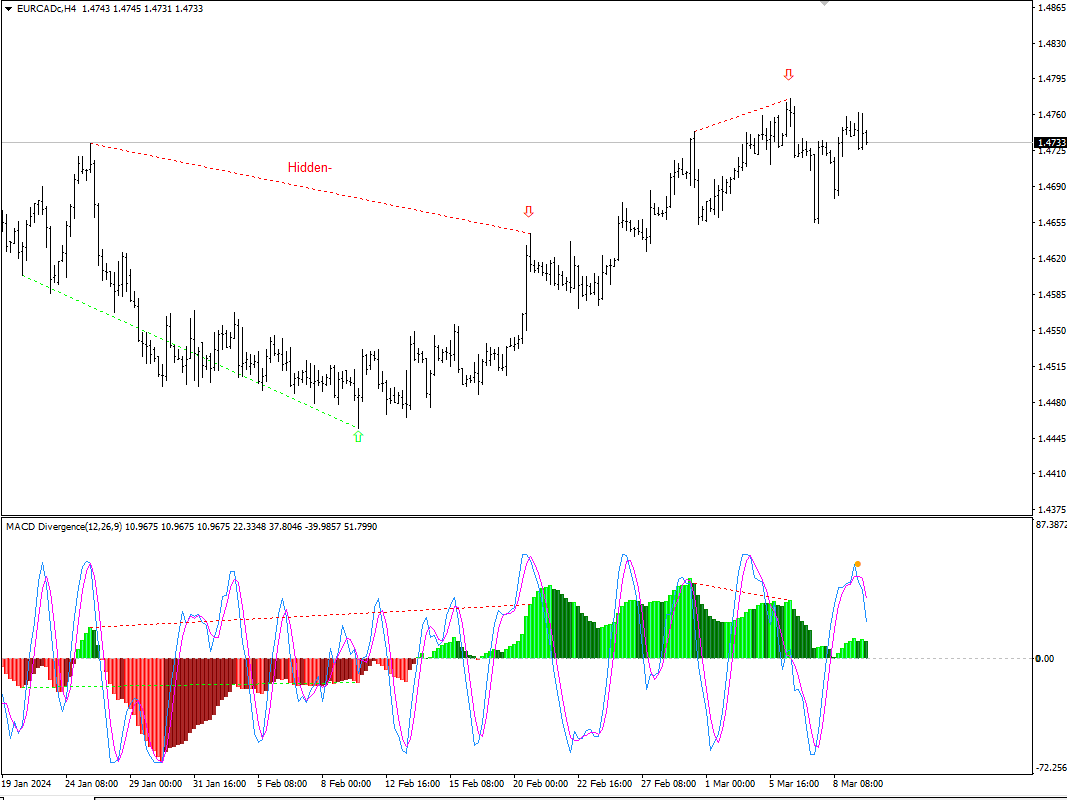
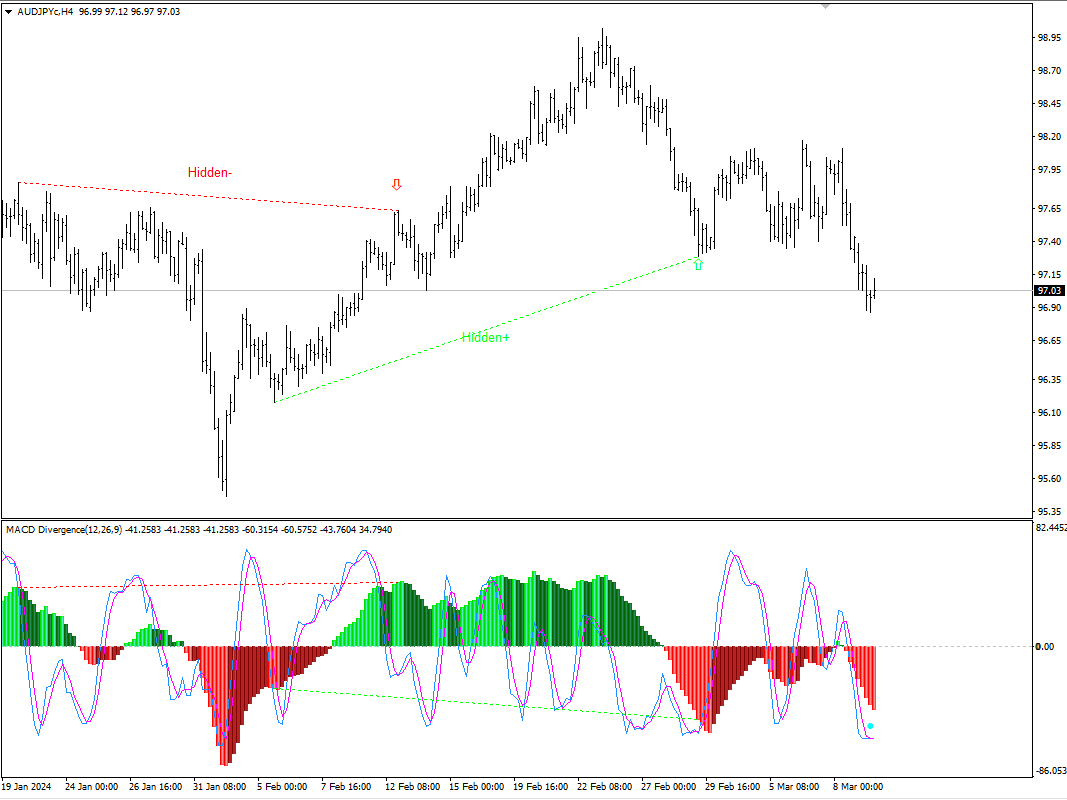
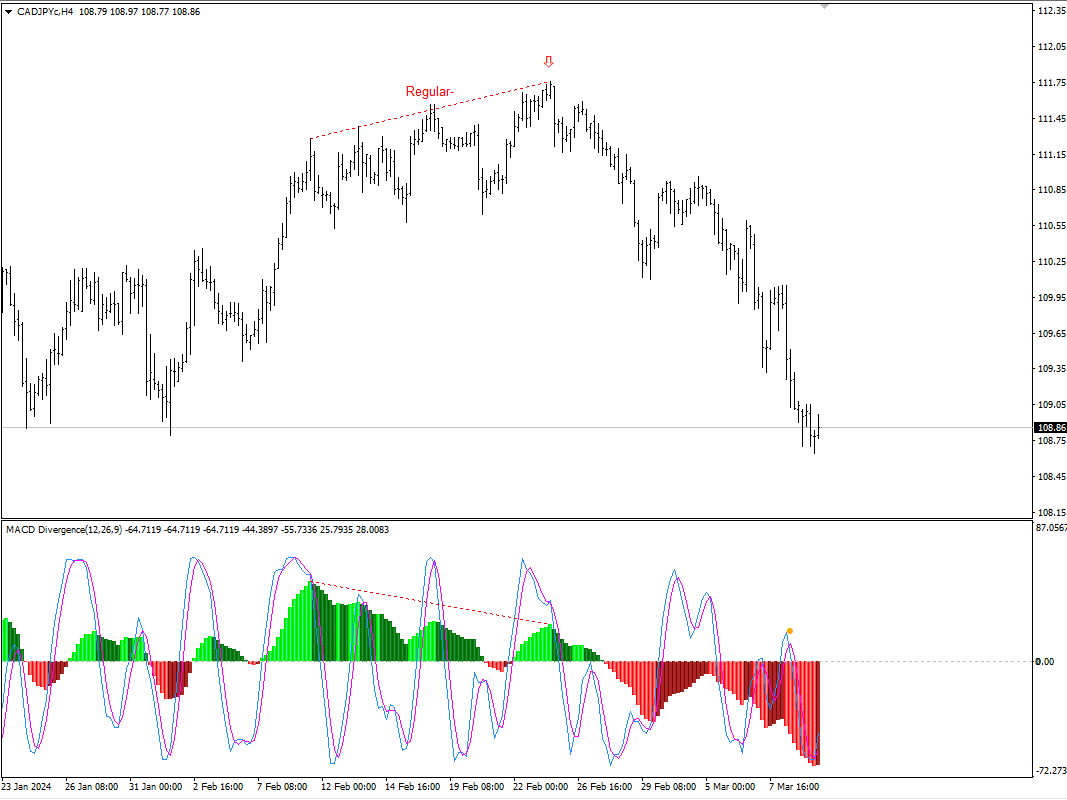
The MACD Divergence
The MACD Divergence is a situation where the price creates higher tops and the MACD creates a raw of lower tops, or the price creates a lower bottom and the MACD creates higher bottoms, MACD Divergence after a significant uptrend indicates that the buyers are losing power and MACD Divergence after downtrend indicates the sellers losing power.
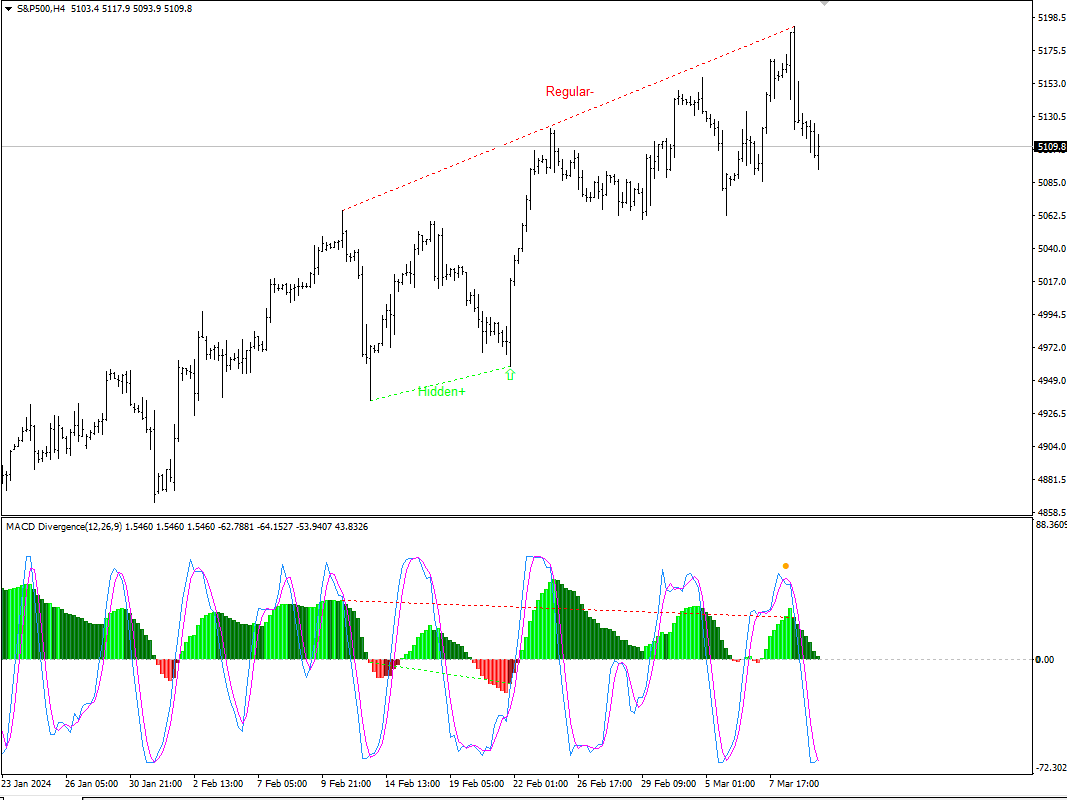
Scalping Strategy MACD Divergence + DTOscillator
This indicator is a trading strategy based on the MACD divergence and the DT-Oscillator
indicator confirmation.
Description of the strategy
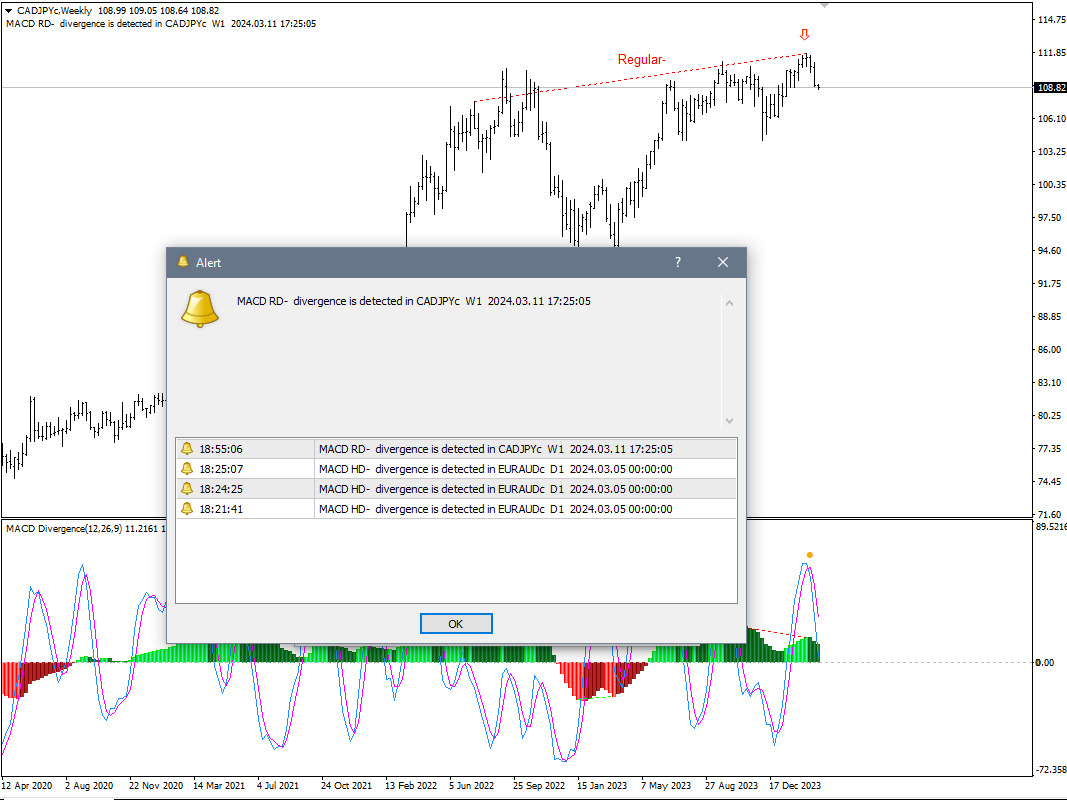
- Enter the trade:
When MACD divergence occurred, wait to bullish cross in DT Oscillator, then open a buy/sell position.
- Stop Loss:
Put the SL on Low/High the last divergence candle.
- Take Profit:
Set TP as equal by SL R/R=1 or more.
- You can use ATR indicator to set SL and TP by Pips. (Fixed SL and TP)