FOTSI Oscillator
- 지표
- Sidi Mohamed El Alaoui
- 버전: 2.0
- 업데이트됨: 3 7월 2024
- 활성화: 5
Buy with a discount of 75% for the unlimited licence the FOTSI!
Offer valid from 01/04/2025 to 10/04/2025!
Hurry Up & Rate the indicator!
FOTSI (Forex Overview True Strength Index) for MT4
FOTSI is an indicator that analyzes the relative strength of currencies in major Forex pairs. It aims to anticipate corrections in currency pairs following strong trends by identifying potential entry signals through overbought and oversold target areas.
Theoretical Logic of Construction:
- Calculation of Individual Currency Momentum: FOTSI starts by calculating the momentum for each currency pair that includes a specific currency, then aggregates by the currency of interest (EUR, USD, GBP, CHF, JPY, AUD, CAD, NZD).
- Application of the TSI Formula: The "True Strength Index (TSI)" formula is applied to the momentum of individual currencies obtained in point 1. This produces an oscillator that oscillates above and below 0.
- Responsiveness and Lag Minimization: FOTSI uses double smoothing on the momentum of individual currencies through TSI. This feature provides the indicator with a clean curve on the oscillator, attempting to minimize delays in trend reversals.
OPERATIONAL SYNTHESIS
A "Mean Reverting" strategy is suggested for the indicator, with the following suggested operational steps to identify, open, and close positions.
The identification areas are as follows:
- OVERBOUGHT: Greater than 50.
- OVERSOLD: Less than -50.
- FLAT AREAS: Between -25 and +25.
- It is advisable to use it on H1, H4, and D1 timeframes.
- When applied to the chart, the oscillator varies when changing the timeframe.
- If the timeframe remains the same but the currency pair changes, the indicator stays the same (as it represents currency strength).
- The two moving averages applied in the TSI formula are on 25 and 15 periods. These are standard values but can be changed to lower values if more investment opportunities are desired (which can also cause an increase in false alarms).
The suggested operation is as follows:
- Currency Identification: Identify a currency in the overbought area (+50) or oversold area (-50).
- Selection of Opposite Currencies: Identify currencies opposite the flat area (in the case of overbought in point 1, the currencies to identify will be those <-25, conversely >+25).
- Opening the Position: Open the currency pair composed of the two identified currencies. The position is opened when there is convergence towards the center of the identified curve, either in overbought or oversold. It opens at the beginning of the new candle after registering the FOTSI convergence on the indicated currency.
- Closing Conditions: At the discretion of the trader, it is suggested to close when the price surpasses the 50-period and 100-period exponential moving averages (thus opening 2 positions in point 3).
- Stoploss and Position Sizing: It is recommended not to use a stoploss. If necessary, set it to 5 times the ATR on the reference timeframe. Pay attention to position sizing, as it is a countertrend strategy.
Practical Example (related to the points above):
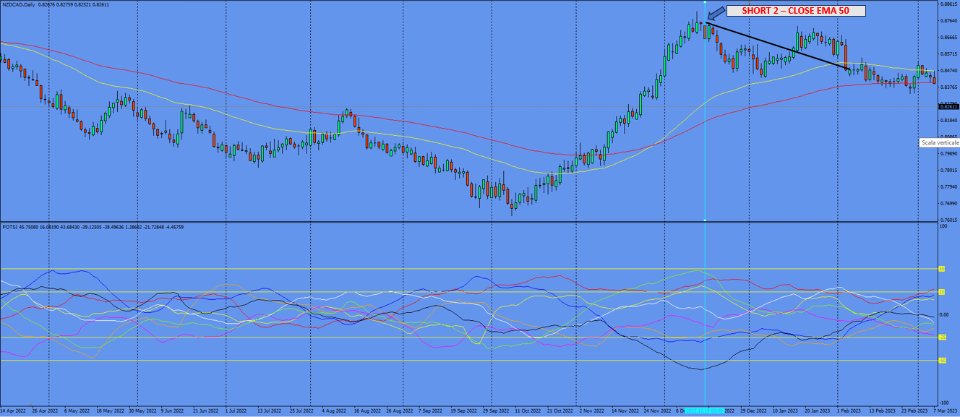
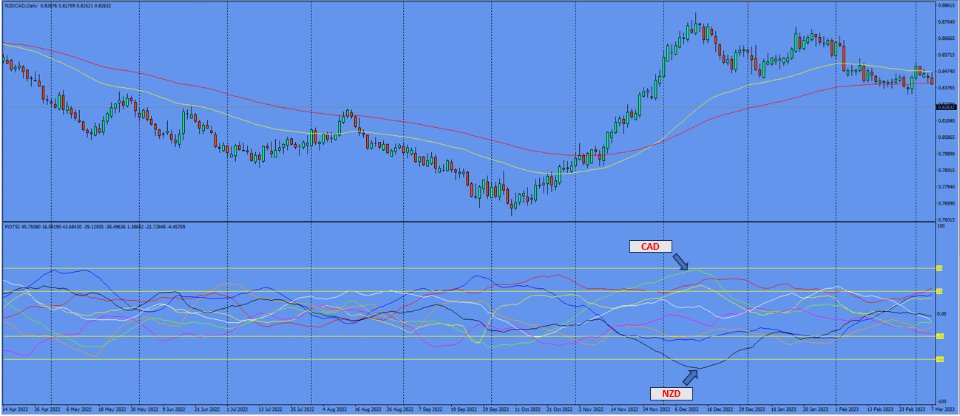
- Identified oversold in Dec-2022 on NZD (below -50), opposite currencies CAD, EUR, and GBP (above +25). In this example, only screens of the NZDCAD case will be shown [IMG_1.png].
- Open the first Short position on NZDCAD to close it at the previous close below EMA100 (red line) [IMG_2.png].
- Open the second Short position on NZDCAD to close it at the previous close below EMA50 (yellow line) [IMG_3.png].
SETTINGS and INPUTS
The DEFAULT settings are suitable for all charts.
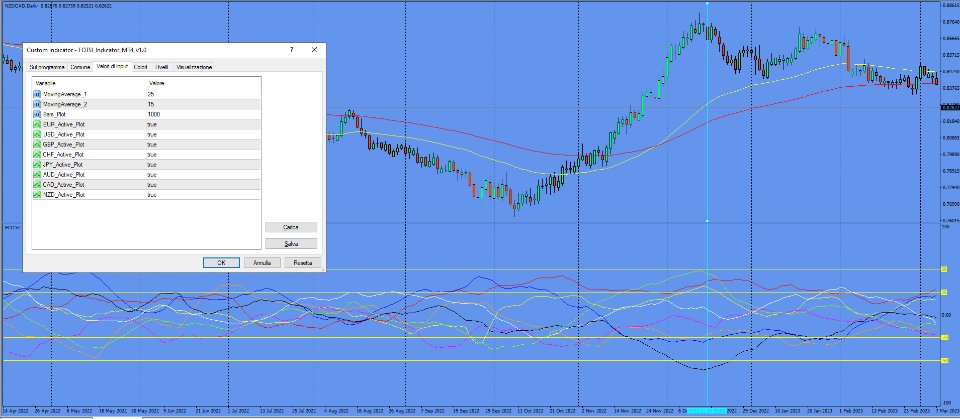
The explanation of inputs follows [IMG_4.png]:
- MovingAverage_1 and MovingAverage_2: Periods of the two moving averages to apply the TSI formula.
- Bars_Plot: Number of candles to apply FOTSI (the first candles starting from the left will have a FOTSI not to consider; this aspect will be improved in the next release). It is advisable to keep it at 1000.
- EUR_Active_Plot, USD_Active_Plot...etc: Parameters that allow showing various currencies in the oscillator window.
How to use the parameters (version 1.0 of the indicator):
- For a macro analysis of all currencies, keep all currencies active (Active_Plot = TRUE) and Bars_Plot = 1000, on the indicated timeframes.
- For a specific analysis of 2/3 currencies, deactivate the others (also for convenience in viewing) and try increasing Bars_Plot for a greater historical depth.
- Keeping all currencies active and Bars_Plot>1000 may cause the indicator to slow down due to too much data to process. It is advisable to adhere to the above recommendations.
FUTURE DEVELOPMENTS:
Following is the roadmap for FOTSI developments:
- Optimization of the current version on Bars_Plot parameters and oscillator update performance + addition of alerts (MT4 Pop Up + Email).
- Propagation of the indicator on the MT5 platform (https://www.mql5.com/it/market/product/116857?source=Site+Profile+Seller).
- Creation of an Expert Advisor to automate the entire operation.
DISTRIBUTION
-
All rental and purchase licenses include: 5 activations per user on 5 different computers owned by the buyer.
-
No expiration date for installations if purchased.
-
For contact regarding improvement suggestions and/or technical support: mt4.datatrade@gmail.com

