• 미리보기
  • 리뷰
  • 코멘트
  • 새 소식

MTF Precise Price Action Arrow Filtered Model T

안녕하세요 상인 여러분.

최고의 거래 도구를 소개합니다.


MTF PPAAF 모델 T.

다중 시간 프레임 정확한 가격 조치 화살표가 모델 T를 필터링했습니다. 

이 거래 도구는 수년간 다양한 거래 도구를 만든 후 최고의 작품입니다.

이 거래 도구가 왜 최고이고 신뢰할 수 있습니까? 

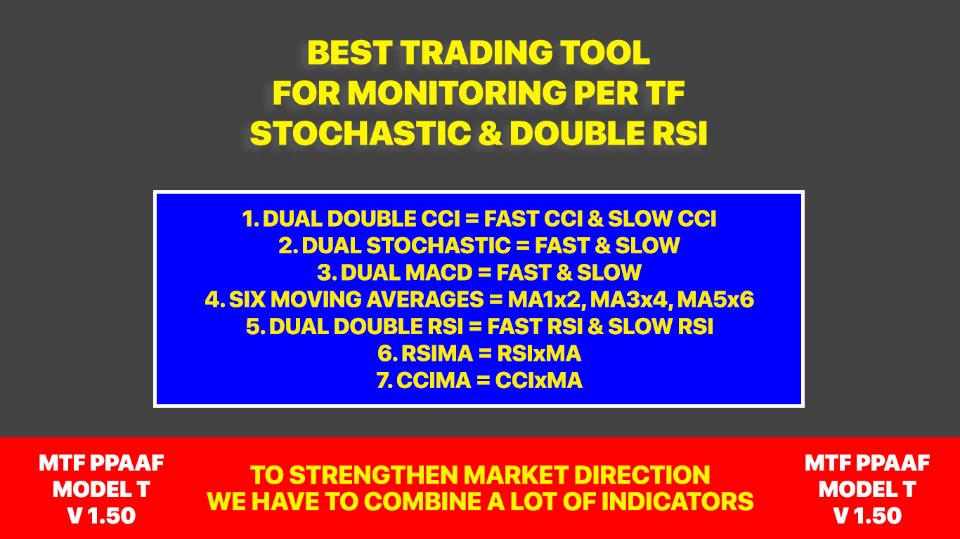
1. 이 도구는 6가지 지표를 사용합니다. 

🔹이중 CCI = 빠른 CCI x 느린 CCI
🔹듀얼 스토캐스틱 = 빠른 스토캐스틱(빠른 스토캐스틱 주선 x 빠른 스토캐스틱 신호선) 및 느린 스토캐스틱(느린 스토캐스틱 주선 x 느린 스토캐스틱 신호선) 
🔹듀얼 MACD = 빠른 MACD(빠른 MACD 메인 라인 x 빠른 MACD 신호 라인) 및 느린 MACD(느린 MACD 메인 라인 x 느린 MACD 신호 라인)
🔹6가지 이동 평균 = MA 1 x MA 2, MA 3 x MA 4 및 MA 5 x MA 6
🔹듀얼 더블 RSI = 빠른 DRSI(빠른 DRSI 메인 라인 x 빠른 DRSI 신호 라인) 및 느린 DRSI(느린 DRSI 메인 라인 x 느린 DRSI 신호 라인)
🔹RSIMA = RSI x MA

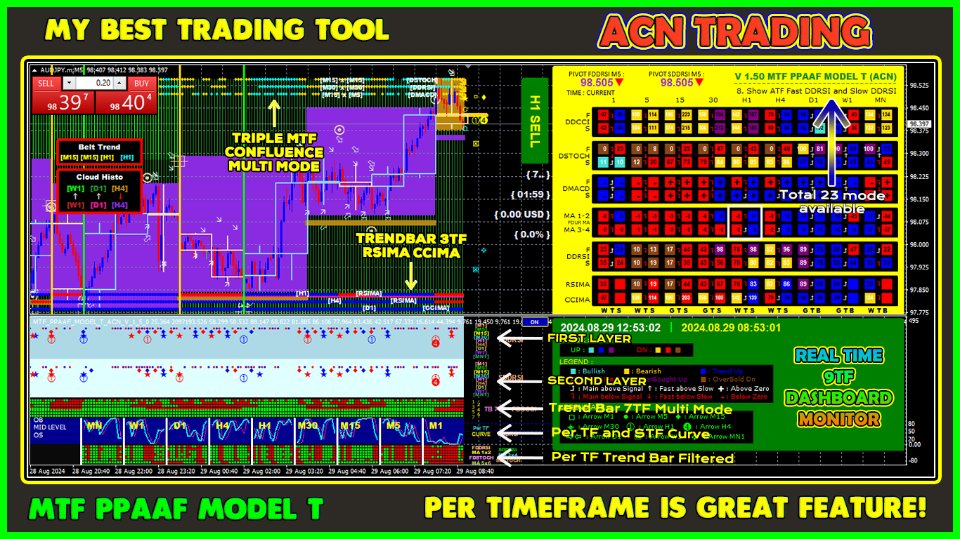
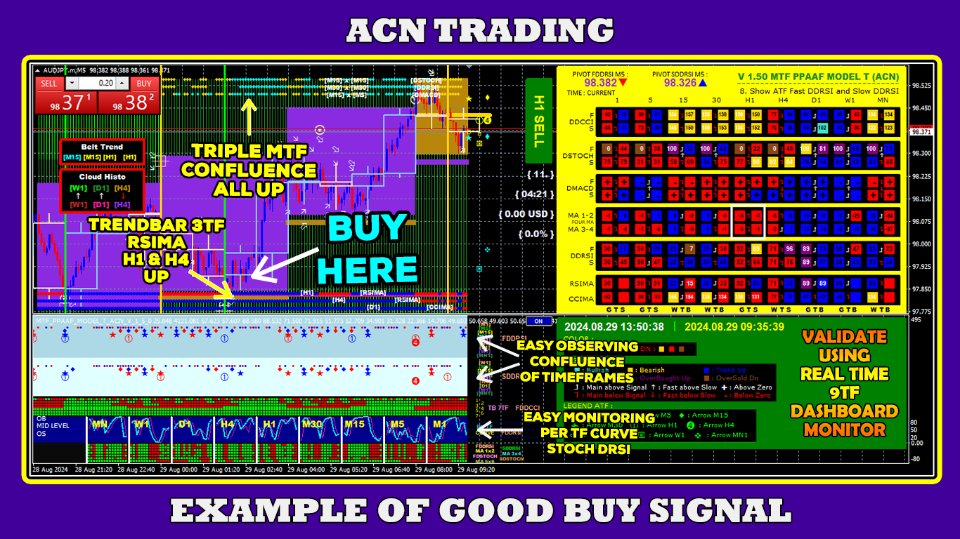
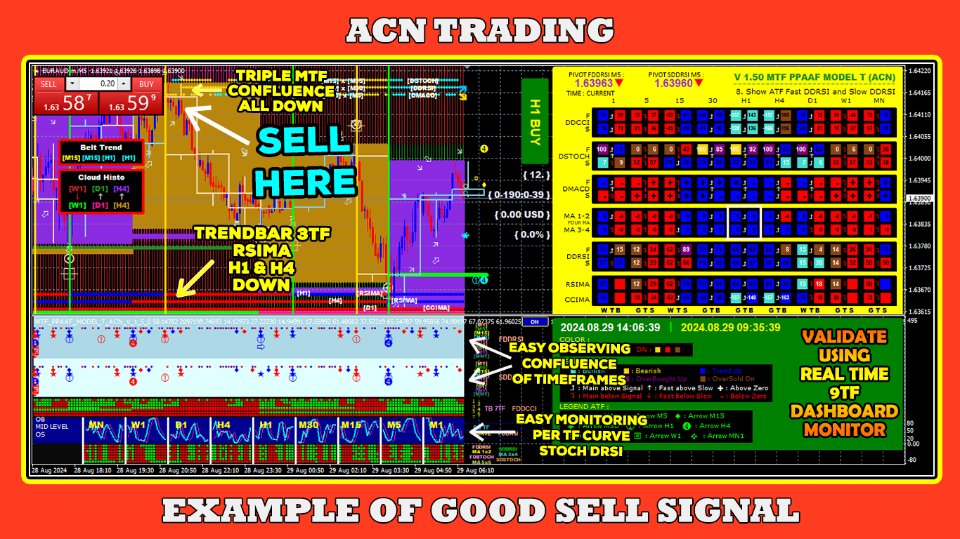
2. 실시간 9TF 대시보드 모니터(첫 번째 대시보드).


이 대시보드는 위 6개 지표의 데이터에 대한 실시간 정보를 제공합니다. 
신호선 위 또는 아래에 메인 라인이 있습니다. 
긍정적으로 상승할 것인가, 부정적으로 하락할 것인가.
OBOS 수준인지 아닌지. 
더 낮은 기간에 거래하면서 더 높은 기간의 시장 구조를 모니터링하는 것은 쉽습니다. 

3. 첫 번째 대시보드에는 다양한 기능이 탑재되어 있습니다.

🔹20가지 색상 구성이 있습니다. 지루해지면 쉽게 교체할 수 있습니다.
🔹현재 로컬 컴퓨터 시간 및 브로커 시간.
🔹피벗 가치.
🔹리플레이 시스템. 
🔹TSPI. 

4. 23가지 모드 중에서 선택할 수 있습니다.

🔹모드 1: MA 1x2 및 MA 3x4의 ATF 교차 화살표를 표시할 수 있습니다.
🔹모드 2: FAST DSTOCH 및 FAST DDRSI의 ATF 교차 화살표를 표시할 수 있습니다.
🔹모드 3: FAST DSTOCH 및 SLOW DDRSI의 ATF 크로스오버 화살표를 표시할 수 있습니다.
🔹모드 4: SLOW DSTOCH 및 FAST DDRSI의 ATF 교차 화살표를 표시할 수 있습니다.
🔹모드 5: SLOW DSTOCH 및 SLOW DDRSI의 ATF 교차 화살표를 표시할 수 있습니다.
🔹모드 6: FAST DSTOCH 및 SLOW DSTOCH의 ATF 교차 화살표를 표시할 수 있습니다.
🔹모드 7: FAST DDRSI 및 SLOW DDRSI의 ATF 크로스오버 화살표를 표시할 수 있습니다.
🔹모드 8: FAST DSTOCH 및 MA 1x2의 ATF 교차 화살표를 표시할 수 있습니다.
🔹모드 9: FAST DSTOCH 및 MA 3x4의 ATF 교차 화살표를 표시할 수 있습니다.
🔹모드 10: SLOW DSTOCH 및 MA 1x2의 ATF 교차 화살표를 표시할 수 있습니다.
🔹모드 11: SLOW DSTOCH 및 MA 3x4의 ATF 교차 화살표를 표시할 수 있습니다.
🔹모드 12: FAST DDRSI 및 MA 1x2의 ATF 크로스오버 화살표를 표시할 수 있습니다.
🔹모드 13: FAST DDRSI 및 MA 3x4의 ATF 크로스오버 화살표를 표시할 수 있습니다.
🔹모드 14: SLOW DDRSI 및 MA 1x2의 ATF 크로스오버 화살표를 표시할 수 있습니다.
🔹모드 15: SLOW DDRSI 및 MA 3x4의 ATF 크로스오버 화살표를 표시할 수 있습니다.
🔹모드 16: DCCI 및 FAST DSTOCH의 ATF 크로스오버 화살표를 표시할 수 있습니다.
🔹모드 17: DCCI 및 SLOW DSTOCH의 ATF 교차 화살표를 표시할 수 있습니다.
🔹모드 18: DCCI 및 FAST DDRSI의 ATF 크로스오버 화살표를 표시할 수 있습니다.
🔹모드 19: DCCI 및 SLOW DDRSI의 ATF 크로스오버 화살표를 표시할 수 있습니다.
🔹모드 20: DCCI 및 FAST DMACD의 ATF 크로스오버 화살표를 표시할 수 있습니다.
🔹모드 21: DCCI 및 SLOW DMACD의 ATF 크로스오버 화살표를 표시할 수 있습니다.
🔹모드 22: MA 1x2 및 MA 5x6의 ATF 교차 화살표를 표시할 수 있습니다.
🔹모드 23: MA 3x4 및 MA 5x6의 ATF 크로스오버 화살표를 표시할 수 있습니다.

5. 리플레이 시스템.

이 기능은 이제 첫 번째 대시보드뿐만 아니라 Per TF Stoch DRSI 곡선에도 적용 가능합니다. 
정말 대단해요.
이 기능을 사용하면 특정 날짜와 시간으로 과거로 돌아갈 수 있습니다. 
예를 들어 3일 전 특정 날짜와 시간에 강한 매도세를 보인 이유를 분석하는 것은 쉽습니다. 

6. TSPI = 시간 스프레드 이익 정보. 

이 기능은 실시간 거래 중 시간, 스프레드 및 손익에 대한 실제 데이터를 제공합니다.

7. 현재 로컬 컴퓨터 시간 및 브로커 시간.

이 기능은 귀하의 컴퓨터 시간과 브로커 시간의 실시간 시간을 알려줍니다.

8. 두 번째 대시보드.

🔹 11가지 색상 구성 가능

🔹 레이어 1, 레이어 2

🔹 트렌드 바 5TF 멀티 모드

🔹 MTF 이중 곡선

🔹 TF Stoch DRSI 곡선당

🔹 MA 1x2, MA 3x4 및 MA 5x6으로 필터링된 TF별 추세 막대


9. 레이어 1과 레이어 2.

모든 시간대(ATF) 교차 화살표를 모니터링하는 것은 매우 중요합니다. 
이것이 바로 이 도구에 두 개의 레이어가 장착된 이유입니다. 
첫 번째 ATF 교차 화살표는 레이어 1에 위치합니다.
두 번째 ATF 교차 화살표는 레이어 2에 위치합니다.

10. 추세 표시줄 5개 시간 프레임 다중 모드.

🔹모드 1 : DCCI 기반
🔹모드 2: DSTOCH 기반
🔹모드 3: DMACD 기반
🔹모드 4 : DRSI 기반
🔹모드 5 : MA1x2 기반
🔹모드 6: MA3x4 기반
🔹모드 7: MA5x6 기반
기간의 경우 M5, M15, M30, H1 및 H4를 사용하는 것을 좋아합니다.
5TF 추세 막대가 M5부터 H4까지 모두 동일한 색상을 표시하면 강력한 매수/매도 신호가 있는 것입니다.

11. TF Stoch DRSI 곡선 기준.

시각적으로 모니터링할 수 있는 정말 좋은 기능입니다.
Stoch DRSI가 여전히 교차하는지 아니면 M1에서 MN으로 교차하는지 실시간으로 확인할 수 있습니다. 
이 기능을 통해 우리는 올바른 입장 시간을 알 수 있습니다. 
Per TF Stoch DRSI Curve에도 재생 시스템을 적용할 수 있습니다. 
이것은 훌륭한 기능입니다!
다음의 TF별 추세 막대도 볼 수 있습니다.
🔹DRSI 1
🔹DRSI 2
🔹MA 1x2
🔹MA 3x4
🔹스톡 1
🔹스톡 2

🔹MA 5x6

12. MTF 듀얼 스토크 DRSI 곡선.


이 기능을 사용하면 이중 확률론적 및 이중 이중 RSI의 MTF 곡선을 활성화하도록 선택할 수 있습니다. 

듀얼 DRSI 고속 M5 및 저속 M15 매개변수는 기본적으로 켜져 있습니다. 


13. 차트 창에서.


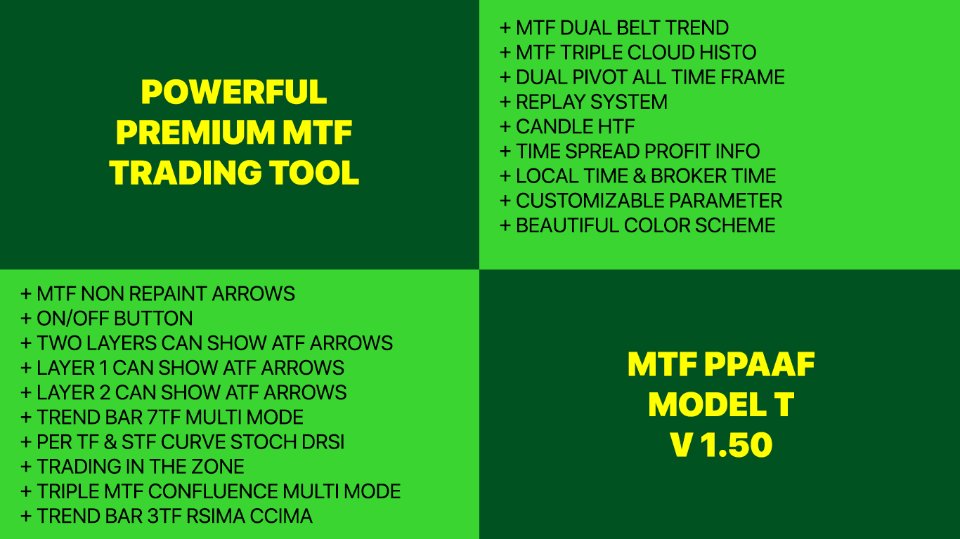
🔹 이중 MTF 벨트 트렌드


🔹 Confluence MTF 다중 모드


🔹 듀얼 MTF 클라우드 히스토그램


14. 이중 MTF 벨트 동향.


벨트 추세는 기본적으로 두 이동 평균의 교차를 기반으로 합니다. 

매개변수, 기간, 화살표 및 색상을 사용자 정의할 수 있습니다. 


15. Confluence MTF 멀티 모드.


합류는 TF 1과 TF 2의 교차점이 있으면 화살표가 나타나는 것을 의미합니다. 

명확하게 말하면 TF 1이 다운되고 TF 2가 다운되면 아래쪽 화살표가 나타납니다. 

마찬가지로 TF 1이 올라가고 TF 2가 올라가면 위쪽 화살표가 나타납니다.

🔹모드 1: 듀얼 더블 RSI 기반

🔹모드 2 : 이중 확률론 기반

🔹모드 3: 듀얼 MACD 기반

그리고 검사를 훨씬 더 명확하게 하기 위해 수직선 합류가 있습니다. 


16. 이중 MTF 클라우드 히스토.


Cloud histo는 기본적으로 두 이동 평균의 교차를 기반으로 합니다. 

매개변수, 기간, 히스토 색상을 사용자 정의할 수 있습니다. 


17. 캔들 하이 타임 프레임.


더 낮은 기간에 차트를 열면서 더 높은 기간의 시장 구조를 모니터링하는 것은 쉽습니다.

기본적으로 캔들 HTF는 H1에 설정되어 있습니다. 


18. 지역 내 거래(TITZ).


🔹MA3 x MA4를 기반으로 한 수직선 TITZ.

🔹MA1 x MA2를 기반으로 한 수평 라인 TITZ.

🔹 MA1 x MA2를 기준으로 수평선 TITZ 값을 피벗합니다.

🔹MA3 x MA4를 기준으로 TITZ 상태를 구매하고 판매하세요.

매개변수, 기간, 색상을 사용자 정의할 수 있습니다. 


오늘의 프로모션을 활용해보세요. 나는 수년간의 연구를 통해 탄생한 이 정교한 제품을 $2,500의 가격에 판매해야 합니다.


+ 본 상품 구매자는 Zoom 세션을 이용하실 수 있습니다.


지금 다운로드하여 수익을 창출해 보세요!


감사합니다.

추천 제품
PTW NON REPAINT TRADING SYSTEM + HISTOGRAM Non-Repainting ,   Non-Redrawing   and   Non-Lagging  Trading System. Does the following: - Gives Accurate Entry and Exit Points - Scalping, Day and Swing Trading  - 95% Accuracy  - Targets, where to take profits. - Shows Trends, Support and resistance levels - Works on All Brokers - Works on All Currencies, CFDs and Stocks - It does not place trades for you, it only shows you what trades to place. - It works on All Timeframes - It is for Trend or ra
Reversal Overlap Bot is an automated trading strategy. No technical indicators are used in the work. At the beginning of trading, the first order is placed in a certain direction (at your option). When you open a new candle, this order is closed if it is in profit. Otherwise, the next order opens in the opposite direction. Orders are closed when profit is reached. If there are unprofitable orders on the chart, the robot will close one of them. When closing loss-making orders, the profit covers t
This trading expert advisors is an clone & upgrade of  "EA Rough Duster ", also trades best on GBPNZD minute 5 timeframe. Maintains a constant account growth and runs best on low spread and commission based accounts. Uses Martingale & perfect hedging to recover unprofitable positions ensuring no loss. Its consistent profit curves,low DrawDowns & risk proves the record for itself in reliability and consistency plus its unique market analysis ensures quick extraction of profits by scalping the mar
FTC Neuro
Aliaksandr Ausiyevich
혁신적인 거래 솔루션의 세계에 오신 것을 환영합니다! 우리는 최신 거시 경제 통계 및 현대 신경망 계산을 기반으로 작업,당신의 관심을 우리의 고급 거래 고문 공정위 신경에 제시한다. 고문은 복잡한 알고리즘을 사용하여 시장 상황을 분석하여 고급 인공 지능 알고리즘을 사용하여 경제 정보의 숨겨진 패턴을 인식합니다. 그것은 당신에게 가장 전문적인 거래 경험을 제공하여 거래 진입 및 종료에 대한 고유 한 포인트를 제공합니다. 모든 사람들은 고품질 거래가 항상 위험과 이익 사이의 균형이라는 것을 알고 있습니다. 우리는 고유 한 위험 관리 시스템을 개발했으며 고문은 귀하의 자본을 안전하게 유지하기 위해 신중하게 관리합니다. 공정위 신경 거래 고문으로 거래 전략을 자동화하고 복잡한 결정을 단순화하십시오! 위험을 최소화하면서 자본을 늘릴 수있는 기회를 얻으십시오! 그리고 이 모든 것-미래에 대한 편안함과 자신감. 오늘 우리의 무역 고문을 시도하고 전문적이고 높은 품질의 거래의 세계에 빠져! 고문
Kilimanjaro EA
Botond Ratonyi
5 (1)
Check out my youtube channel about forex trading robots:  https://www.youtube.com/channel/UCL_p6fuQtNkg-1rRY69t5Ig Message me on telegram if you have any questions:  https://t.me/BRobotTrader H1 TIMEFRAME Updates and improvements(2021.08.12): USE THE SET FILES FROM THE COMMENT SECTION! This is the biggest update in the life of the KILIMANJARO EA, it got new features and NEW engine, plus many new parameters to optimize and play around with. ---It got the official TheNomadTrader
Oscillator helps determine the direction of the market Shows the direction of the price movement and is painted in the appropriate color. Allows you to conduct trend and counter trend trading It works on all timeframes, on any currency pairs, metals and cryptocurrency Can be used when working with binary options Distinctive features Does not redraw; Simple and clear settings; It works on all timeframes and on all symbols; Suitable for trading currencies, metals, options and cryptocurrency (Bitco
Radar Fibo 123
Carlos Augusto Cedeno Rocha
https://www.mql5.com/es/signals/1654340 이 도구를 사용하면 승자 SL을 자동으로 실행할 수 있습니다. 최소 복권 항목을 지원 및 저항으로 사용하여 피보나치 레이더 Fibo 123 전략을 형성하십시오. 그 지지와 저항에 있는 모든 것에 대해 공격적이 되십시오. i doguleul sayonghamyeon seungja SLeul jadong-eulo silhaenghal su issseubnida. choeso boggwon hangmog-eul jiwon mich jeohang-eulo sayonghayeo pibonachi leideo Fibo 123 jeonlyag-eul hyeongseonghasibsio. geu jijiwa jeohang-e issneun modeun geos-e daehae gong-gyeogjeog-i doesibsio.
This is a correlation hedge type indicator which helps trade the obscure relationship between crude oil and natural gas markets. Which is overall an unknown trading concept to most traders, yet a very impressive one. The usual market risk is mittigated through the smooth trend of hedge tading, as well as the leading signals the indicator provides! Pros: low risk trading, normal profits, no need to be right about either market Cons:  requires large capital ----------------------------------
Premium M15
Raphael Schwietering
Dear Investor, I am a full-time system developer since 2010, having developed thousands of trading systems in the last 11 years. My main goal when developing a strategy is long-term growth. All my systems have to pass strict criteria in terms of backtests, out-of-sample validations on unseen symbols, Monte Carlo simulations on different data feeds, slippage, and increased spreads.  It: Trades the EURUSD M15 with a focus on long-term growth. Opens trades at bar and uses no martingale nor any gri
This EA can run on every currencies pairs recommend EURUSD, USDJPY, EURJPY, GBPUSD Timeframe 30 Minute (M30) The important advantage of this EA is that you can start to trade with $1000 min imum initial Deposit. And the robot can support your manual transactions on EURUSD. ACCOUNT LEVERAGE: 1:100 ACCOUNT (Stop Out): 50% or less ACCOUNT TYPE: Real account ACCOUNT MODE: Hedging account Take Profit: Automatically Stop Loss: Automatically LOT size: Manual first order
Golden Move 2
Damian Mateusz Wojtowicz
The best indicator out there, try it yourself! Please leave your positive comments and reviews! Settings: AlertConfirmation: truns on and off alerts CalculatedBars: how many bars will be calculated Distance : arrow distance Buffers: Buffer0 (Arrow Buy) Buffer1 (Arrow Sell) Buffer2 (Empty) Buffer3 (Empty) Buffer4(Buy value == 1) Buffer5(Sell value ==1)
According to my 18+ years of trading experience, it is too naive to believe that you will get rich by buying a junk EA and let it run automatically without any fundamental knowledge in investment. For those who want to be serious about investing they should buy this EA and train themselves as professional traders with appropriate minimal intervention to the EA. User friendly Interface. On panel fat finger protection. High speed for sending   manual  orders. Auto follow up for manual orders pla
Please download User Guide / set files / Strategy Tester Report from here: https://www.mql5.com/en/blogs/post/689449 Twins Grid System is a powerful and flexible tool for experienced trader. This system is consist of 2 full grids: Grid A and Grid B, each full grid contains 4 basic grid: BuyLimits Grid, SellLimits Grid, BuyStops Grid and SellStops Grid. There are 31 system parameters, 22 parameters for each basic grid. It’s able to create various kinds of grid strategies. Features (1) Some grid
Fisher Steels
Ivan Simonika
The   Fisher Steel  bot implements the maximum of the HFT definitions. The expert system goes through the entire history and all currency pairs with a single setting. If there is a commission on the account, it must be converted into the equivalent of the spread and fill in the Commission field. Both virtual and real stop losses are used. Normal working conditions: The lower the commission and the spread, the greater the profit. The more latency your broker has in the amount of the Internet c
Vision Fx v
Samuel Nancwat Isaac
Introducing the Vision fx EA, a sophisticated trading robot designed to capitalize on the dynamic interplay of short-term and long-term reversal patterns within the Forex market. Unlike other robots, this EA avoids grid, or arbitrage strategies, ensuring a secure and calculated trading experience. Perfect for traders of all backgrounds, whether seasoned or beginners, the vision fx EA accommodates all skill levels. This versatile trading system comes packed with features, including guarding ag
I will support only my client. สำหรับลูกค้า Parameters General Trade Settings Money Management  Lot : Fixed (can change) Strategies  - M1-D1 Strategies it is fixed with MA, Bollinger band, Candlestick Levels Close Functions  - M1-D1 Strategies Close by Money Profit  - Close Total Open Profit, Close Total Open Profit Short, Close Total Open Profit Long, Close Profit/Loss Today MagicNumber  - individual magic number. The EA will only manage position of the chart symbol with this magic number.
This system never paints.   This system created by using Envolpes bands and reverse bar count.   This indicator is only working in M5 period.   This system is for long term and profitable.   Signals are shown as arrows. as an optional limit orders.   You can set a voice alarm or email notification.   You can fins our other products from link : https://www.mql5.com/en/users/drbastem/seller   Also, you can ask all your questins from email : haskayafx@gmail.com or mobile : +90 530 867 5076 or @Meh
Genotype mt4
Tatiana Savkevych
Genotype : Your reliable guide in the world of Forex Genotype is an advanced Forex trading bot specifically designed for traders seeking efficient and automated trading. This innovative tool offers a wide range of features and capabilities to enable traders to effectively manage their trades and strategies. Special offer for early adopters: price reduced, but will be increased in the future. Tools for work: EURUSD, AUDCAD, AUDCHF, AUDJPY, AUDNZD, AUDSGD, AUDUSD, CADCHF, CADJPY, GBPSEK, GBPS
Boost binary option profesional
Sebastian Alejandro Merino Sepulveda
Binarias & Forex (+90% Ratio-Win Next Candle) Espere que el precio llegue a una buena zona (fuerte) sea soporte, resistencia, zona de oferta o demanda, fibonacci level key, cifra redonda. Haciendo lo anterior definitivamente habrá una reversión en el precio y obtendrá su ITM en primera vela dando una efectividad del 100% siguiendo la tendencia. Es muy importante estar atento a las noticias fundamentales en el mercado y estas no afecten tu trading. Sesiones comerciales: cualquiera (24 horas).
Golden Range 2
Damian Mateusz Wojtowicz
Golden Range 2 is one of the top entry indicators securing its future with its results.  Indicator settings: Points = how precise pattern detection is AlertConfirmation = turn on(true) off(false) alert CalculatedBars = how many bars will be calculated Please leave Positive comments, reviews. Buffer 0 Buy Arrow, Buffer 1 Sell Arrow, Buffer2 Buy Signal(Value:1/0), Buffer3 Sell Signal(Value:1/0)  Buy Green, Sell Red
This Expert Advisor has Three Trading Strategies: TRADING_STRATEGY_ONE - Intra Day / Short Term Trading Strategy. TRADING_STRATEGY_TWO - Mid Term / Long Term Trading Strategy. TRADING_STRATEGY_THREE - SMART__NEWS__TRADER - High Impact News Trading Strategy With 25 Years NFP History Trading in GBPUSD, EURUSD &  AUDUSD. NOTE: Default Settings Already Optimized For GBPUSD. Other symbols require optimization. Much and careful work has been done to package this E.A. all together. Having tested it w
Mongol Indicator2
Sumiyabazar Buyanjargal
It's a variation of mid of HH and LL since it compares the higher of HH or LL against a period and twice the number of bars back to avoid whipsaws. I used to display this against lines on a chart, but made a histogram out of it and it looks interesting. It looks good at gauging trend strength and general turns (see image below). The name of the indicator is BAM, which is an acronym for "Below and Above Mid". Ways to use it: 1. To see general trend on longer TFs (more than 30 ba
**Multi-Strategy EA with Advanced Statistical Analysis (ANOVA & R-squared)** **Core Statistical Framework:** 1. **ANOVA Analysis:**    - One-way ANOVA: For trend direction significance    - Two-way ANOVA: For market variable interactions    - P-value thresholds < 0.15 for trade validation 2. **R-squared Analysis:**    - ATR R² (Strong correlation ≥ 0.75)    - Standard Deviation R² (Moderate: 0.50-0.74)    - EMA R² (Weak: 0.25-0.49)    - Combined R² for overall market state    - Determines s
EPriceJPY
Ngo Yung Lau
EPriceJPY is a auto-trading EA focused on USDJPY. Trading Concept The operation concept of EPriceJPY is based on an algorithm that tries to determine the Trend. To be more specific, EPriceJPY works with its own calculation logic based on simulation. It is trying to find out the Top or Bottom in a Trend, and open the Short or Long Position accordingly. Don't expect EPriceJPY to open the trade on the highest or lowest level, because EPriceJPY will trade only when the Top/Bottom can be confirmed.
Meat EA
Roman Kanushkin
5 (1)
The Meat EA is a fully automatic, 24-hour trading system. It trades based on analysis of market movement on the basis of a built-in indicator and the Moving Average trend indicator. The system is optimized for working with the EURUSD currency pair on the M30 timeframe. It is recommended to use an ECN/STP broker with low spread, low commission and fast execution. Signal monitoring Working currency pair/timeframe: EURUSD M30. Advantages never trades against the market; the higher the risk, the h
The indicator scans for TD Combo signals in multiple timeframes for the all markets filtered and shows the results on Dashboard. Key Features Dashboard can be used for all markets It can scan for signals on MN1, W1, D1, H4, H1, M30, M15 ,M5, M1 timeframes Parameters UseMarketWatch: Set true to copy all symbols available in market watch MarketWatchCount : Set the number of symbols that you want to copy from the market watch list. CustomSymbols: Enter the custom symbols that you want to be availa
Forex Play
Ivaylo Petkov
Forex Play EA is an automated Expert Advisor based on smart algorithm and some standard indicators like Bollinger Bands, Stand Deviation etc. Money management - automatic lot calculation based on your risk per trade or manually set; Broker SPY Module (Hidden Take Profit and Stop Loss); Spread and Slippage Protection; High Trading Frequency; Flexible input options to use on different currency pairs; This system uses no grid, no martingale, no arbitrage, no hedges; Parameters Distance from BB fo
The indicator is like a mother-in-law, who talks often, talks a lot and often inappropriately. The indicator, in addition to giving us an entry signal on parameters which I will then list, monitors the trend of the hourly timeframe, OSMA to understand the entry direction, RSI to sense any overbought or oversold conditions from which to abstain, ATR for the volatility and ADX for the trend. Indicator not recommended for newbies. Only the human judgment of these parameters, combined with the e
ATC AlgoZone Indicator
Ameur Boudenne
5 (2)
Algo Trading Indicaor  With this indicator , you’ll have zones and trends that hight probability the price will reverse from it. so will gives you all the help that you need  Why should you join us !?  1-This indicator is logical since it’s working in previous days movement , to predict the future movements. 2-Algo trading indicator will help you to draw trends which is special and are too strong than the basics trend , trends will change with the frame time that you work on . 3-We can
Destiny Master
Victor Adhitya
Your destiny is in your hand, This EA design to control your RISK PER TRADE so even you using the martingale system you can control your drawdown. Every failure of your entry will partial hedge with this ea, so the floating loss will reduce and the drawdown can be controlled. You need Broker with this requirement spesification : - Hedging Account (dont use Netting Account) - Big leverage  - NO SWAP  - NO COMMISION - NO Hidden Cost - Margin Hedge = 0 - Low spread  - Low slippage
이 제품의 구매자들이 또한 구매함
거래 속도는 시장에서 대량 주문이 언제 어디서 누적되는지, 그리고 이로 인한 이점을 보여주는 최고 품질의 지표입니다. 매우 초기 단계에서 추세 변화를 감지합니다. 이는 지표이자 동시에 트레이딩 시스템입니다. 이 개념은 독특하고 수익성이 매우 높습니다. 외환에서 틱 볼륨은 거래량이라고 오해의 소지가 있습니다. 실제로는 단위 시간당 가격 변동으로, 사실상 거래 속도입니다. 이 지표는 외환에서 볼륨에 대한 개념을 완전히 수정하여 올바른 방식으로 논리적으로 정의하고이 논리를 적용하면 독특하고 정확한 최상위 수익성 도구가됩니다. 속도가 증가하면 더 큰 관심과 그에 상응하는 진입 및 출구의 신호입니다. 사용 방법: 이 지표는 시장에서 거래 속도를 측정하고 비교하기 때문에 가장 먼저해야 할 일은 다음과 같습니다.  이러한 비교를 할 기간을 선택합니다.  일반적으로 15일 전이 비교를 위한 좋은 출발점입니다.  인디케이터에 날짜를 입력하고 실행합니다.  30분 또는 1시간의 기간에서
Trading System Double Trend - an independent trading system consisting of several indicators. Determines the direction of the general trend and gives signals in the direction of price movement. Can be used for scalping, intraday or weekly trading. Features Works on any time frames and trading instruments (forex, cryptocurrencies, metals, stocks, indices.) Simple visual reading of information that does not load the chart The indicator does not repaint and does not complete signals Works onl
Mafaranga
Phillimon Shumbusho
The real market buy/Sell signals, you can trust.  This indicator tracks the trend strength, the market strength, the real current volume, and the price direction to give traders and investors the optimum point for entry in the form of signals. The time frames range from 5 minutes to one (1) hour chart. Trading on higher time frames produce the best outcomes, but also do produce less frequent trades, compared to trading on lower time frames.
Oni Scalper
Goh Cheng Wai
5 (2)
Dear Onis, This Indicator is used for   GBPUSD, US30 and GOLD on 1-Min Chart . For US30 , Depending on your broker, Minimum Lot Size will differ from 0.01 to 1.0 lots. My Current Account is trading at 1.0 lots at $1 per point . Please check with your Broker what's the Margin Required for your Minimum lot sizes before you trade on your Real account. I have Forward Tested the indicator for around 6 months before releasing it to the public. ( No Demo is available for the Indicator, Strategy
Precautions for subscribing to indicator This indicator only supports the computer version of MT4 Does not support MT5, mobile phones, tablets The indicator only shows the day's entry arrow The previous history arrow will not be displayed (Live broadcast is for demonstration) The indicator is a trading aid Is not a EA automatic trading No copy trading function The indicator only indicates the entry position No exit (target profit)  The entry stop loss point is set at 30-50 PIPS Or the front
Automatic, live & interactive picture of all trendlines. Assign push, email and sound alerts to the lines of your choice and be informed about price rollback, breakout, rollback after breakout, number of rollbacks, line expiration by double breakout. Correct, drag or delete the lines and interactively tune the line system. https://youtu.be/EJUo9pYiHFA . Chart examples https: //www.mql5.com/en/users/efficientforex Price Interaction Events All events are effective immediately and only after on
The indicator displays the probable ( Support and resistance ) levels. The indicator draws horizontal and trend levels of support and resistance. The indicator settings: Trends - the mode for displaying trend lines or horizontal lines of support and resistance Yes - display trend lines only No - display horizontal lines only UseResource - use the resources built into the indicator. Yes - use the ZigZag indicator from the resources of the product. No - use a custom ZigZag indicator. HistoryBar -
The indicator of a Professional Trader is an arrow indicator for predicting the direction of price movement. I have been working on this indicator since 2014. You can use this indicator as your main indicator, use its entry signals, and use it as your only indicator to find entry points. About the product: Recommended TF [H4-D1-W1]   . The indicator predicts the direction of the next candle. Fits a variety of tools; Flexibility in settings for different instruments and intervals through the
THE GRAFF III
Antonin Skaryd
The [GRAFF] III manual trading system is based on multiple MetaTrader (MT4) indicators. Together, the entire PACK of GRAFF III indicators makes an advanced trading tool. The system consists of over 20 different custom-built indicators which have been carefully selected and tested in the long term to produce strong and efficient trading signals. The particular indicators are based on different mathematical formulas, so the entire system is calibrated to remove false signals from its own indicator
You can fins our other products from link : https://www.mql5.com/en/users/drbastem/seller   Also, you can ask all your questins from email : haskayafx@gmail.com or mobile : +90 530 867 5076 or @MehmetBastem    on telegram application This indicator is used to determine the trend. Standard Osma indicator is used. It has the indicator warning system: beep, e-mail and has three types of alerts, including messages to mobile phone. It shows the best performance on the chart of 5 minutes. When the
You can fins our other products from link : https://www.mql5.com/en/users/drbastem/seller   Also, you can ask all your questins from email : haskayafx@gmail.com or mobile : +90 530 867 5076 or @MehmetBastem    on telegram application This indicator is used to determine the trend. Standard Three Moving Average and ADX indicators are used. It has the indicator warning system (audio, e-mail) and three types of alerts, including messages to mobile phone. It shows the best performance on M5. When
This indicator is used to determine the trend. Standard Three Moving Average and ADX indicators are used. It has the indicator warning system (audio, e-mail) and three types of alerts, including messages to mobile phone. It shows the best performance on M5. When the trend value reaches the value set, the warning system is activated. This indicator works only with Forex symbols. Inputs SoundAlarm = true - Sound Alert Sendmail=true - Send an e-mail in case of a buy or sell signal Sendnotificatio
You can fins our other products from link : https://www.mql5.com/en/users/drbastem/seller   Also, you can ask all your questins from email : haskayafx@gmail.com or mobile : +90 530 867 5076 or @MehmetBastem    on telegram application This indicator is used to determine the trend. Standard MACD indicator is used. It has the indicator warning system: beep, e-mail and has three types of alerts, including messages to mobile phone. It shows the best performance on the chart of 5 minutes. When the
Smooth price for Monarch MT4
Konstantin Gruzdev
3.67 (3)
The Smooth Price technical indicator is used for plotting a smoothed line as close to the price of the financial instrument as possible, and serves to eliminate its noise components. The indicator is part of the Monarch trading system, but here it is presented as an independent technical analysis tool. The indicator is based on the cluster digital filter , which, unlike the ClusterSMA , is applied directly to the price time series. Smooth Price does not redraw (except the very last, zero bar) an
이 인디케이터는 "회귀 채널 도구" 개념을 기반으로 한 강력한 시장 분석 방법을 제공합니다. 이 도구를 활용하여 트레이더는 차트의 회귀 채널을 탁월하게 제어하고 보다 근거 있는 거래 결정을 할 수 있습니다. 회귀 채널 도구는 트레이더 도구 상자 내에서 강력한 도구입니다. 가격 트렌드와 잠재적인 지지 및 저항 수준에 대한 유용한 통찰력을 제공하는 것을 목표로합니다. 이 도구는 특히 트렌드 내의 수정 웨이브를 시각화하는 데 효과적이며 가격 역학의 포괄적인 전망을 제공합니다. 이제 이 인디케이터의 주요 기능과 이점에 대해 더 자세히 살펴보겠습니다: 채널 수준 및 지지/저항: 이 인디케이터의 주요 장점 중 하나는 동적인 지지 및 저항 영역으로 작동하는 채널 수준을 생성할 수 있는 능력입니다. 이러한 수준은 잠재적인 진입 및 이탈 포인트를 식별하는 데 중요하며 거래 전략의 정밀도를 향상시킵니다. 수정 웨이브 수준: 수정 웨이브 수준을 활성화하여 트레이더는 큰 트렌드 내에서 잠재적인 수정을
Green Wall Arrows
Daniel Luchinger
1 (1)
The Name Green Wall : Arrows hits a lot of TP, by changing the idea of non using SL as something bad, but instead use Small TP and a lot of free Margin and Patience. Use micro TP and a lot of Free Margin with this indicator on Forex. It also can be used with Binary Options. This strategy is intended to be traded Manually. This Indicator runs on Open Bar, arrows will delete when price are against it. The only Indicator Parameter is Alerts true/false, all the rest is included inside the code. Arro
Golden Monowave
Ahmed Mohamed Ali
Golden Monowave is monowave indicator, the monowave theory is one of Elliott wave approach and one of most complicate and accurate method. Golden Monowave can shortcut many major steps to identify and describe the monowave. It works on any timeframe and with any trading instrument, including currencies, indices, futures, etc. Input Parameters initial_Bars - set the initial number of bars to calculate. wave_color - select the color of the wave. label_color - select the color of labels. temp_lab
Ticks Size
Viktor Kolmakov
This indicator displays in a separate window the difference between the number of points which increased the price, and the number of points that decreased the price during the time interval specified in the settings. The time interval for calculation is expressed as the number of bars of the chart the indicator is attached to. This approach allows you to evaluate the movement direction (growth or fall) of the instrument's price, the strength of the movement and the size of the movement in point
NostradamusMT4
Andrey Spiridonov
1 (1)
NostradamusMT4 is a powerful indicator from the set of professional trader. The indicator is based on Andrei Spiridonov's original price calculation method (ESTIMATED PRICE) for the current candle price. Advantages The indicator does not redraw. It works on any timeframes. Works with any trading instruments. Perfectly suitable for scalping and trading binary options. Parameters Color - color of the ESTIMATED PRICE FUTURE line. How to work with the indicator The indicator forms the ESTIMATE
BinaryIndicator
Andrey Spiridonov
BinaryIndicator is a highly accurate indicator for trading binary options. It shows excellent results in scalping. This indicator is based in multifactor analysis of trend indicators, as well as confirmation oscillators, which in the end gives an increased accuracy of signals. Advantages of the indicator Increased accuracy of signals. Excellent results when trading binary options with a short expiration time from M30 to M1 . It works on any timeframes. Works with any trade symbols. Parameter
BinaryScalping
Andrey Spiridonov
BinaryScalping is a professional indicator for trading binary options and scalping. The algorithm of the indicator is based on the calculation of pivot points for each time period separately, the location of the price of the trading instrument relative to the pivot points is analyzed and the probability of a trading operation is calculated. The indicator has a built-in filter of trading signals based on the global trend. The indicator is installed in the usual way and works with any trading inst
This is the FXTraderariel PowerTrend . It compute a trendfollowing system based on it own algorithm. It gives you a buy or sell signal based on the trend. It based on the Supertrend, but our Version is not repainting. Furthermoore we added some Improvements and you can get an Arrow, Push or Alert when the trend changes. Depending on the settings it and trading style, it can be used for scalping or long-term trading . The indicator can be used on every time frame , but we advise to use it on H1
REX complete 3in1
Christophe Godart
This is the complete REX package. It consists of the lite, pro and ULTRA version.  Perfect for beginners and intermediates. REX complete is 100% non repaint. The strategy is based on a mix of different strategies, statistics, including pivot points, oscillators and patterns.  As the trading idea consists of a variety of some classic indicators like Momentum, Williams Percent Range, CCI, Force Index, WPR, DeMarker, CCI, RSI and Stochastic, it is clear that the fundamental indicators have being
BinaryUniversal
Andrey Spiridonov
BinaryUniversal is a signal indicator for binary options and Forex. In its work, the indicator uses a complex algorithm for generating signals. Before forming a signal, the indicator analyzes volatility, candlestick patterns, important support and resistance levels. The indicator has the ability to adjust the accuracy of the signals, which makes it possible to apply this indicator for both aggressive and conservative trading. The indicator is set in the usual way, it works on any time period and
Sweet Waffle
Christophe Godart
The arrows are calculated with: -     2 Parabolic  parameters -     2 ADX parameters -     4 Stochastic parameters We recommend to combine it with Parabolic, ZigZag or Elliot waves indicator. Always trade the trend! If you make sure to draw your trend lines and support/resistance zones you will just have to wait for the signal to appear. Take the trade. For Binary Options it is advisable to set the expiry time to 5-15 min in M1 chart. THIS INDICATOR IS ZERO REPAINT Best assets to trade: -
Let´s try to make some real money! Call me profit addicted. I thought why not try to make THE dream come reality. With discipline, a clear strategy and this indicator I focus on entering the perfect trades. This indicator is very easy to use as you will get perfect entry points for Put or Call trades. The arrows are calculated with: -     Momentum  parameters -     Candle stick patterns -     Fundamental Price action We recommend to combine it with Parabolic, ZigZag or Elliot waves indic
SystemPro
Andrey Spiridonov
SystemPro - a professional indicator, is a full-fledged, self-sufficient author's strategy for working in the Forex market. A unique algorithm for analyzing the foreign exchange market is based on the calculation of reference points for three different time periods. Thus, the indicator simultaneously analyzes the long-term, medium-term and short-term price behavior before issuing a signal. The indicator is set in the usual way and works with any trade symbols. Advantages of the indicator It i
Floating Nest
Dzmitry Chentsou
1. What is Floating Nest? This indicator is designed to automate the construction of decision zones (can act as support-resistance levels) according to the Floating Socket strategy. The same indicator allows you to significantly reduce the time when analyzing the behavior of prices in decision areas on historical data. It works on any currency pairs. Time frame: M1-H1. The NEST trading system (Nest) is notable for its simplicity and efficiency when trading currencies, stocks, indice
Dark Sniper
Dmitriy Kashevich
Dark Sniper pointer indicator.  Complete absence of redrawing   The percentage of correct indicator forecasts depends on your settings; the default is period 7 (performed better) The arrow indicates the direction of the next candle and the possible direction of the trend in the future.  Suitable for small timeframes m1 and m5  It is recommended to open transactions from 1 to 2 candles.  The signal appears on the current candle. Open a trade on the next one since the signal is being ge
제작자의 제품 더 보기
[V 1.00] MTF NRPA 5 이동 평균 RTD가 출시되었습니다! 비 다시 그리기 화살표 실시간 대시보드. 최고의 이동 평균 지표를 찾고 있다면 올바른 페이지에 있습니다. 일반적으로 사람들은 두 이동 평균의 교차점(교차)이 다음 가격 추세의 방향을 결정하기 때문에 두 이동 평균을 설정합니다. 빠른 이동 평균이 느린 이동 평균과 교차하고 빠른 > 느린 경우 추세가 상승합니다. 반대로 빠른 이동 평균이 느린 이동 평균과 교차하고 빠른 < 느린 경우 추세가 하락합니다. 두 이동 평균의 단점은 장기적인 추세를 볼 수 없다는 것입니다. 이것이 제가 이 거래 도구를 개발한 이유입니다. 설명 방법은 다음과 같습니다. 이 거래 도구에서는 5개의 이동 평균을 사용합니다. 예, 다섯! 기본적으로 저는 MA 1과 MA 2를 큰 시간 프레임인 H1에 설정했습니다. MA 1과 MA 2의 교차점은 H1 기간에 추세 변화가 있음을 의미합니다. 그런 다음 MA 3 및 MA 4는 현재 시간
하나의 창에서 통화 쌍의 여러 시간 프레임을 분석하면 혼란스러울 수 있습니다. 여러 시간 프레임을 분석하려면 신뢰할 수 있는 지표가 필요합니다. 그 중 하나는 9TF MACD 곡선을 사용하는 것입니다. 나는 단순하지만 신뢰할 수 있고 단 하나의 지표에서 9개의 시간 프레임을 모두 다루는 코드를 만들기 위해 밤낮으로 노력했습니다. 이 표시기의 몇 가지 장점을 살펴보겠습니다. 다채로운 히스토그램. 각 기간의 곡선 색상은 서로 다릅니다. MACD 메인 라인과 시그널 라인의 교차점을 나타내는 화살표. (참고: 나타나는 마지막 화살표는 무시하십시오!) 크리티컬 레벨 라인. 실시간 9TF 대시보드 모니터. 9TF 대시보드 모니터 계산은 한 시간 프레임에서 다른 시간 프레임으로 변경하더라도 매우 정확합니다. 임계 수준보다 높은 곡선과 임계 수준보다 낮은 곡선을 모니터링합니다. 주요 MACD가 신호 MACD 위에 있는지 또는 그 반대인지 곡선을 모니터링합니다. 주 MACD와 신
하나의 창에서 통화 쌍의 여러 시간 프레임을 분석하면 혼란스러울 수 있습니다. 여러 시간 프레임을 분석하려면 신뢰할 수 있는 지표가 필요합니다. 그중 하나는 9TF STOCH RSI를 사용하고 있습니다. 나는 단순하지만 신뢰할 수 있고 단 하나의 지표에서 9개의 시간 프레임을 모두 다루는 코드를 만들기 위해 밤낮으로 노력했습니다. 이 표시기의 몇 가지 장점을 살펴보겠습니다. 다채로운 히스토그램. 각 기간의 곡선 색상은 서로 다릅니다. STOCHASTIC 본선과 신호선의 교차점을 나타내는 화살표. (참고: 나타나는 마지막 화살표는 무시하십시오!) OBOS 레벨 라인. 실시간 9TF 대시보드 모니터. 9TF 대시보드 모니터 계산은 한 시간 프레임에서 다른 시간 프레임으로 변경하더라도 매우 정확합니다. 어떤 곡선이 과매수 수준 위에 있고 과매도 수준 아래에 있는지 모니터링합니다. 메인 STOCH가 신호 STOCH 위에 있는지 또는 그 반대인지 곡선을 모니터링합니다. 메
Analyzing multiple time frames of a currency pair in one window can make you confused. To analyze multiple time frames, you need reliable indicators. One of them is using 9TF RSI MA . I've been working day and night to create code that is simple but reliable and covers all nine time frames in just one indicator .  Let's look at some of the advantages of this indicator: Colorful histogram . The color of the curve in each timeframe is different from one another.  Arrows indicating the crossing of
Analyzing multiple time frames of a currency pair in one window can make you confused. To analyze multiple time frames, you need reliable indicators. One of them is using 9TF MACD Limited Bar . I've been working day and night to create code that is simple but reliable and covers all nine time frames in just one indicator .  Attention! When first installed, the indicator does not look intact. Changing the timeframe will solve the problem. Let's look at some of the advantages of this indicator: C
Analyzing multiple time frames of a currency pair in one window can make you confused. To analyze multiple time frames, you need reliable indicators. One of them is using 9TF STOCH RSI LIMITED BAR . I've been working day and night to create code that is simple but reliable and covers all nine time frames in just one indicator .  Attention! When first installed, the indicator does not look intact. Changing the timeframe will solve the problem. Let's look at some of the advantages of this indicat
하나의 창에서 통화 쌍의 여러 시간 프레임을 분석하면 혼란스러울 수 있습니다. 여러 시간 프레임을 분석하려면 신뢰할 수 있는 지표가 필요합니다. 그중 하나는 9TF Double RSI Double MA를 사용하고 있습니다. 나는 단순하지만 신뢰할 수 있고 단 하나의 지표에서 9개의 시간 프레임을 모두 다루는 코드를 만들기 위해 밤낮으로 노력했습니다. 이 표시기의 몇 가지 장점을 살펴보겠습니다. 이중 RSI, 즉 RSI는 더 빠르고 RSI는 더 느립니다. 이중 MA, 즉 MA는 더 빠르고 MA는 더 느립니다. 10 색 구성표. 각 기간의 곡선 색상은 서로 다릅니다. RSI의 OBOS 레벨 라인. 실시간 9TF 대시보드 모니터. 9TF 대시보드 모니터 계산은 한 시간 프레임에서 다른 시간 프레임으로 변경하더라도 매우 정확합니다. 어떤 RSI 곡선이 과매수 수준 위에 있고 과매도 수준 아래에 있는지 모니터링합니다. MA 빠른 라인이 MA 느린 라인 위에 있는지 또는 그
하나의 창에서 통화 쌍의 여러 시간 프레임을 분석하면 혼란스러울 수 있습니다. 여러 시간 프레임을 분석하려면 신뢰할 수 있는 지표가 필요합니다. 그중 하나는 9TF Double CCI Double MA를 사용하고 있습니다. 나는 단순하지만 신뢰할 수 있고 단 하나의 지표에서 9개의 시간 프레임을 모두 다루는 코드를 만들기 위해 밤낮으로 노력했습니다. 이 표시기의 몇 가지 장점을 살펴보겠습니다. 이중 CCI, 즉 CCI는 더 빠르고 CCI는 더 느립니다. 이중 MA, 즉 MA는 더 빠르고 MA는 더 느립니다. 10 색 구성표. 각 기간의 곡선 색상은 서로 다릅니다. CCI의 OBOS 레벨 라인. 실시간 9TF 대시보드 모니터. 9TF 대시보드 모니터 계산은 한 시간 프레임에서 다른 시간 프레임으로 변경하더라도 매우 정확합니다. 어떤 CCI 곡선이 과매수 수준 위에 있고 과매도 수준 아래에 있는지 모니터링합니다. MA 빠른 라인이 MA 느린 라인 위에 있는지 또는 그
정확한 CCI 지표를 사용할 수 있습니다. 대시보드 트렌드 바 스마트 레벨 9TF Double CCI. 이중 CCI, 즉 빠른 CCI 및 느린 CCI 두 번째 CCI가 필요한 이유는 무엇입니까? 추가 지표를 사용하면 라이브 거래에서 더 많은 확신을 얻을 수 있습니다. 9TF 빠른 CCI 곡선 9TF 느린 CCI 곡선 9TF 실시간 CCI 각도 9TF 실시간 CCI 값 9TF 실시간 CCI 방향/위상 9TF 트렌드 바 추세 막대 계산의 새로운 알고리즘 켜기/끄기 버튼. 한 번의 클릭으로 표시기를 표시하거나 숨길 때 매우 유용합니다. 실시간 9TF 대시보드 모니터 추세 막대만 표시하는 기능 CCI 곡선만 표시하는 기능 대시보드만 표시하는 기능 표시할 CCI 곡선을 선택하는 기능 추세의 화살표 유형 선택 기능 obos 선 스타일을 선택하는 기능 범례 표시/숨기기 기능 막대 수를 늘리거나 줄이는 기능 색 구성표 수준을 선택하는 기능 최대 10개의 대시보드 추세 막대 색 구성표를 선택하
정확한 RSI 지표를 사용할 수 있습니다. 대시보드 트렌드 바 스마트 레벨 9TF Double RSI. 이중 RSI, 즉 빠른 RSI 및 느린 RSI 두 번째 RSI가 필요한 이유는 무엇입니까? 추가 지표를 사용하면 라이브 거래에서 더 많은 확신을 얻을 수 있습니다. 9TF 빠른 RSI 곡선 9TF 느린 RSI 곡선 9TF 실시간 RSI 각도 9TF 실시간 RSI 값 9TF 실시간 RSI 방향/위상 9TF 트렌드 바 추세 막대 계산의 새로운 알고리즘 켜기/끄기 버튼. 한 번의 클릭으로 표시기를 표시하거나 숨길 때 매우 유용합니다. 실시간 9TF 대시보드 모니터 추세 막대만 표시하는 기능 RSI 곡선만 표시하는 기능 대시보드만 표시하는 기능 표시할 RSI 곡선을 선택하는 기능 추세의 화살표 유형 선택 기능 obos 선 스타일을 선택하는 기능 범례 표시/숨기기 기능 막대 수를 늘리거나 줄이는 기능 색 구성표 수준을 선택하는 기능 최대 10개의 대시보드 추세 막대 색 구성표를 선택하
정확한 MACD 지표를 사용할 수 있습니다. 대시보드 트렌드 바 스마트 레벨 9TF Double MACD. 이중 MACD, 즉 Fast(MACD 1) 및 Slow(MACD 2) 두 번째 MACD가 필요한 이유는 무엇입니까? 추가 지표를 사용하면 라이브 거래에서 더 많은 확신을 얻을 수 있습니다. 9TF 빠른 MACD 1 곡선 9TF 느린 MACD 2 곡선 9TF 실시간 MACD 각도 9TF 실시간 MACD 값 9TF 실시간 MACD 방향정확한 MACD 지표를 사용할 수 있습니다. 대시보드 트렌드 바 스마트 레벨 9TF Double MACD. 이중 MACD, 즉 Fast(MACD 1) 및 Slow(MACD 2) 두 번째 MACD가 필요한 이유는 무엇입니까? 추가 지표를 사용하면 라이브 거래에서 더 많은 확신을 얻을 수 있습니다. 9TF 빠른 MACD 1 곡선 9TF 느린 MACD 2 곡선 9TF 실시간 MACD 각도 9TF 실시간 MACD 값 9TF 실시간 MACD 방향/위상
정확한 스토캐스틱 지표를 사용할 수 있습니다. 대시보드 트렌드 바 스마트 레벨 9TF 듀얼 스토캐스틱. 이중 스토캐스틱, 즉 빠른 스토캐스틱 및 느린 스토캐스틱 두 번째 스토캐스틱이 필요한 이유는 무엇입니까? 추가 지표를 사용하면 라이브 거래에서 더 많은 확신을 얻을 수 있습니다. 9TF 빠른 확률 곡선 9TF 느린 확률 곡선 9TF 실시간 확률 각도 9TF 실시간 스토캐스틱 값 9TF 실시간 확률적 방향/위상 9TF 트렌드 바 추세 막대 계산의 새로운 알고리즘 켜기/끄기 버튼. 한 번의 클릭으로 표시기를 표시하거나 숨기는 데 매우 유용합니다. 실시간 9TF 대시보드 모니터 추세 막대만 표시하는 기능 확률적 곡선만 표시하는 기능 대시보드만 표시하는 기능 표시할 확률 곡선을 선택하는 기능 추세의 화살표 유형 선택 기능 obos 선 스타일을 선택하는 기능 범례 표시/숨기기 기능 막대 수를 늘리거나 줄이는 기능 색 구성표 수준을 선택하는 기능 최대 10개의 대시보드 추세 막대 색 구
하나의 지표만 사용하여 거래를 자주 잃는다면 이 거래 도구를 사용해 보십시오. 이 거래 도구는 하나 이상의 지표를 사용합니다. 나는 RSI 지표만 사용하는 트레이더를 자주 관찰합니다. 시장이 과매도 상태이지만 여전히 하락세이거나, 시장이 과매수 상태이지만 여전히 상승하는 경우가 많습니다. 이러한 이유로 하나 이상의 지표를 사용해야 합니다. 새 버전 V 3.40 MTF PPAAF 소개: 다중 시간 프레임 정확한 가격 동작 화살표 필터링. 이 거래 도구는 다양한 지표를 사용하여 시장 움직임의 방향을 강화합니다. 이 거래 도구에 사용되는 첫 번째 지표는 듀얼 스토캐스틱(Dual Stochastic)입니다. 여기서는 Fast Stochastic과 Slow Stochastic이라는 두 가지 Stochastic을 사용합니다. Fast Stochastic에는 Fast Stochastic 메인 라인과 Fast Stochastic 신호 라인이 있습니다. 마찬가지로 Slow Stochastic에
[V 1.00] 기동특무부대 NRPA 5 RSI RTD 출시! 다시 칠하지 않는 화살표 실시간 대시보드. 다양한 RSI 지표를 사용하는 데 지쳤지만 정확하지 않은 경우 이 도구를 사용해 보십시오. 일반적으로 사람들은 일정 기간 동안 OBOS 수준을 결정하기 위해 1 RSI만 설치합니다. 나쁜 소식은 다양한 시간대의 OBOS 수준과 추세를 한 번에 볼 수 없다는 것입니다. 이것이 제가 이 거래 도구를 개발한 이유입니다. 설명 방법은 다음과 같습니다. 이 거래 도구에서는 5개의 RSI를 사용합니다. 예, 다섯! 기본적으로 M30이라는 큰 시간 프레임에 RSI 1과 RSI 2를 설정합니다. RSI 1과 RSI 2의 교차점은 M30 시간대에 추세 변화가 있음을 의미합니다. 그런 다음 현재(작은) 시간대에 RSI 3과 RSI 4를 설정합니다. 예를 들어 M5에서 차트를 엽니다. RSI 3과 RSI 4의 교차점은 현재 시간대(M5)에 추세 변화가 있음을 의미합니다. 그런 다음
Introducing the advanced trading tools of 2023. MTF PPAAF Model S. This is sub window version of my best trading tool : MTF Precise Price Action Arrow Filtered.  Click here to learn more about MTF PPAAF . This trading tool is equipped with various powerful features : MTF = Multi Time Frame = Time Frame can be changed. On/off button. Non Repaint Arrows.  Customizable parameter, color etc.  Can show all time frame (ATF) crossover arrows of fast stochastic main line & fast stochastic signal line (
If you are curious about the position of the stochastic, RSI, CCI curve, whether it is at the OBOS level or not, then this trading tool is for you. Introducing the advanced trading tools of 2024. ATF Trend Following Trend Bar OBOS. This indicator is similar to MTF PPAAF Model S but have two layers.  Click here to learn more about MTF PPAAFS . This trading tool is equipped with various powerful features : MTF = Multi Time Frame = Time Frame can be changed. On/off button. Customizable parameter,
15 years old, 15 years old, 15 years old. 2024 years ago: ️ What to do next. I want to know what I want to know. Sorry, I don't know what to do. I want to know, I want to know, I want to know. I want to know what I want to know. I want to know what I want to know. H4(단지 M1에서 M30) I'm here. I'm here. I want to know what I want to know. I want to know what I'm saying. I want to know what I want to know. I want to know what I want to know. I want to know what I want to know.
이 거래 도구를 사용하면 15개 시장을 동시에 스캔할 수 있습니다. 2024년 새로운 거래 지표 소개: ️ 대시보드 다중 통화 다중 시간 프레임 이중 CCI. 제가 이 거래 도구를 만든 이유는 최소한 두 가지입니다. 첫째, 하나의 시장만 관찰하는 것이 지루합니다. 둘째, 다른 시장에 진입하는 순간을 놓치고 싶지 않습니다. 그렇기 때문에 동시에 다른 시장 상황도 알고 싶습니다. 이러한 이유로 여러 시장의 상황을 동시에 스캔할 수 있는 스캐너가 필요합니다. 나는 종종 빠른 CCI 라인 > (또는 <=) 느린 CCI 라인이 M1에서 H4(또는 단지 M1에서 M30)까지 시작하는 시장을 찾습니다. 내 분석에 동의하신다면 이것이 바로 귀하가 찾고 있던 거래 지표입니다. 시장 상황이 위의 요구 사항을 충족하는 순간을 놓치지 마십시오. 이것은 많은 훌륭한 기능을 갖춘 확률론적 스캐너 또는 대시보드입니다. 빠른 CCI 라인의 데이터를 표시할 수 있습니다.
이 거래 도구를 사용하면 15개 시장을 동시에 스캔할 수 있습니다. 2024년 새로운 거래 지표 소개: ️ 대시보드 다중 통화 다중 시간 프레임 이중 RSI. 제가 이 거래 도구를 만든 이유는 최소한 두 가지입니다. 첫째, 하나의 시장만 관찰하는 것이 지루합니다. 둘째, 다른 시장에 진입하는 순간을 놓치고 싶지 않습니다. 그렇기 때문에 동시에 다른 시장 상황도 알고 싶습니다. 이러한 이유로 여러 시장의 상황을 동시에 스캔할 수 있는 스캐너가 필요합니다. 나는 종종 빠른 RSI 라인 > (또는 <=) 느린 RSI 라인이 M1에서 H4(또는 단지 M1에서 M30)까지 시작하는 시장을 찾습니다. 그리고 M1부터 M30까지 과매도/과매수 상태인 시장을 자주 찾아봅니다. 내 분석에 동의하신다면 이것이 바로 귀하가 찾고 있던 거래 지표입니다. 시장 상황이 위의 요구 사항을 충족하는 순간을 놓치지 마십시오. 이것은 많은 훌륭한 기능을 갖춘 확률론적 스캐
필터:
리뷰 없음
리뷰 답변
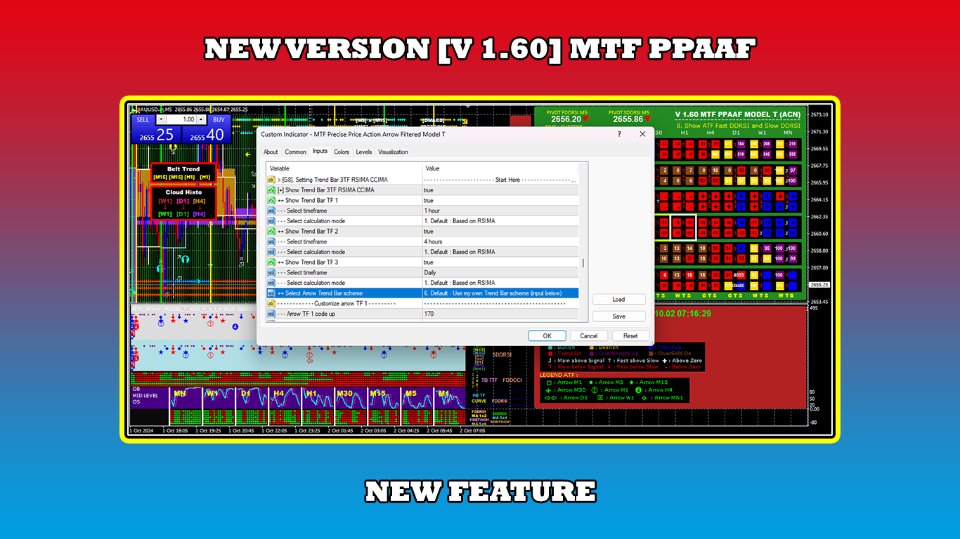
버전 1.60 2024.09.20
In this new Version V 1.60 :
- Adding Dual Pivot ATF display type
- Replay system applicable to dual pivot ATF
- Adding Trend Bar 3TF RSIMA CCIMA arrows scheme
버전 1.50 2024.08.26
In this new Version V 1.50 :
- Adding Dual Double CCI
- Adding DDCCI calculation mode (fast/slow)
- Adding Mode : Show ATF RSIMA & CCIMA
버전 1.40 2024.08.13
In this new Version V 1.40 :
- Deconstruct from the beginning
- Adding CCIMA indicator
- Adding triple MTF cloud histo
- Adding triple MTF confluence multi mode
- Adding trend bar 3TF RSIMA/CCIMA
- Adding dual pivot all time frame
- Adding color level scheme
- Adding mode 24 : Show ATF Fast DMACD and Slow DMACD
- Adding mode 25 : Show ATF RSIMA and CCIMA
- Optimizing the loading time
버전 1.30 2024.06.17
In this new Version V 1.30 :
- Adding wait to buy and wait to sell trading in the zone feature (this is great feature!)
- Adding location of confluence arrows
- Adding cloud histogram calculation mode
버전 1.20 2024.06.12
In this new Version V 1.20 :
- Changing the trend bar 5TF to 7TF
- Adding angle value feature of four MA
버전 1.10 2024.05.28
In this new Version V 1.10 :
- Deconstruct from beginning
- Adding Slow DDRSI
- Adding 23 Mode
- Adding Layer 1 & Layer 2
- Adding Trend Bar 5TF Multi Mode
- Adding Dual MTF Belt Trend
- Adding Dual MTF Cloud Histo
- Adding Confluence MTF Multi Mode
- Fixing TSPI
- Fixing Candle HTF
- Fixing Trading in The Zone