IQ FX Correlation Matrix
- 지표
- INTRAQUOTES
- 버전: 1.3
- 업데이트됨: 1 3월 2025
- 활성화: 5
Limited Period Offer! Grab this powerful indicator for a lifetime at just $45. Price will increase soon.
Download the Metatrader 4 Version here.
Read the product description carefully before purchasing the product.
Due to regulatory restrictions, our service is unavailable in certain countries such as India, Pakistan, and Bangladesh.
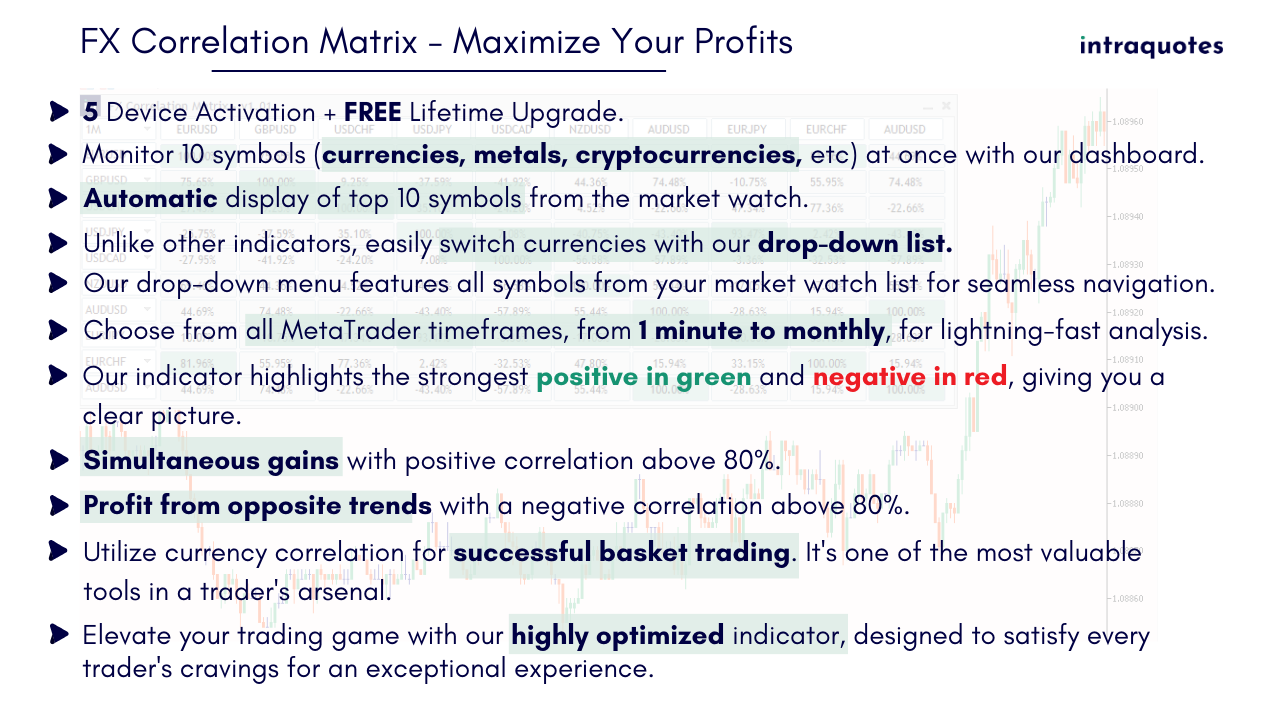
- Multi-Timeframe, Multi-Currency Dashboard – Analyze correlation across multiple forex pairs and timeframes in one dashboard at a glance.
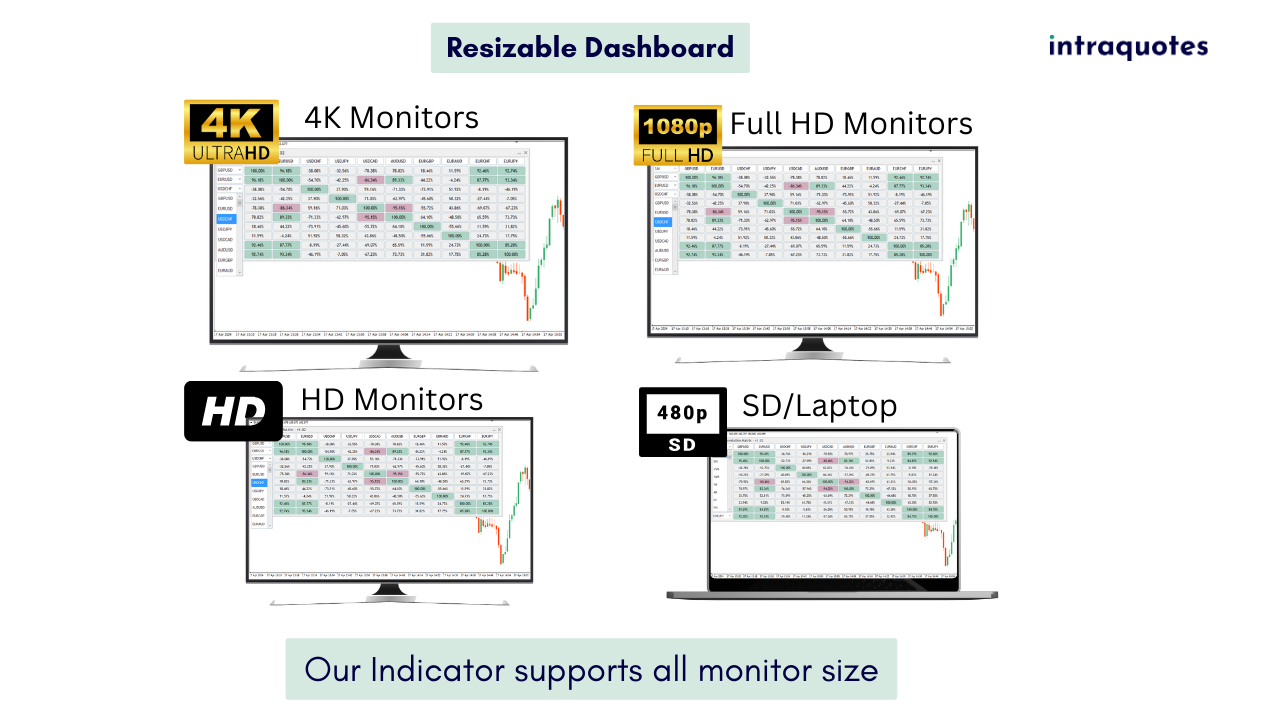
- Adaptable Dashboard Sizes – Supports SD, HD, Full HD, and 4K monitors for an optimized trading experience.
- User-Friendly Interface – Move, minimize, and customize the dashboard for seamless trading.
- 5 PC Activation – Use the indicator across multiple brokers and devices for greater flexibility.
Recommendation: Use this indicator on a separate chart for an optimal performance.
1. Why is the FX Correlation Matrix Indicator Extremely Useful?
- Enhances Trading Accuracy – Identify strong and weak currency correlations to make better trading decisions.
- Maximizes Profitable Trade Opportunities – Detect positively and negatively correlated pairs to capitalize on profits.
This tool is perfect for traders who understand forex correlation and want to enhance trade accuracy, minimize risk, and maximize profits. Whether you're a scalper, intraday trader, or swing trader, the FX Correlation Matrix helps you trade smarter.
3. Learn More at intraquotes MQL5 Channel
If you want to learn more about how our indicator works and how you can take profitable trades, follow our intraquotes official MQL5 channel. We post daily market analysis using our indicators to train our followers how to study the chart with this indicator, where to set targets, and how to take profitable trades. We help you build confidence with daily market analysis using our indicators so that you can trade confidently.
Subscribe to intraquotes MQL5 channel for daily market updates, analysis, and much more.
4. Supported Symbols List
Works with forex major & minor pairs, metals, indices, cryptocurrencies, and more across all timeframes.
5. Applicable Timeframes
Applicable across all 9 timeframes: 1M, 5M, 15M, 30M, 1H, 4H, 1D, 1W, MN.
6. How to Get Started with FX Correlation?
- After purchasing, open MetaTrader Software, log in to your account, and open Toolbox - Market - Purchased.
- Install the indicator.
- Open Navigator - Market - Drag & drop the indicator to the chart.
-
Follow the matrix dashboard to track the correlation for confident trading.
7. How Does FX Correlation Matrix Work? (Easy Explanation)
- Monitors Multi-Currency Correlations – Provides real-time correlation values in percentage format.
- Positive & Negative Correlation Signals – Green highlights strong correlations, while red indicates divergent pairs.
- Customizable Timeframes & Symbols – Choose any timeframe and currency pair for instant correlation analysis.
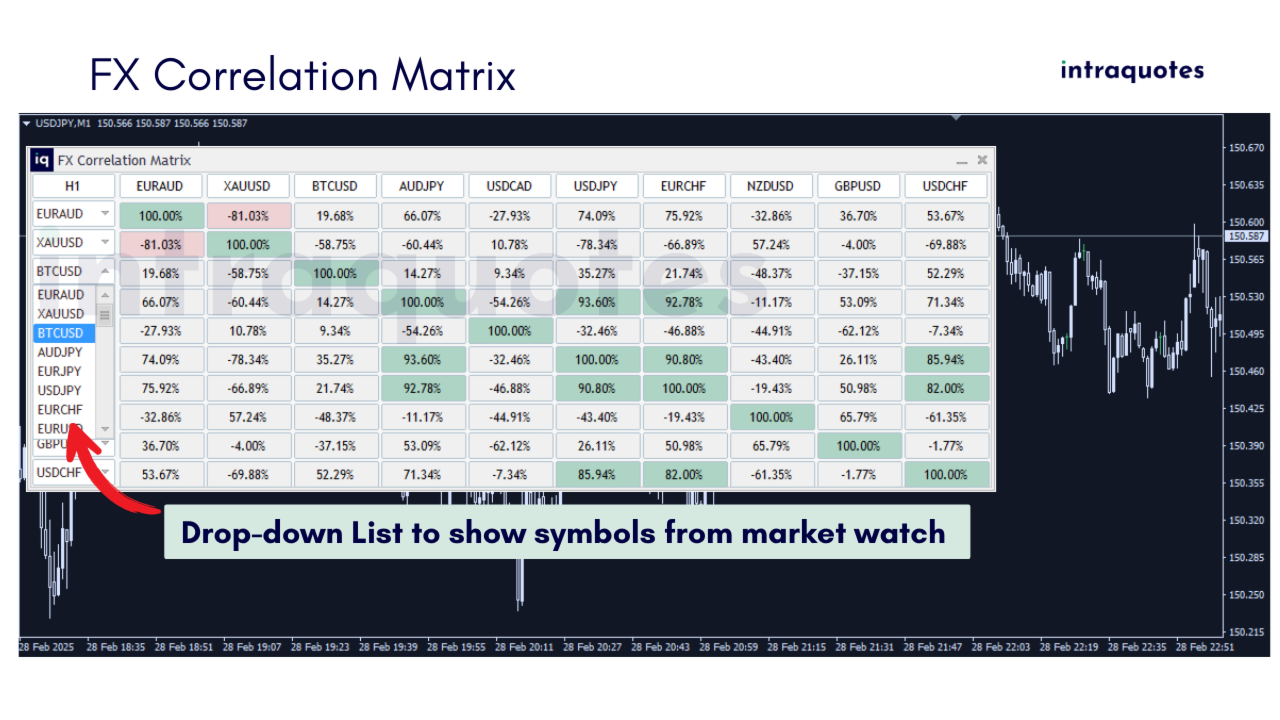
- One-Click Symbol Selection – Switch between pairs easily using the drop-down menu.
- Minimizable & Movable Dashboard – Keep your chart clean while having key correlation data within reach.
- Supports Basket Trading Strategies – Helps traders manage multiple trades across correlated assets.
8. Indicator Features (In Details)
Multi-Timeframe, Multi-Currency Dashboard:
Visualize correlations across multiple forex pairs and timeframes with ease. This powerful dashboard gives you a clear picture of how currency pairs are moving in relation to one another, allowing you to capitalize on cross-pair opportunities and enhance your trading strategy.
5 PC Activation for Multiple Brokers:
Trade across multiple broker platforms with the flexibility of five PC activations. Whether you're working with different brokers or switching between accounts, this feature ensures smooth and uninterrupted access to the indicator.
Eye-Pleasing Aesthetic Design:
The Forex Correlation Dashboard is not only functional but also designed with aesthetics in mind. Its sleek, modern interface is easy on the eyes, allowing you to focus on trading without visual distractions.
User Conveniences:
Enjoy a highly intuitive interface that simplifies your trading experience. The Forex Correlation Dashboard is designed with traders’ convenience in mind, providing easy navigation, quick access to data, and seamless functionality.
Adaptable Dashboard Sizes:
Whether you’re using a standard monitor or a 4K display, the indicator adjusts perfectly with four different dashboard sizes to choose from. This adaptability ensures you can monitor the market in the way that best suits your needs.
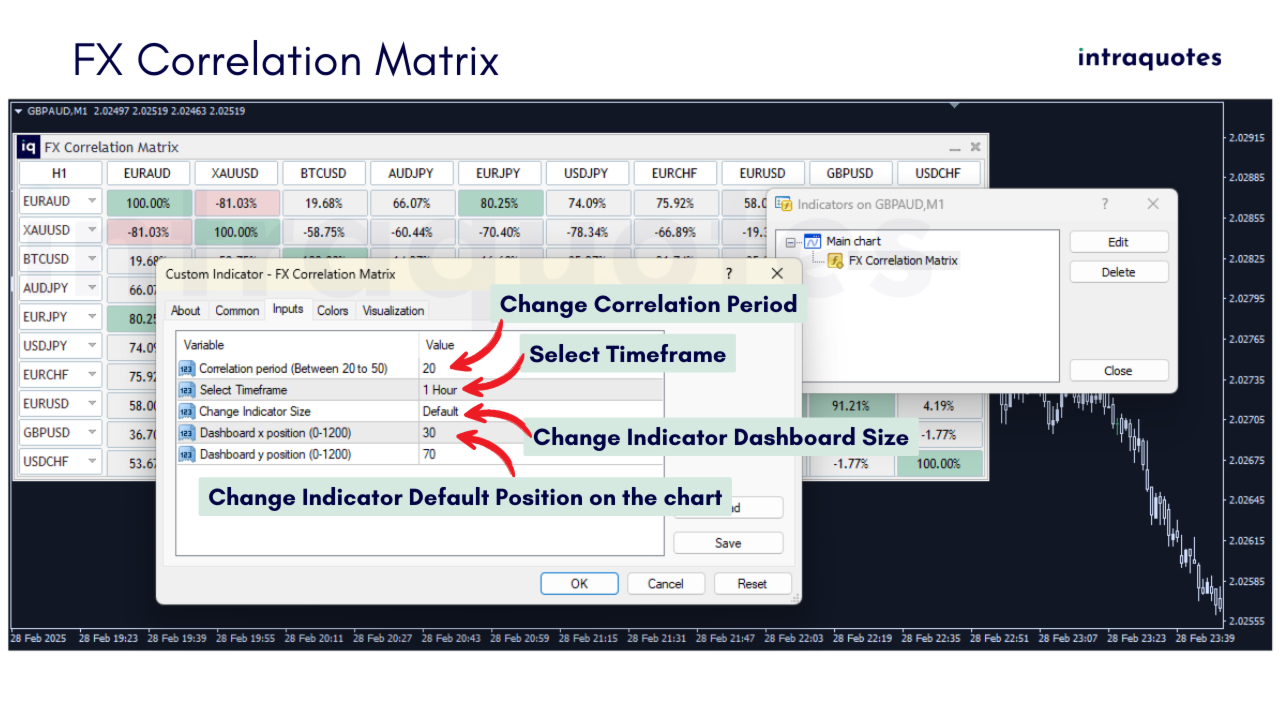
9. Indicator Customization Settings
- Correlation Period Adjustment – The indicator comes pre-set with a default correlation period of 20 but is fully customizable to a minimum of 20 and a maximum of 50. Adjust the period to suit your trading strategy, allowing you to fine-tune your analysis for maximum accuracy.
- Dashboard Resizing – No matter the size of your trading screen, you can customize the indicator’s size to ensure clear visibility and a perfect fit. The four available sizes ensure you can seamlessly switch between different monitor configurations, from standard to 4K.
- Timeframe & Symbol Selection – Easily switch between different pairs and timeframes from the drop-down option in the dashboard.
10. Indicator Strategies: Boost Profits with Correlation Analysis
Identifying Strong Currency Correlations:
Forex pairs are often interrelated, and understanding these correlations can be the key to unlocking profitable trades. By analyzing how pairs move in relation to one another, you can identify strong correlations that help you predict price movements across multiple pairs.
Reducing Risk through Diversification:
Currency correlations allow you to reduce risk by spreading your trades across correlated pairs. With the Forex Correlation Dashboard Indicator, you can easily spot opportunities for positively and negatively correlated pairs and build a more balanced trading portfolio.
Capitalizing on Divergences:
When two positively correlated pairs begin to diverge, it can signal potential trade opportunities as well. This indicator helps you spot such divergences early, giving you a head start in capturing profitable trades when the pairs realign.
11. Indicator Troubleshooting:
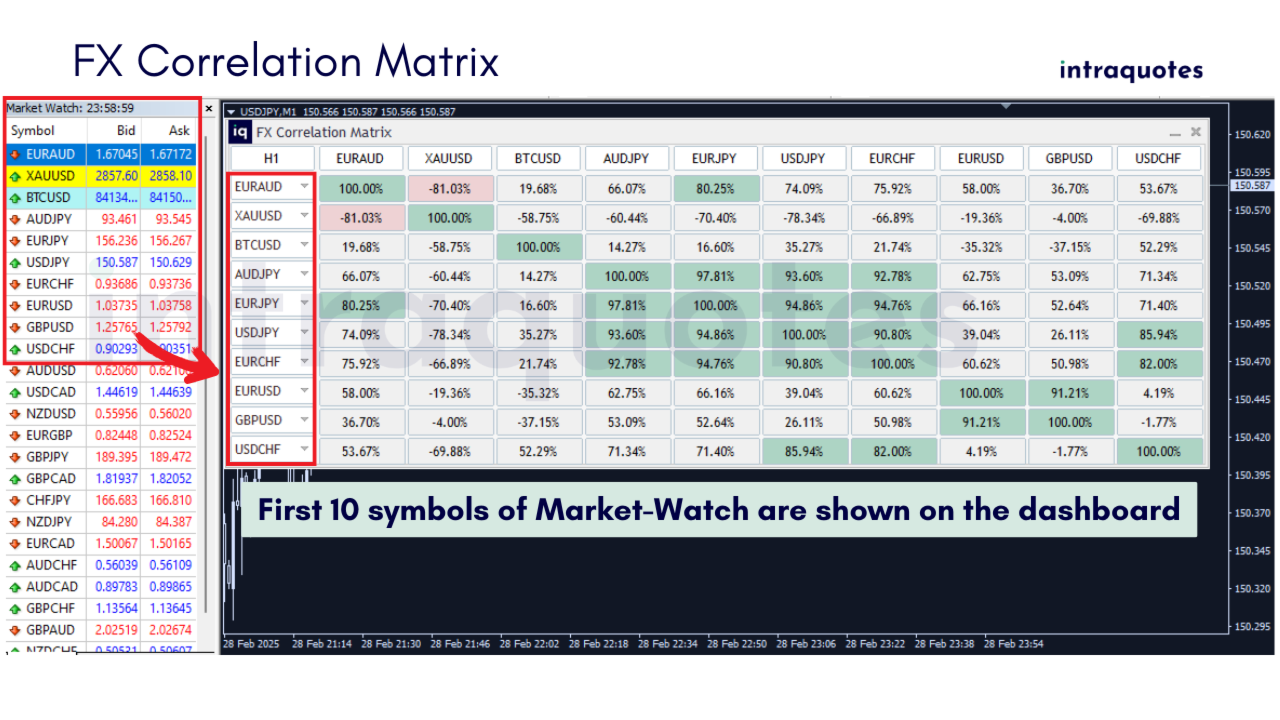
An issue with symbol order: Symbols are displayed in reverse order and not starting from the first ten of the market list.
Solution:
This issue can differ from one broker to another. To address this, prioritize the symbols you frequently use for trading by placing them at the top of the Market Watch section. Conceal any unnecessary symbols to enhance indicator performance.
An issue with loading data correctly on Indicator:
Solution:
- Load all desired symbols in your market watch before applying the indicator.
- Ensure the MetaTrader historical data is loaded for the chosen symbols in the chart.
- If encountering "Data not synchronized" issues, allow 5-10 minutes for your terminal to load, ensuring a seamless experience.
How to Do a Visual Backtest with Our Indicator:
Step 1: Download the entire history center database first. Press the shortcut key F2 to access the History Center.
Step 2: Click on the download button.
Step 3: After the download completes, close, and restart the MetaTrader.
Possible Issues with Backtesting:
Problem 1: You see a message that says "Waiting for update" on the chart while backtesting.
Solution: This means that you don't have enough data or a poor internet connection. To avoid this, make sure you download the full History Center data as explained above.
Problem 2: Metatrader freezes during backtest.
Solution: This also happens because of insufficient data or a bad internet connection. Fix the internet connection before starting and follow the steps again.
12. Support & Updates:
- For assistance, send us a direct message on MQL5.
- Follow our channel for updates and market insights.
- If you encounter any technical issues with the indicator, contact us directly on MQL5.
Take your trading to the next level with the FX Correlation Matrix—a powerful tool designed to help you trade smarter, reduce risk, and capitalize on currency correlations. Whether you're looking for confirmation signals, trend alignment, or diversification, this indicator provides the ultimate market insight. Get it now and maximize your trading potential!
Risk Disclosure: Trading financial markets carries inherent risks and may not be suitable for every investor. This indicator is designed as a tool to assist in trading decisions but does not guarantee profits or prevent losses, which could exceed your initial investment. Past performance is not a reliable indicator of future outcomes. Users are encouraged to fully understand the risks and seek independent financial advice if needed. Any trading decisions made using this indicator are at the user's discretion and responsibility.
Related topics: correlation analysis, multiple timeframe trend analysis, candlestick charts, bar charts, trend dashboard, scalping, day trading, position trading, swing trading, trade following, trend riding, indicator, trend following, trend reversal, MetaTrader software, currency pairs, market analysis, chart window, mobile alert, trading strategy, multiple timeframe, dashboard, 4K monitors, currency correlation dashboard.