OBV macd
- 지표
- Shahabeddin Baset
- 버전: 1.1
- 업데이트됨: 6 2월 2024
OBV MACD
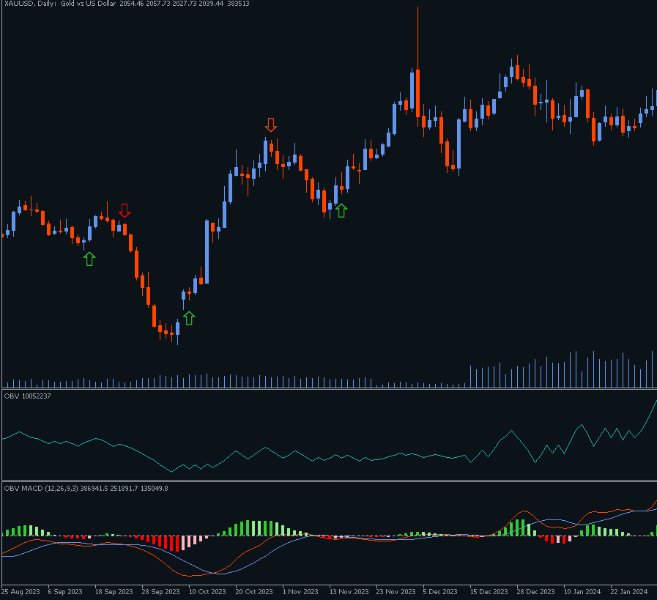
Calculating MACD based on OBV data
Features
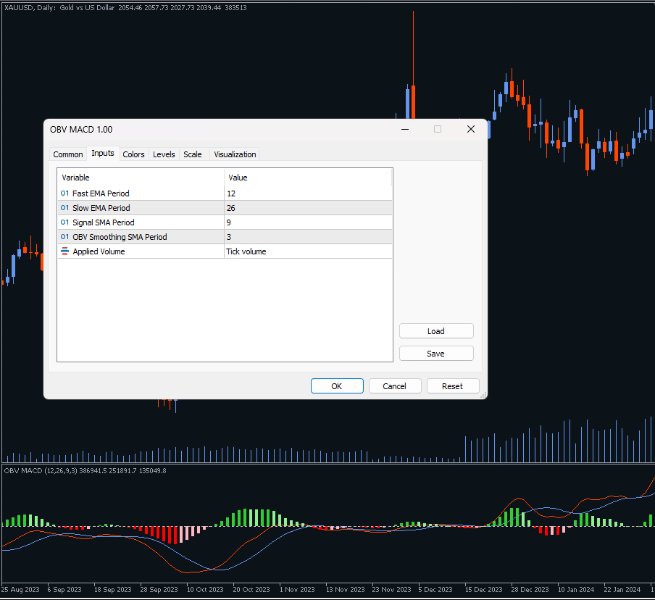
- 3 outputs: MACD & Signal & Histogram
- 4 Colored Histogram
- Smoothing factor
- show/hide option for MACD & Signal lines
Description
Among the few indicators developed for working with volume data, OBV (On Balance Volume) is the simplest yet most informative one. Its logic is straightforward: when the closing price is above the previous close, today's volume is added to the previous OBV; conversely, when the closing price is below the previous close, today's volume is subtracted from the previous OBV.
Thus, OBV moves in the direction of price, while the magnitude of its movement is determined by the volume. This combination of price and volume data makes OBV a valuable tool.
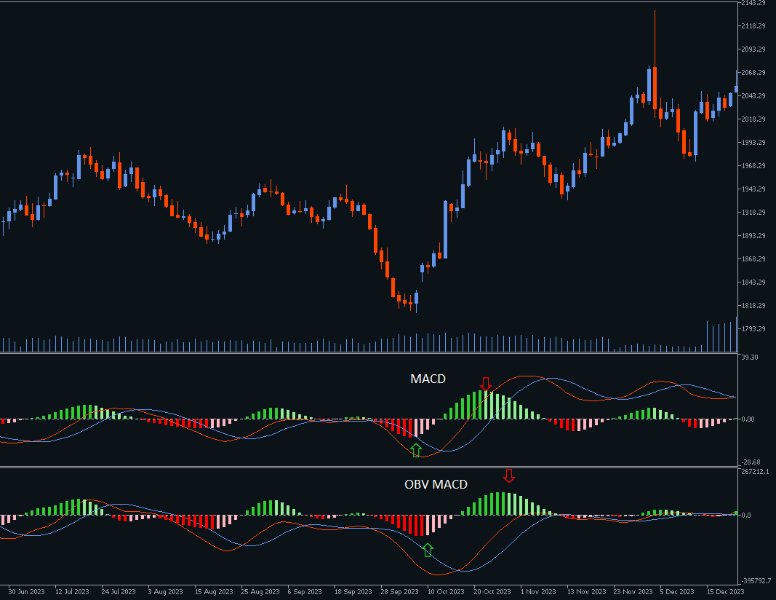
Given that OBV incorporates both price and volume data, it is sensible to use its output instead of price when calculating indicators like MACD.
OBV MACD employs the same calculations as MACD, with the distinction that its input data for calculation is not the price (close, HLC, HLCC, etc.) but the output of the OBV indicator. It inherits the benefits of the MACD indicator while incorporating volume data, providing additional insights that make it more advantageous.
If it was useful for you, please don't forget to leave a comment or write a review. If you see any bugs in the indicator, I will be appreciated if you let me know about it.


This is a superb indicator. Combining MACD & volume is very unique and powerful. Congratulations. It's very accurate and helps a lot.