OnBalance Indicator with MA lines
- 지표
- David Ben Svaiter
- 버전: 2.1
- 활성화: 5
On-Balance Volume (OBV) is a technical indicator that relates volume and price to identify price movements. The basic idea behind OBV is that changes in volume generally precede price changes. The indicator accumulates volumes for periods when the price closes higher and subtracts volumes for periods when the price closes lower. This results in a value used to identify the direction of the asset's trend.
The interpretation of the OBV is simple: a rising OBV suggests that buyers are willing to enter or stay in the market, which can signal an uptrend. On the other hand, a decreasing OBV can indicate that sellers are dominating, suggesting a possible downtrend.
You can now use up to three Moving Averages in your signal, simplifying the trading decision process. Simply observe the OBV crossing the MA lines and the distances between them. That is the goal of OBV-MA!
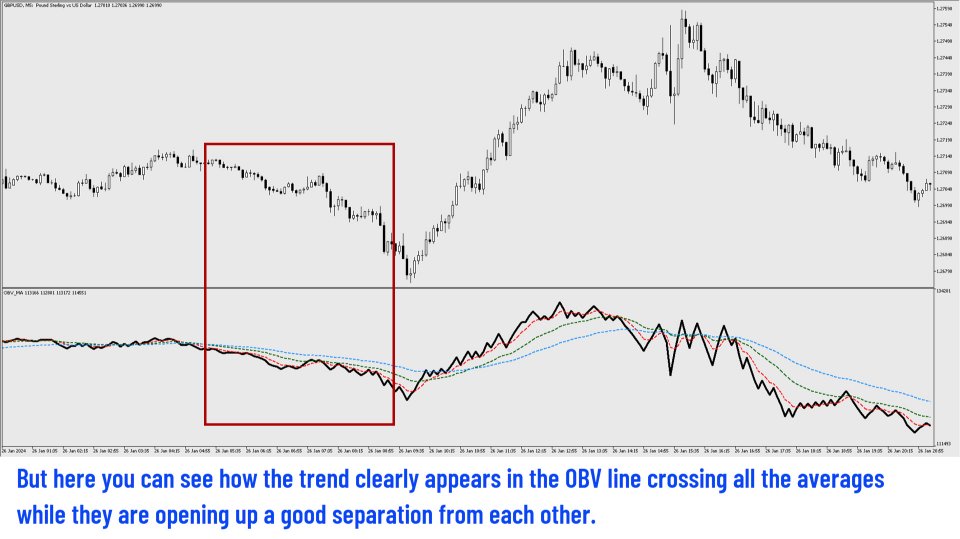
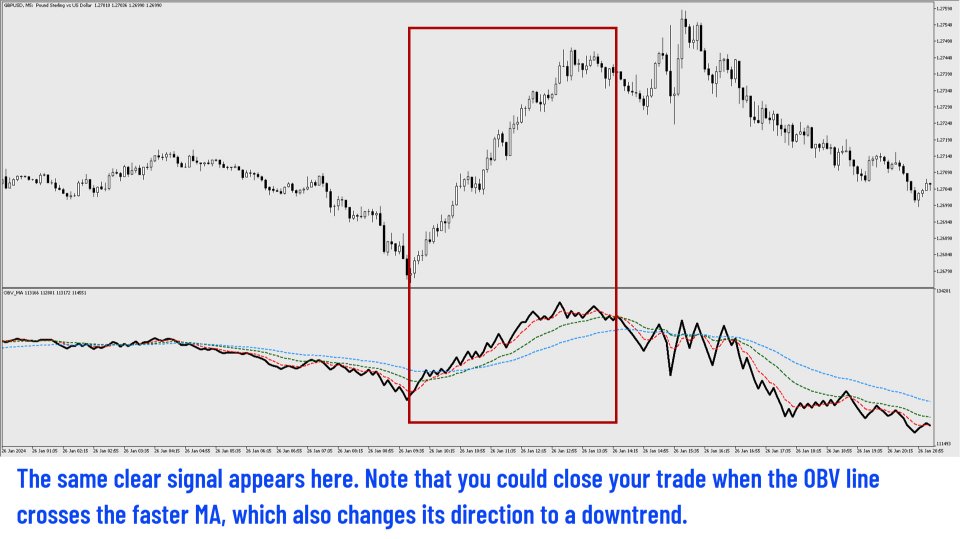
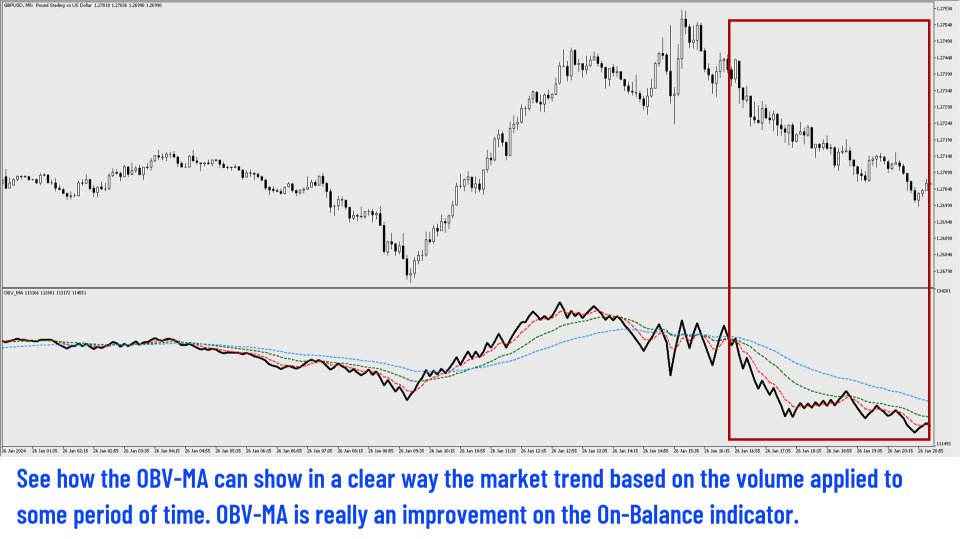
When the OBV line crosses the MA lines and they maintain a significant separation between them, it signals a strong indication of an uptrend or downtrend. Another good trend signal is when we see all the lines (OBV and MA's) in the same direction, with the MA lines keeping a good separation from each other. Even if the OBV crosses the faster average, we still have a valid signal in the direction in question.
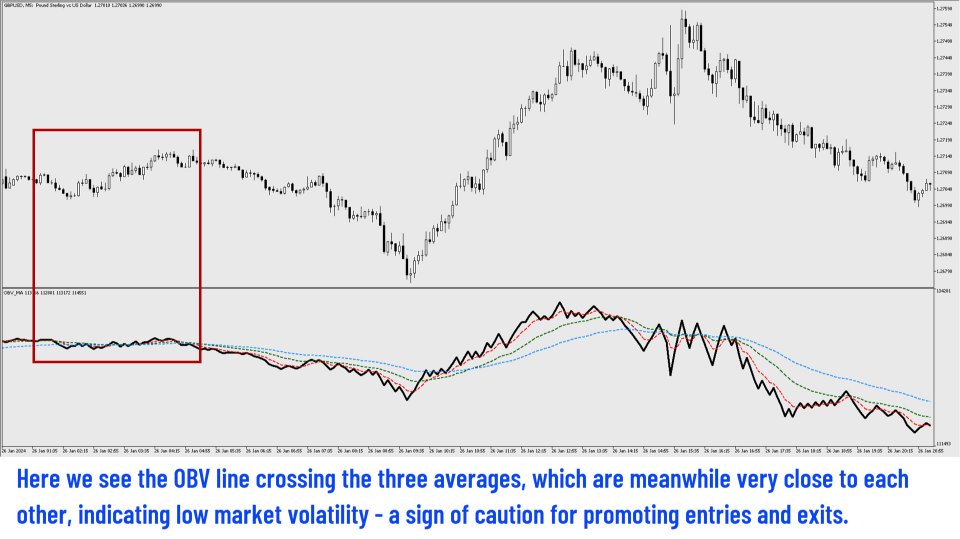
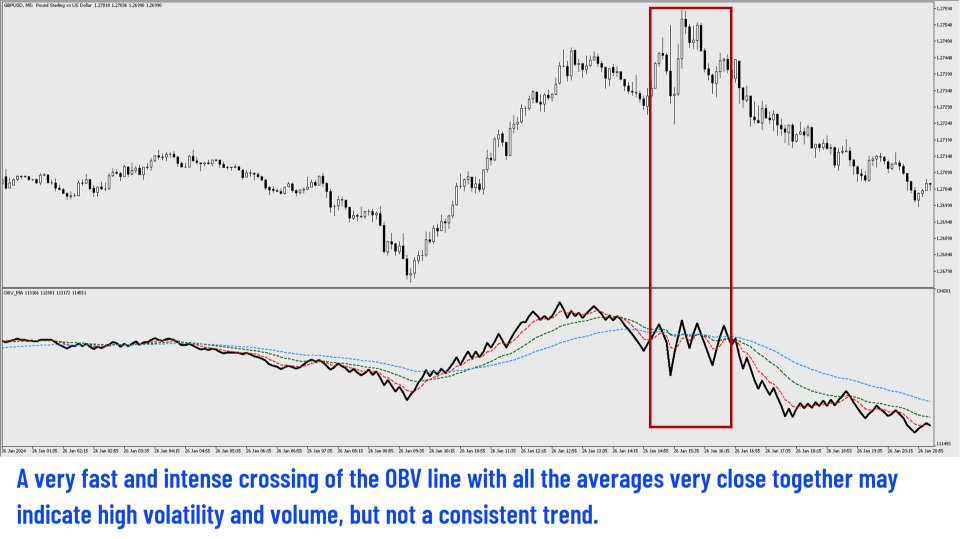
On the other hand, if all the MA lines are closely aligned and the OBV line crosses them as a zigzag, this indicates a neutral signal, suggesting caution and discouraging any immediate entry or exit decisions.
OBV-MA is a good indicator to support your current strategy based on technical signals.

