Noize Absorption Index - is the manual trading system that measures the difference of pressure between bears forces and bulls forces. Green line - is a noize free index that showing curent situation. Zero value of index shows totally choppy/flat market.Values above zero level shows how powerfull bullish wave is and values below zero measures bearish forces.Up arrow appears on bearish market when it's ready to reverse, dn arrow appears on weak bullish market, as a result of reverse expectation.
Premium level is a unique indicator with more than 80% accuracy of correct predictions!
This indicator has been tested for more than two months by the best Trading Specialists!
The author's indicator you will not find anywhere else!
From the screenshots you can see for yourself the accuracy of this tool!
1 is great for trading binary options with an expiration time of 1 candle.
2 works on all currency pairs, stocks, commodities, cryptocurrencies
Instructions:
As soon as the red arrow app
SMC Venom Model BPR 지표는 Smart Money(SMC) 개념 내에서 일하는 트레이더를 위한 전문 도구입니다. 가격 차트에서 두 가지 주요 패턴을 자동으로 식별합니다. FVG (공정 가치 갭)는 3개의 캔들의 조합으로, 첫 번째와 세 번째 캔들 사이에 갭이 있습니다. 이는 볼륨 지원이 없는 레벨 사이에 구역을 형성하여 종종 가격 수정으로 이어집니다. BPR (균형 가격 범위)은 두 개의 FVG 패턴의 조합으로, "브리지"를 형성합니다. 이는 가격이 낮은 볼륨 활동으로 움직일 때 브레이크아웃과 레벨로의 복귀 구역으로, 캔들 사이에 갭을 생성합니다.
이러한 패턴은 거래자가 차트에서 거래량과 가격 역학을 분석하여 주요 지지/저항 수준, 돌파 구역 및 진입 지점을 식별하는 데 도움이 되며, 여기서 대형 시장 참여자와 일반 참여자 간의 상호 작용이 발생합니다. 이 지표는 사각형과 화살표 형태로 패턴을 시각화하며 유연한 경고 설정도 지원합니다.
주요 특징:
패턴 표시 모드
US30 Ninja is a 5 minute scalping indicator that will let know you when there is a trade set up (buy or sell). Once the indicator gives the trade direction, you can open a trade and use a 30 pip stop loss and a 30 pip to 50 pip take profit. Please trade at own own risk. This indicator has been created solely for the US30 market and may not yield positive results on any other pair.
Was: $249 Now: $149 Market Profile defines a number of day types that can help the trader to determine market behaviour. A key feature is the Value Area, representing the range of price action where 70% of trading took place. Understanding the Value Area can give traders valuable insight into market direction and establish the higher odds trade. It is an excellent addition to any system you may be using. Inspired by Jim Dalton’s book “Mind Over Markets”, this indicator is designed to suit the
Introducing the Power Trade Plus indicator designed by a small group of traders with a few years of experience trading the market profitably. The Power Trade Plus is derived from the Power Trade indicator, the indicator strive in powerful sniper entries and take profit levels, with an algorithm that's can determine the markets volatility and Provides entries based on the current market volatility. This indicator is much more effective in stock ,currencies and indices.
ID Trade_Bot BS - an effective tool for automated trading using RSI Trade_Bot BS is an efficient solution for automated trading based on RSI, allowing flexible parameter customization and risk management. Thanks to the ability to choose a trading mode, dynamic Stop-Loss and Take-Profit levels, and trading mode adjustment (buying, selling, or both), it is suitable for various trading strategies. Key Features: Uses the RSI indicator to determine market conditions. Automatically opens an
You can change the time period of the chart at the touch of a button. You can also change multiple charts at the touch of a button. You can also change multiple charts at the touch of a button, saving you the trouble of changing time periods.
We are live-streaming the actual operation of the system. Please check for yourself if it is usable. Please check it out for yourself. https://www.youtube.com/@ganesha_forex
We do not guarantee your investment results. Investments should be made at you
Volality Index scalper indicator Meant for Volality pairs such as Volality 10, 25, 50, 75 and 100 The indicator works on all timeframes from the 1 minute to the monthly timeframe the indicator is non repaint the indicator has 3 entry settings 1 color change on zero cross 2 color change on slope change 3 color change on signal line cross Orange line is your sell signal Blue line is your buy signal.
Mine Farm is one of the most classic and time-tested scalping strategies based on the breakdown of strong price levels.
Mine Farm is the author's modification of the system for determining entry and exit points into the market...
Mine Farm - is the combination of great potential with reliability and safety.
Why Mine Farm?!
- each order has a short dynamic Stop Loss
- the advisor does not use any risky methods (averaging, martingale, grid, locking, etc.)
- the advisor tries to get the most
Welcome to the Ultimate Harmonic Patterns recognition indicator that is focused to detect advanced patterns. The Gartley pattern, Bat pattern, and Cypher pattern are popular technical analysis tools used by traders to identify potential reversal points in the market.
Our Ultimate Harmonic Patterns recognition Indicator is a powerful tool that uses advanced algorithms to scan the markets and identify these patterns in real-time.
With our Ultimate Harmonic Patterns recognition Indicator, you ca
MT4 버전 | FAQ Owl Smart Levels Indicator 는 Bill Williams 의 고급 프랙탈, 시장의 올바른 파동 구조를 구축하는 Valable ZigZag, 정확한 진입 수준을 표시하는 피보나치 수준과 같은 인기 있는 시장 분석 도구를 포함하는 하나의 지표 내에서 완전한 거래 시스템입니다. 시장과 이익을 취하는 장소로. 전략에 대한 자세한 설명 표시기 작업에 대한 지침 고문-거래 올빼미 도우미의 조수 개인 사용자 채팅 ->구입 후 나에게 쓰기,나는 개인 채팅에 당신을 추가하고 거기에 모든 보너스를 다운로드 할 수 있습니다 힘은 단순함에 있습니다!
Owl Smart Levels 거래 시스템은 사용하기 매우 쉽기 때문에 전문가와 이제 막 시장을 연구하고 스스로 거래 전략을 선택하기 시작한 사람들 모두에게 적합합니다. 전략 및 지표에는 눈에 보이지 않는 비밀 공식 및 계산 방법이 없으며 모든 전략 지표는 공개되어 있습니다. Owl Smart Levels를 사
Trading Utility for Forex Currency Pairs Only not for Gold Functions Auto Lot Calculation based on Risk Auto stoploss Auto TakeProfit Breakeven Auto Close Half % Close in percentage with respect to the PIPs Pending Orders BuyLimit Sell Limit with distances BuyStop Sell Stop with distances Trading Informations Risk in percentage For Multiple trades Combine Takeprofit and Combine Stoplosses
To download MT4 version please click here . - This is the exact conversion from TradingView: "Trend Direction Force Index - TDFI [wm]" By "causecelebre". - The screenshot shows similar results from tradingview and Metatrader when tested on ICMarkets on both platforms. - This indicator uses multiple levels of averaging to detect trend strength. - You can optimize filter low and filter high levels to achieve best results. - You have access to buffers to use in EAs. - This is a light-load processin
Sniper2 , It has points of lines, with colors that are showing you an entrance, that work as support and resistance! green dotted lines green shows entry for sale, the red dotted lines show a buy entry, pay attention to the supports that work as a break to catch long candles in a longer period of time. works for forex all pairs works for synthetic indices all pairs ! indicator on sale!
Weighted average price indicator or VWAP. The well-known standard VWAP with the beginning of the day is added with the function of selecting the periodization. It can be calculated both every day and on other periods. Also the indicator allows to exclude the volume from the calculation, which will allow using it on the cryptocurrencies and forex. There is an alert for a VWAP price crossing. There are 1 and 2 standard deviation. Settings: Volume: turning volume on and off in the calculation mecha
No Demand No Supply This indicator identifies No Demand –No Supply candles to your chart and plots volume bars colored according to the signal. It can be applied to all timeframes or to a specific one only. It can also be used as regular volume indicator with exceptional future of WEIGHTED VOLUME. Furthermore is has an alert notification, sound and email when a signals occurs. The indicator does not repaint but the alert will come on two candles back due to the definition of No Demand No Su
This Indicator enhances the default Relative Strength Index (RSI) by introducing several improvements. First, it visually highlights overbought and oversold regions by changing the RSI color from white to red. Second, it includes additional reference lines at 20, 40, 50, 60, and 80, providing a clearer framework for assessing RSI values. The most notable feature is the use of the middle 50-line to indicate the current market cycle. The color of the 50-line dynamically reflects the cycle: green f
The Penta-O is a 6-point retracement harmonacci pattern which usually precedes big market movements. Penta-O patterns can expand and repaint quite a bit. To make things easier this indicator implements a twist: it waits for a donchian breakout in the right direction before signaling the trade. The end result is an otherwise repainting indicator with a very reliable trading signal. The donchian breakout period is entered as an input. [ Installation Guide | Update Guide | Troubleshooting | FAQ | A
This PORTFOLIO of 3 strategies has been developed, tested and traded live on DAX H1 timeframe.
Multiple EAs traded together will lead to a BIGGER PROFITS and SMOOTHER EQUITY CURVE. 3 not correlated EAs logics for DAX H1 timeframe merged to a single strategy. Very SIMPLE STRATEGIES with only FEW PARAMETERS. Every trade has his own logic for STOP LOSS. To catch the profits every strategy uses different approach - some has TAKE PROFIT, some uses TIME BASED EXITS or PROFIT TRAILING. EA has been b
This PORTFOLIO of 3 strategies has been developed, tested and traded live on DAX M30 timeframe.
Multiple EAs traded together will lead to a BIGGER PROFITS and SMOOTHER EQUITY CURVE. 3 not correlated EAs logics for DAX M30 timeframe merged to a single strategy. Very SIMPLE STRATEGIES with only FEW PARAMETERS. Every trade has his own logic for STOP LOSS. To catch the profits every strategy uses different approach - some has TAKE PROFIT, some uses TIME BASED EXITS or PROFIT TRAILING. EA has been
Fibo Daily Channel Indicator The Indicator is a powerful tool for traders, providing precise daily support and resistance levels based on Fibonacci retracement and extension calculations. This indicator automatically draws key pivot points (PP, R1, R2, S1, S2) as well as additional extension levels (R3, R4, S3, S4), helping traders identify potential reversal and breakout zones with ease. It includes customizable alerts and push notifications, allowing traders to receive updates whenever the pr
This tool monitors MACD indicators on all time frames in the selected markets. Displays a table with signals to open a BUY trade (green) or SELL trade (red). You can set the conditions for the signal. You can easily add or delete market names / symbols. If the conditions for opening a trade on multiple time frames are met, you can be notified by e-mail or phone message (according to the settings in MT5 menu Tools - Options…) You can also set the conditions for sending notifications. The list of
The Gann Box (or Gann Square) is a market analysis method based on the "Mathematical formula for market predictions" article by W.D. Gann. This indicator can plot three models of Squares: 90, 52(104), 144. There are six variants of grids and two variants of arcs. You can plot multiple squares on one chart simultaneously.
Parameters Square — selection of a square model: 90 — square of 90 (or square of nine); 52 (104) — square of 52 (or 104); 144 — universal square of 144; 144 (full) — "full" v
Awesome Oscillator by Bill Williams with the ability to fine-tune and replace the averaging algorithms of the indicator, which significantly expands the possibilities of using this oscillator in algorithmic trading and brings it closer in its properties to such an indicator as the MACD. To reduce price noise, the final indicator is processed with an additional Smooth averaging. The indicator has the ability to give alerts, send mail messages and push signals when the direction of movement of th
The Riko Trend indicator is a revolutionary trend trading and filtering solution with all the important features of a trend tool built into one tool! The Riko Trend indicator is good for any trader, suitable for any trader for both forex and binary options. You don’t need to configure anything, everything is perfected by time and experience, it works great during a flat and in a trend.
The Riko Trend indicator is a technical analysis tool for financial markets that reflects the current price f
우리의 Basic Support and Resistance 표시기는 기술 분석을 향상시키는 데 필요한 솔루션입니다.이 표시기는 차트/ MT4 버전
특징
피보나치 수준의 통합 : 지원 및 저항 수준과 함께 피보나치 수준을 표시하는 옵션과 함께, 우리의 지표는 시장 행동과 가능한 역전 영역에 대한 더 깊은 통찰력을 제공합니다.
성능 최적화 : 각 막대의 개구부에서만 확장 라인을 업데이트하는 옵션을 사용하여, 우리의 지표는 지원 및 저항 수준의 정확도를 희생하지 않고 최적의 성능을 보장합니다.
입력 주요 설정 Timeframe: 이 입력을 통해 차트에 더 높은 기간의 지지선과 저항선을 표시하도록 선택할 수 있습니다. Support/Resistance Strength [Number of Bars]: 이 입력을 사용하면 지지대와 저항의 강도를 결정할 수 있습니다.숫자가 높을수록지지/저항이 더 강해집니다. Price mode: 이 매개 변수를 사용하면 지원 및 저항 수준을
The trend is your friend!
Look at the color of the indicator and trade on that direction. It does not repaint. After each candle is closed, that's the color of the trend. You can focus on shorter faster trends or major trends, just test what's most suitable for the symbol and timeframe you trade. Simply change the "Length" parameter and the indicator will automatically adapt. You can also change the color, thickness and style of the lines. Download and give it a try! There are big movements w
KT Renko Patterns는 렌코 차트를 벽돌 하나하나 분석하여, 전 세계 다양한 금융 시장에서 트레이더들이 자주 사용하는 유명한 차트 패턴들을 찾아냅니다. 시간 기반 차트와 비교하면, 렌코 차트는 시각적으로 단순하고 깔끔하여 패턴 중심의 트레이딩이 훨씬 쉽게 가능합니다.
KT Renko Patterns에는 다양한 렌코 패턴이 포함되어 있으며, 이 중 상당수는 Prashant Shah의 저서 『Profitable Trading with Renko Charts』에서 자세히 설명되어 있습니다. KT Renko Patterns 인디케이터를 기반으로 한 100% 자동화된 EA는 여기에서 이용할 수 있습니다 - KT Renko Patterns EA .
기능 소개
최대 8개의 명확한 렌코 패턴을 거래할 수 있어, 혼동 없이 신뢰도 높은 트레이딩이 가능합니다. 객관성을 제공하기 위해 각 패턴에는 손절선과 피보나치 목표가 함께 제공됩니다. KT Renko Patterns는 각 패턴의 정
Описание индикатора MONEY
Индикатор MONEY предназначен для анализа волатильности и выявления значительных рыночных движений (всплесков). Он использует ATR (Average True Range) для определения момента, когда цена выходит за пределы обычного диапазона, и сигнализирует об этом трейдеру с помощью стрелок на графике.
Основные параметры: • Минимальное количество свечей – задает период для анализа всплесков. • Алерты (уведомления) – включение или отключение звуковых и текстовых сигналов. • Период AT
Golden Trend indicator is The best indicator for predicting trend movement this indicator never lags and never repaints and never back paints and give arrow buy and sell before the candle appear and it will help you and will make your trading decisions clearer its work on all currencies and gold and crypto and all time frame This unique indicator uses very secret algorithms to catch the trends, so you can trade using this indicator and see the trend clear on charts manual guide and
VERSION MT4 — ИНСТРУКЦИЯ RUS — INSTRUCTIONS ENG 주요 기능: 렌더링 없이 정확한 입력 신호! 신호가 나타나면 관련성은 유지됩니다! 이는 신호를 제공한 후 변경하여 예금 자금 손실을 초래할 수 있는 다시 그리기 지표와의 중요한 차이점입니다. 이제 더 큰 확률과 정확도로 시장에 진입할 수 있습니다. 화살표가 나타난 후 목표에 도달(이익실현)하거나 반전 신호가 나타날 때까지 캔들을 색칠하는 기능도 있습니다. STOP LOSS / TAKE PROFIT 구역 표시 진입점 검색 시 시각적 명확성을 높이기 위해 시장 진입을 위한 최적 지점이 검색되는 BUY/SELL 영역을 초기에 표시하는 모듈을 만들었습니다. 정지 손실 수준 작업을 위한 추가 지능형 논리는 시간이 지남에 따라 크기를 줄이는 데 도움이 되므로 거래에 들어갈 때 초기 위험을 줄이는 데 도움이 됩니다(move sl). 더 높은 기간의 MIN
지침 러시아 - 영어 표시기와 함께 사용하는 것이 좋습니다 . - TPSpro 트렌드 프로 - MT4 버전 거래에서 핵심 요소는 거래 상품을 매수 또는 매도하기로 결정하는 구역 또는 수준입니다. 주요 업체가 시장에서 자신의 존재를 숨기려는 시도에도 불구하고, 그들은 필연적으로 흔적을 남깁니다. 우리의 과제는 이러한 흔적을 식별하고 올바르게 해석하는 방법을 배우는 것이었습니다.
주요 기능:: 판매자와 구매자를 위한 활성 영역을 표시합니다! 이 지표는 매수 및 매도를 위한 모든 올바른 초기 임펄스 레벨/존을 보여줍니다. 진입점 검색이 시작되는 이러한 레벨/존이 활성화되면 레벨의 색상이 바뀌고 특정 음영으로 채워집니다. 또한 상황을 보다 직관적으로 이해하기 위해 화살표가 나타납니다. 더 높은 시간대의 레벨/존 표시(MTF 모드) 더 높은 시간 간격을 사용하여 레벨/존을 표시하는 기능을 추가했습니다.
SuperTrend , RSI , Stochastic 의 힘을 하나의 포괄적인 지표로 결합하여 트레이딩 잠재력을 극대화하는 궁극의 트레이딩 도구 인 Quantum TrendPulse를 소개합니다. 정밀성과 효율성을 추구하는 트레이더를 위해 설계된 이 지표는 시장 추세, 모멘텀 변화, 최적의 진입 및 종료 지점을 자신 있게 식별하는 데 도움이 됩니다. 주요 특징: SuperTrend 통합: 주요 시장 추세를 쉽게 따라가고 수익성의 물결을 타세요. RSI 정밀도: 매수 과다 및 매도 과다 수준을 감지하여 시장 반전 시점을 파악하는 데 적합하며 SuperTrend 필터로 사용 가능 확률적 정확도: 변동성이 큰 시장에서 숨겨진 기회를 찾기 위해 확률적 진동 을 활용하고 SuperTrend의 필터로 사용 다중 시간대 분석: M5부터 H1 또는 H4까지 다양한 시간대에 걸쳐 시장을 최신 상태로 유지하세요. 맞춤형 알림: 맞춤형 거래 조건이 충족되면
CBT Quantum Maverick
고효율 바이너리 옵션 거래 시스템 CBT Quantum Maverick는 정밀하고 간단하며 체계적인 거래를 원하는 트레이더를 위해 설계된 고성능 바이너리 옵션 거래 시스템입니다. 사용자 지정이 필요 없으며, 처음부터 최적화된 결과를 제공합니다. 약간의 연습만으로 신호를 쉽게 마스터할 수 있습니다. 주요 특징: 정확한 신호 제공:
현재 봉 데이터를 기반으로 다음 캔들에 대한 신호를 생성하며, 빈번한 재도색이 없습니다. 다양한 시장에 대한 적응성:
바이너리 옵션 거래에 특화되었으며, 여러 브로커 및 자산 클래스와 호환됩니다. 호환 가능: Deriv Synthetic Charts: 모든 시간 프레임에서 사용 가능. OTC 차트: Quotex, PocketOption, Binomo, Stockity, IQOption, Exnova, OlympTrade, Deriv, Binolla, Homebroker 등의 브로커와 호환(MT5로의 무료 데이터 임
다시 색을 칠하지 않고 거래에 진입할 수 있는 정확한 신호를 제공하는 MT5용 지표입니다. 외환, 암호화폐, 금속, 주식, 지수 등 모든 금융 자산에 적용할 수 있습니다. 매우 정확한 추정값을 제공하고 매수와 매도의 가장 좋은 시점을 알려줍니다. 하나의 시그널로 수익을 내는 지표의 예와 함께 비디오 (6:22)시청하십시오! 대부분의 거래자는 Entry Points Pro 지표의 도움으로 첫 거래 주 동안 트레이딩 결과를 개선합니다. 저희의 Telegram Group 을 구독하세요! Entry Points Pro 지표의 좋은점. 재도색이 없는 진입 신호
신호가 나타나고 확인되면(시그널 캔들이 완성된 경우) 신호는 더 이상 사라지지 않습니다. 여타 보조지표의 경우 신호를 표시한 다음 제거되기 때문에 큰 재정적 손실로 이어집니다.
오류 없는 거래 게시
알고리즘을 통해 트레이드(진입 또는 청산)를 할 이상적인 순간을 찾을 수 있으며, 이를 통해 이를 사용하는 모든 거래자의 성공률이
Timeframes Trend Scanner is a trend analyzer or trend screener indicator that helps you know the trend in all timeframes of selected symbol you are watching .
This indicator provides clear & detailed analysis results on a beautiful dashboard, let you able to use this result right away without need to do any additional analysis. How it works
Step 1: Calculate values of 23 selected & trusted technical indicators (Oscillator & Moving Average indicators)
Step 2: Analyze all indicators using bes
Visual Heatmap Book Analyser
This indicator monitors the market liquidity and generates colors based on order patterns, quantities, and renewal activities in the book. This allows you to visualize the order flow and identify areas of high and low liquidity and activity. The indicator uses machine learning techniques to analyze the order behavior in the book, enabling it to detect patterns and trends in orders, allowing you to make informed decisions about your trading operations. The color pale
KT Candlestick Patterns는 실시간으로 24가지 가장 신뢰할 수 있는 일본 캔들 패턴을 찾아 차트에 표시합니다. 일본 트레이더들은 18세기부터 이러한 패턴을 사용해 가격 방향을 예측해왔습니다. 모든 캔들 패턴이 동일한 신뢰도를 가지는 것은 아니지만, 지지/저항 같은 다른 기술적 분석과 결합하면 시장 상황을 명확하게 보여줍니다.
이 지표는 Steve Nison의 책 "Japanese Candlestick Charting Techniques"에 소개된 많은 패턴을 포함하고 있습니다. 책에서 다루지 않는 복잡한 패턴들도 감지할 수 있어 더욱 강력한 기능을 제공합니다.
기능
각 신호에서 고정된 핍 수익을 목표로 설정하면, 지표가 해당 목표에 대한 성공률을 실시간으로 계산합니다. 일본의 유명한 24가지 캔들 패턴을 높은 정확도로 식별합니다. 각 패턴의 성능을 분석하고 정확도를 실시간으로 보여주는 모듈이 내장되어 있습니다. 패턴 간 최소 바 수를 설정할 수 있어 차트를 깔
[ MT4 Version ] Are you tired of spending months on demo or live accounts to test your trading strategies? The Backtesting Simulator is the ultimate tool designed to elevate your backtesting experience to new heights. Utilizing Metatrader historical symbol information, it offers an unparalleled simulation of real market conditions. Take control of your testing speed, test ideas quickly or at a slower pace, and witness remarkable improvements in your testing performance. Forget about wasting tim
Pro Thunder V10: 궁극의 바이너리 옵션 거래 인디케이터! Pro Thunder V10 으로 거래를 한 단계 더 업그레이드하세요! 최첨단 인공지능(AI) 뉴럴 네트워크 기술 로 구동되는 이 혁신적인 인디케이터는 타의 추종을 불허하는 정확성과 신뢰성을 제공합니다. 실시간 비재도색(non-repainting) 신호부터 변동성 높은 시장에서도 원활한 성능까지, Pro Thunder V10 은 거래 성공을 위한 최고의 파트너입니다. 주요 특징: 압도적인 정확성: 주요 뉴스 이벤트를 포함한 모든 시장 상황에서 테스트 및 검증된 고정밀 신호로 시장을 장악하세요. OTC 호환성: OlympTrade, Pocket Option, Quotex, Binomo, IQ Option 등 주요 플랫폼에서 완벽히 작동합니다. MT5 전용: 가장 진보된 거래 플랫폼인 MetaTrader 5 를 위해 특별히 설계되었습니다. 성과 대시보드: 직관적인 화면에서 거래 결과, 신호, 승
Royal Scalping Indicator is an advanced price adaptive indicator designed to generate high-quality trading signals. Built-in multi-timeframe and multi-currency capabilities make it even more powerful to have configurations based on different symbols and timeframes. This indicator is perfect for scalp trades as well as swing trades. Royal Scalping is not just an indicator, but a trading strategy itself. Features Price Adaptive Trend Detector Algorithm Multi-Timeframe and Multi-Currency Trend Low
MetaForecast는 가격 데이터의 조화를 기반으로 모든 시장의 미래를 예측하고 시각화합니다. 시장이 항상 예측 가능한 것은 아니지만 가격에 패턴이 있다면 MetaForecast는 가능한 정확하게 미래를 예측할 수 있습니다. 다른 유사한 제품과 비교했을 때, MetaForecast는 시장 동향을 분석하여 더 정확한 결과를 생성할 수 있습니다.
입력 매개변수 Past size (과거 크기) MetaForecast가 미래 예측을 생성하기 위한 모델을 만드는 데 사용하는 막대의 수를 지정합니다. 모델은 선택한 막대 위에 그려진 노란색 선으로 표시됩니다. Future size (미래 크기) 예측해야 할 미래 막대의 수를 지정합니다. 예측된 미래는 핑크색 선으로 표시되며 그 위에 파란색 회귀선이 그려집니다. Degree (차수) 이 입력은 MetaForecast가 시장에서 수행할 분석 수준을 결정합니다. Degree 설명 0 차수 0의 경우, "Past size" 입력에 모든 봉우리와
Capture every opportunity: your go-to indicator for profitable trend trading Trend Trading is an indicator designed to profit as much as possible from trends taking place in the market, by timing pullbacks and breakouts. It finds trading opportunities by analyzing what the price is doing during established trends. [ Installation Guide | Update Guide | Troubleshooting | FAQ | All Products ]
Trade financial markets with confidence and efficiency Profit from established trends without getting whip
KT Trend Trading Suite is a multi-featured indicator that incorporates a trend following strategy combined with multiple breakout points as the entry signals.
Once a new trend is established, it provides several entry opportunities to ride the established trend successfully. A pullback threshold is used to avoid the less significant entry points.
MT4 Version is available here https://www.mql5.com/en/market/product/46268
Features
It combines several market dynamics into a single equation to
이제 $ 147 (몇 가지 업데이트 후 $ 499 증가) - 무제한 계정 (PCS 또는 MACS)
RelicusRoad 사용 설명서 + 교육 비디오 + 비공개 Discord 그룹 액세스 + VIP 상태
시장을 보는 새로운 방법
RelicusRoad는 외환, 선물, 암호화폐, 주식 및 지수에 대한 세계에서 가장 강력한 거래 지표로서 거래자에게 수익성을 유지하는 데 필요한 모든 정보와 도구를 제공합니다. 우리는 초보자부터 고급까지 모든 거래자가 성공할 수 있도록 기술적 분석 및 거래 계획을 제공합니다. 미래 시장을 예측할 수 있는 충분한 정보를 제공하는 핵심 거래 지표입니다. 우리는 차트에서 말이 안 되는 여러 지표 대신 완전한 솔루션을 믿습니다. 타의 추종을 불허하는 매우 정확한 신호, 화살표 + 가격 조치 정보를 표시하는 올인원 표시기입니다.
강력한 AI를 기반으로 하는 RelicusRoad는 누락된 정보와 도구를 제공하여 교육하고 성공적인 트레이더인 트레이딩 전문가가 되도
This indicator is based on the mathematics of the great trader W.D. Ganna. With its help, you can easily find strong levels by analyzing swings to find the optimal entry point. The indicator works on all instruments and all timeframes. The indicator is fully manual and has control buttons. All you need to do is press the NEW button, a segment will appear, which you can place on any movement, swing or even 1 candle that you want to analyze. By placing the segment, press the OK button. A grid (th
CONTACT US after purchase to get the Indicator Manual. Try Now—Limited Discount for the next 10 Buyers!
Download the Metatrader 4 Version Read the product description carefully before purchasing the product. Due to regulatory restrictions, our service is unavailable in certain countries such as India, Pakistan, and Bangladesh. Disclaimer: • Our products are available only on mql5.com. • We never contact anyone or sell our products privately. • We do not provide any personal trading advice.
This indicator identifies and displays zones, as it were areas of strength, where the price will unfold. The indicator can work on any chart, any instrument, at any timeframe. The indicator has two modes. The indicator is equipped with a control panel with buttons for convenience and split into two modes. Manual mode: To work with manual mode, you need to press the NEW button, a segment will appear. This segment is stretched over the movement and the LVL button is pressed. The level is displayed
Bill Williams Advanced is designed for automatic chart analysis using Bill Williams' "Profitunity" system. The indicator analyzes four timeframes at once.
Manual (Be sure to read before purchasing)
Advantages
1. Automatically analyzes the chart using the "Profitunity" system of Bill Williams. The found signals are placed in a table in the corner of the screen.
2. Equipped with a trend filter based on the Alligator indicator. Most of the system signals are recommended to be used only according t
Protect against whipsaws: revolutionize your swing trading approach Swing Trading is the first indicator designed to detect swings in the direction of the trend and possible reversal swings. It uses the baseline swing trading approach, widely described in trading literature. The indicator studies several price and time vectors to track the aggregate trend direction and detects situations in which the market is oversold or overbought and ready to correct. [ Installation Guide | Update Guide | Tro
Berma Bands(BBs) 지표는 시장 동향을 파악하고 이를 활용하려는 트레이더에게 귀중한 도구입니다. 가격과 BBs 간의 관계를 분석함으로써 트레이더는 시장이 추세 단계인지 범위 단계인지를 분별할 수 있습니다. 자세한 내용을 알아보려면 [ Berma Home Blog ]를 방문하세요. 버마 밴드는 세 개의 뚜렷한 선으로 구성되어 있습니다. 어퍼 버마 밴드, 미들 버마 밴드, 로어 버마 밴드입니다. 이 선들은 가격 주위에 그려져 전체 추세에 대한 가격 움직임을 시각적으로 표현합니다. 이 밴드들 사이의 거리는 변동성과 잠재적인 추세 반전에 대한 통찰력을 제공할 수 있습니다.
버마 밴드 라인이 각각에서 분리될 때, 그것은 종종 시장이 횡보 또는 범위 이동 기간에 접어들고 있음을 시사합니다. 이는 명확한 방향 편향이 없음을 나타냅니다. 트레이더는 이러한 기간 동안 추세를 파악하기 어려울 수 있으며 더 명확한 추세가 나타날 때까지 기다릴 수 있습니다.
버마 밴드 라인이 단일 라인으로
현재 33% 할인! 초보자나 전문 트레이더를 위한 최고의 솔루션! 이 보조지표는 우리가 다수의 독창적 기능과 새로운 공식을 통합한 독특하고 고품질이며 저렴한 거래 도구입니다. 이 업데이트를 통해 이중 시간대를 표시할 수 있습니다. 더 높은 TF를 표시할 수 있을 뿐만 아니라 차트 TF와 더 높은 TF 모두를 표시할 수 있습니다: 중첩 영역 표시. 모든 Supply Demand 트레이더들이 좋아할 것입니다. :)
중요한 정보 공개 Advanced Supply Demand의 잠재력을 극대화하려면 다음을 방문하십시오. https://www.mql5.com/ko/blogs/post/720245 진입 또는 목표의 명확한 트리거 포인트를 정확히 찾아냄으로 해서 거래가 어떻게 개선될지 상상해 보십시오. 새로운 알고리즘을 기반으로 매수자와 매도자 간의 잠재적인 불균형을 훨씬 더 쉽게 분간할 수 있습니다. 왜냐하면 가장 강한 공급영역과 가장 강한 수요 영역과 과거에 어떻게 진행 되었는지를(이전
LIMITED! JUST 10 COPIES AVAILABLE! BONUS AUX VIP Club 2024 : Include EA CAP, CEP, LDH, PSC307 & AO4C to enhance the performance of this tool to its maximum potential Click Here to Download Files ( for users only )
FREE Trading Education Available Daily via Zoom --- For More Info or Instant Message Click link --- https://t.me/abcdwave Transform your trading with the "Five Magic Bullets" Indicator, tailored for traders who embrace the power of Elliott Wave Chaos Theory. Spec
Was: $299 Now: $149 Supply Demand uses previous price action to identify potential imbalances between buyers and sellers. The key is to identify the better odds zones, not just the untouched ones. Blahtech Supply Demand indicator delivers functionality previously unavailable on any trading platform. This 4-in-1 indicator not only highlights the higher probability zones using a multi-criteria strength engine, but also combines it with multi-timeframe trend analysis, previously confirmed swings
!SPECIAL SALE! The Trend Forecaster indicator utilizes a unique proprietary algorithm to determine entry points for a breakout trading strategy. The indicator identifies price clusters, analyzes price movement near levels, and provides a signal when the price breaks through a level. The Trend Forecaster indicator is suitable for all financial assets, including currencies (Forex), metals, stocks, indices, and cryptocurrencies. You can also adjust the indicator to work on any time frames, althoug
The AT Forex Indicator MT5 is a sophisticated trading tool designed to provide traders with a comprehensive analysis of multiple currency pairs. This powerful indicator simplifies the complex nature of the forex market, making it accessible for both novice and experienced traders. AT Forex Indicator uses advanced algorithms to detect trends, patterns and is an essential tool for traders aiming to enhance their forex trading performance. With its robust features, ease of use, and reliable signal
시장에 숨겨진 진정한 패턴을 발견하세요. PREDATOR AURORA 트레이딩 시스템과 함께 하세요 — 하이브리드 트레이딩 지표의 최종 보스. 다른 사람들이 보지 못하는 것을 보세요! PREDATOR AURORA 트레이딩 시스템은 평범함의 그림자에서 움츠러들기를 거부하는 사람들을 위해 설계된 강력한 도구입니다. 이것은 단순한 또 다른 지표가 아닙니다; 이것은 당신의 치트 코드입니다; 당신의 불공정한 이점이며, 시장의 움직임을 치명적인 정확도로 추적하는 정교한 하이브리드 헌팅 시스템입니다. 오직 가장 강한 자만이 생존하는 정글에서, 자연에서 가장 강력한 포식자에게 영감을 받은 PREDATOR AURORA는 변화하는 시장 조건에 원활하게 적응하는 고급 적응 알고리즘을 사용합니다. 그림자 속에 숨어 있는 포식자처럼, 시장의 소음을 뚫고 다른 사람들이 결코 발견하지 못할 높은 확률의 거래 기회를 드러냅니다. 주요 특징: 적응형 헌팅 메커니즘: 시장 변동성에 즉시 조정되어 무자비한 효
Elliott Wave Trend was designed for the scientific wave counting. This tool focuses to get rid of the vagueness of the classic Elliott Wave Counting using the guideline from the template and pattern approach. In doing so, firstly Elliott Wave Trend offers the template for your wave counting. Secondly, it offers Wave Structural Score to assist to identify accurate wave formation. It offers both impulse wave Structural Score and corrective wave Structure Score. Structural Score is the rating to sh
Ultron Candle Timer
Used for any timeframe to keep track of time remaining on current candle. User can change inputs and colors. Never wonder again about the time remaining until the next candle. Will work on any market and any chart. Adjust the color to blend in with any of your current chart template. Its a very simple and easy to use indicator but it comes in handy
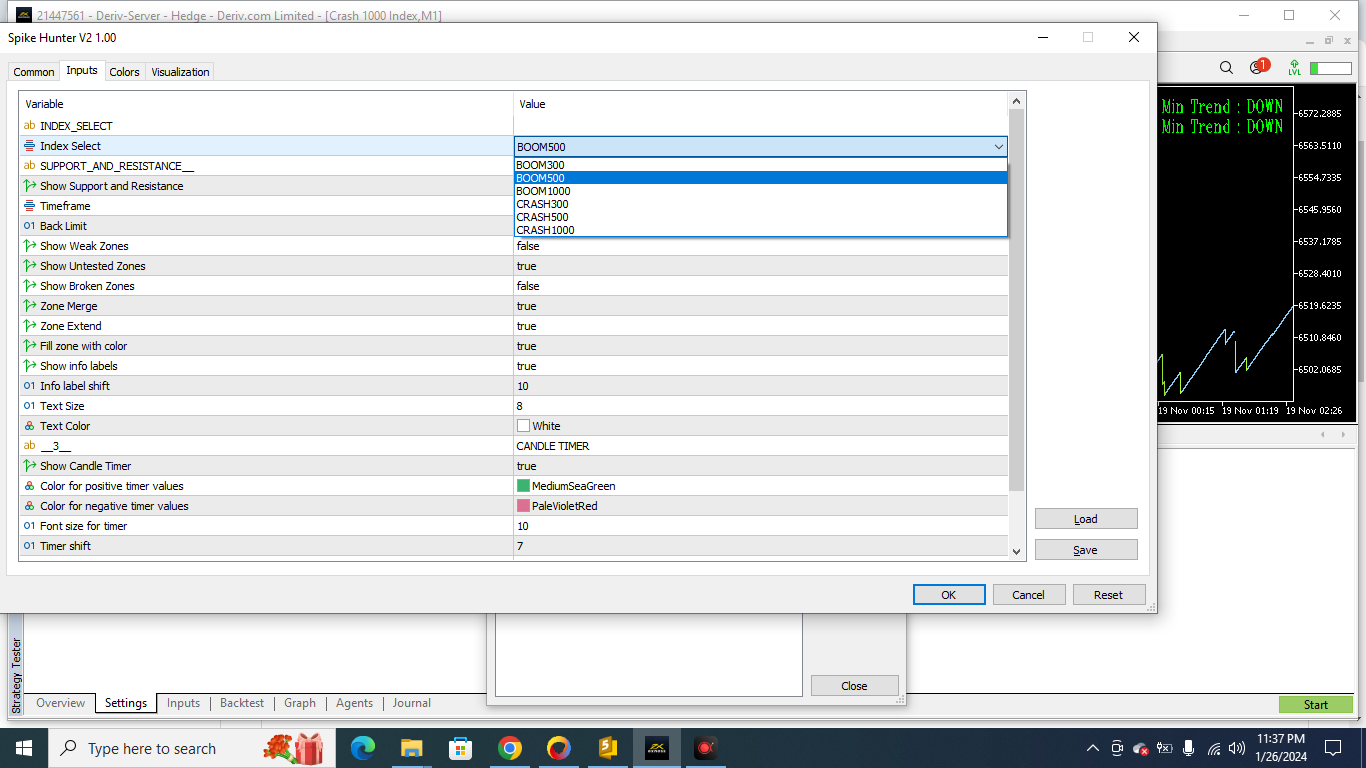
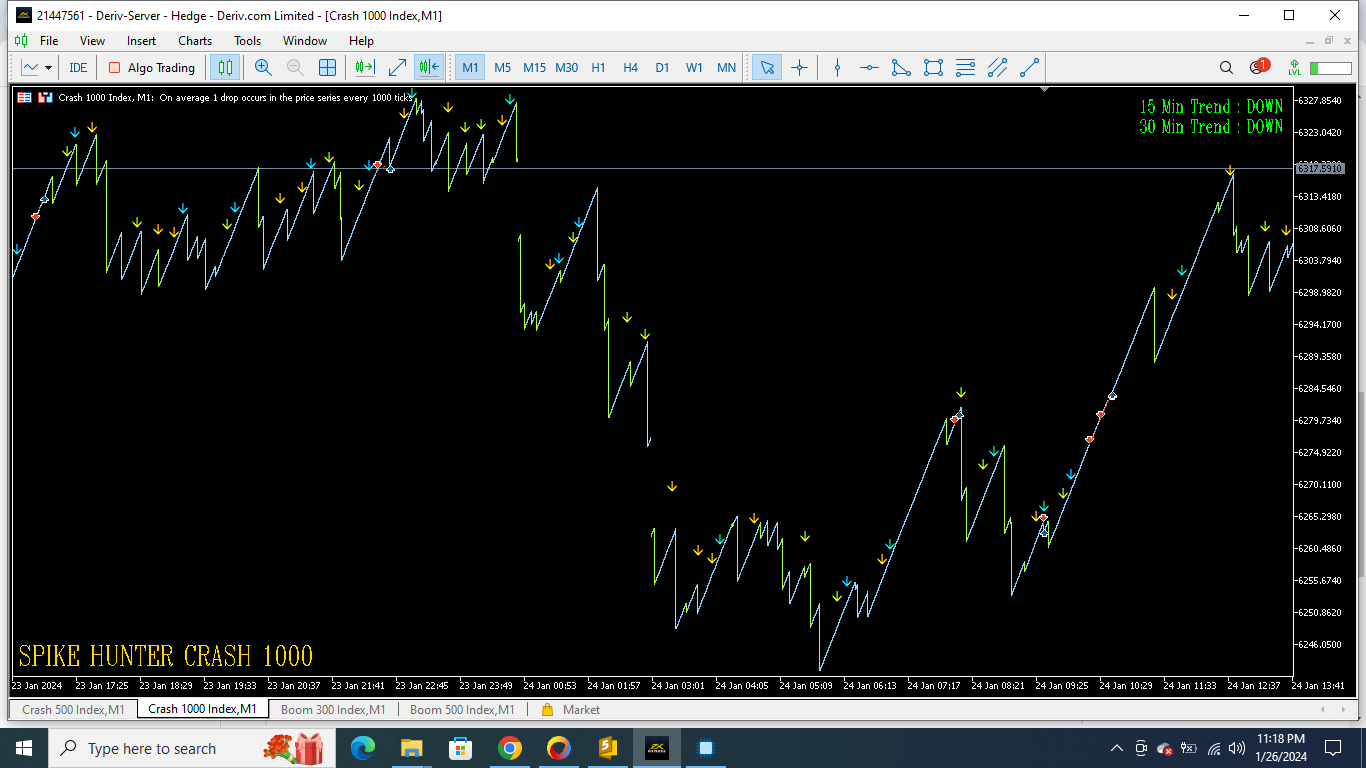
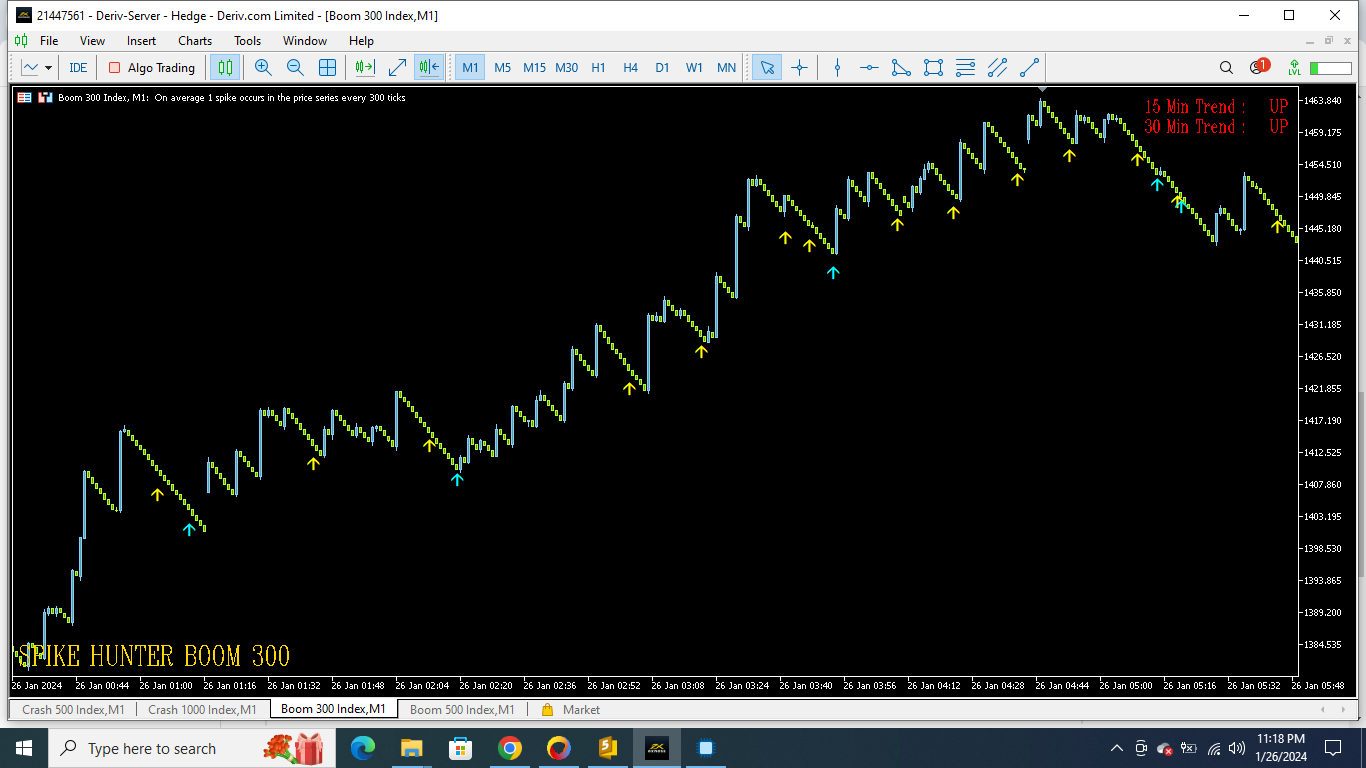
Boom Spike mater is the future for trading Boom markets. It has been designed to run on Boom 300 , 500 and 1000 markets on the 1 minute timeframe. It has 2 different trading modes (Aggressive and Normal) Aggressive mode will plot Yellow and blue arrows. 2 different conditions to help you make the right choice. Enter first trade on yellow arrow and second trade on blue candle. SL in this mode will be 10 Candles from the blue arrow. Normal mode will only plot red arrows on the chart. This mode is
ULTRON TREND MASTER
This Indicator strategy works on any volatility market together with currency pairs and gold. It uses 2 files (Ultron Trend Master 1 and 2) Due to only uploading one file. Please also download Ultron Trend Master 1 free from comment section of this indicator . The purchased file is the main file with the strategy and should be used together with Trend Master 1 File.
The only indicator on the market that will be able to trade any Vix market together with any currency pair or
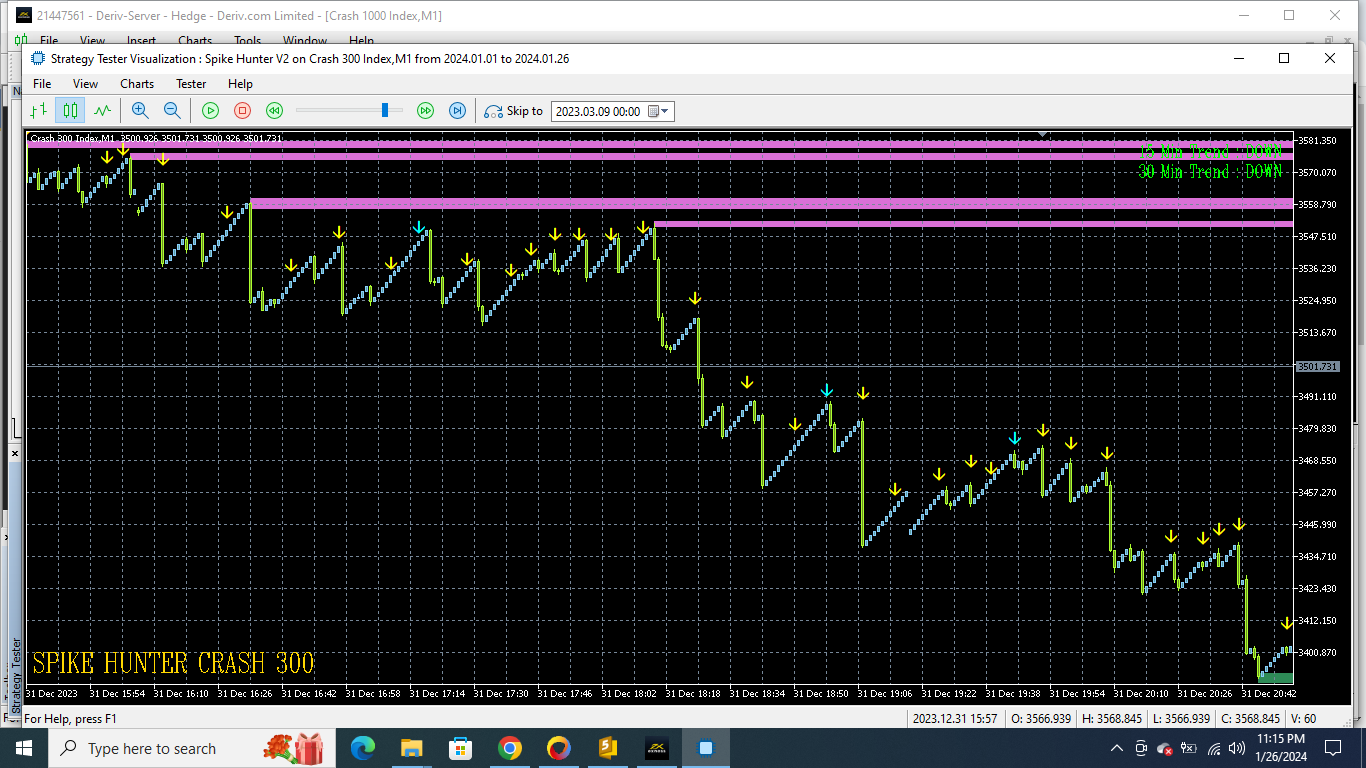
크래시 스파이크 메이터는 크래시 시장에 대한 미래의 거래를 위해 설계되었습니다. 이것은 1분 프레임에서 Crash 300, 500 및 1000 시장에서 실행되도록 설계되었습니다. 2가지 다른 거래 모드가 있습니다 (공격적 및 보통). 공격적 모드는 노란색과 파란색 화살표를 표시할 것입니다. 올바른 선택을 도울 2가지 다른 조건. 노란색 화살표에 첫 거래를 시작하고 두 번째 거래는 파란색 양초에 시작하십시오. 이 모드에서의 손실 제한은 파란색 화살표에서 10 개 양초입니다. 보통 모드는 차트에 빨간색 화살표만 표시합니다. 이 모드는 작은 계정 크기를 위한 것입니다. 또한 코멘트 섹션에서 설정 파일을 다운로드하는 것이 중요합니다. 그냥 차트에 지표를 로드하고 시장에 대한 설정 파일을 로드하십시오. 다운로드하고 피드백을 게시해 주세요. 또한 Boom 시장 지표에 주의를 기울이세요. 피드백은 환영합니다. 더 많은 정보는 +27 74 335 3692로 WhatsApp으로 문의하십시오. 나는