• 미리보기
  • 리뷰
  • 코멘트
  • 새 소식

Trend On Close

TrendOnClose is a sophisticated indicator designed for Binary market investors, focusing on statistical analysis of trends and counter-trends within specific candle cycles.

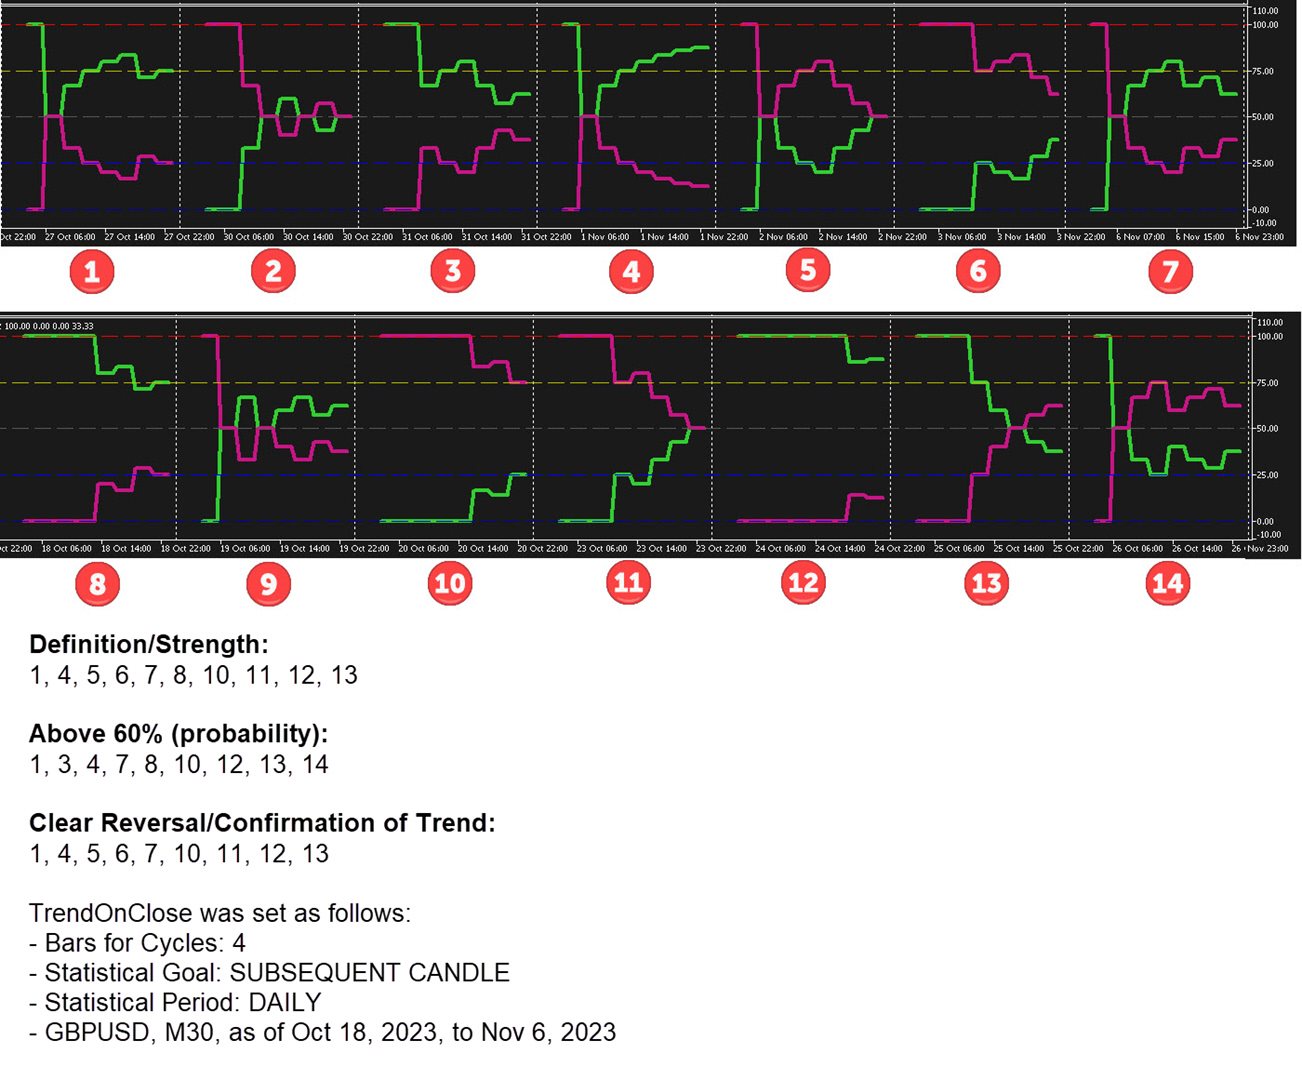
Each cycle is defined by the candle CLOSE price, establishing the trend direction (UP/DOWN - BULL/BEAR) for subsequent statistical analysis until the start of the next cycle. The statistical analysis operates with two configurations:

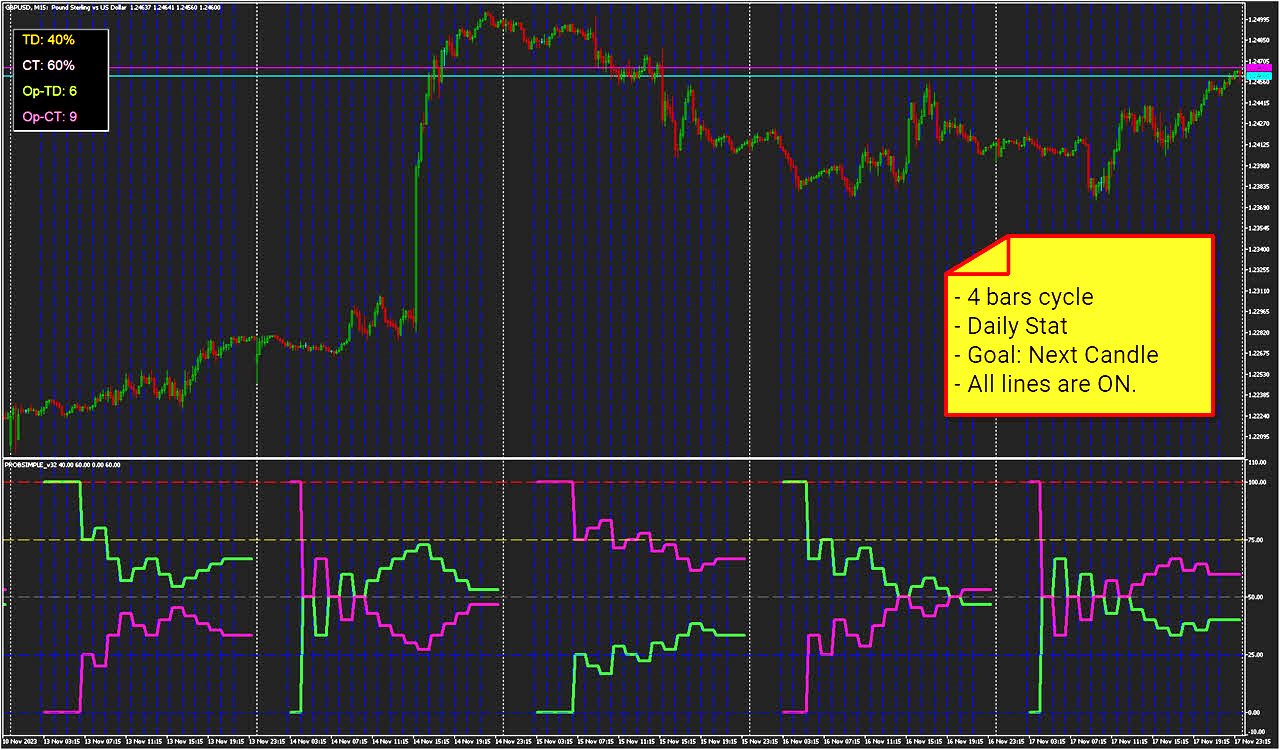
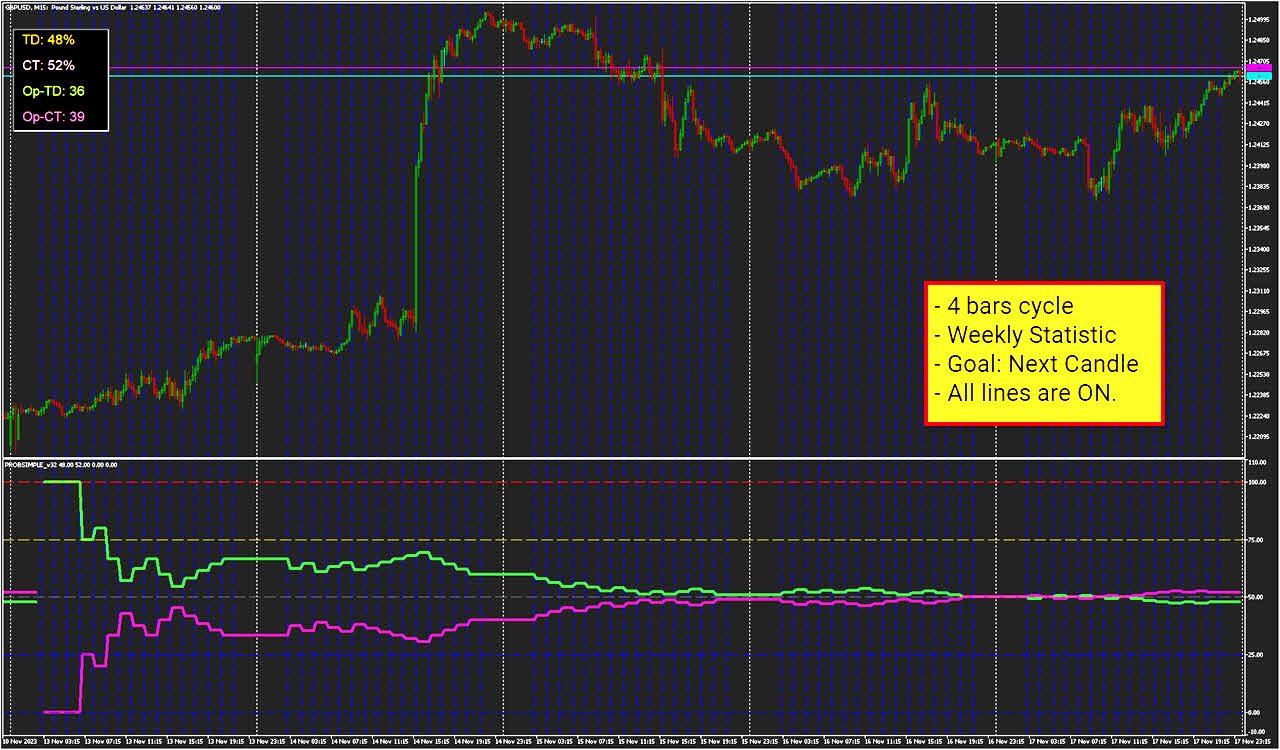
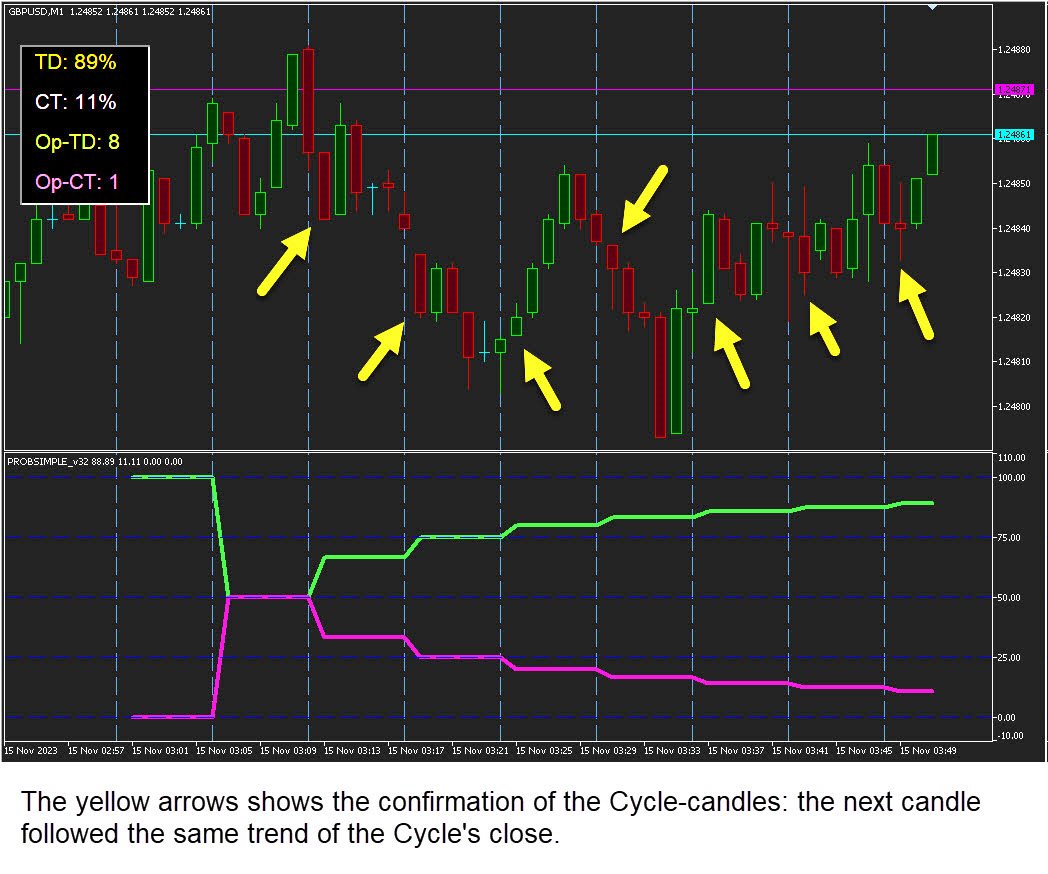
⦁ Statistical Goal as SUBSEQUENT CANDLE: The algorithm focuses on the subsequent candle within the cycle.

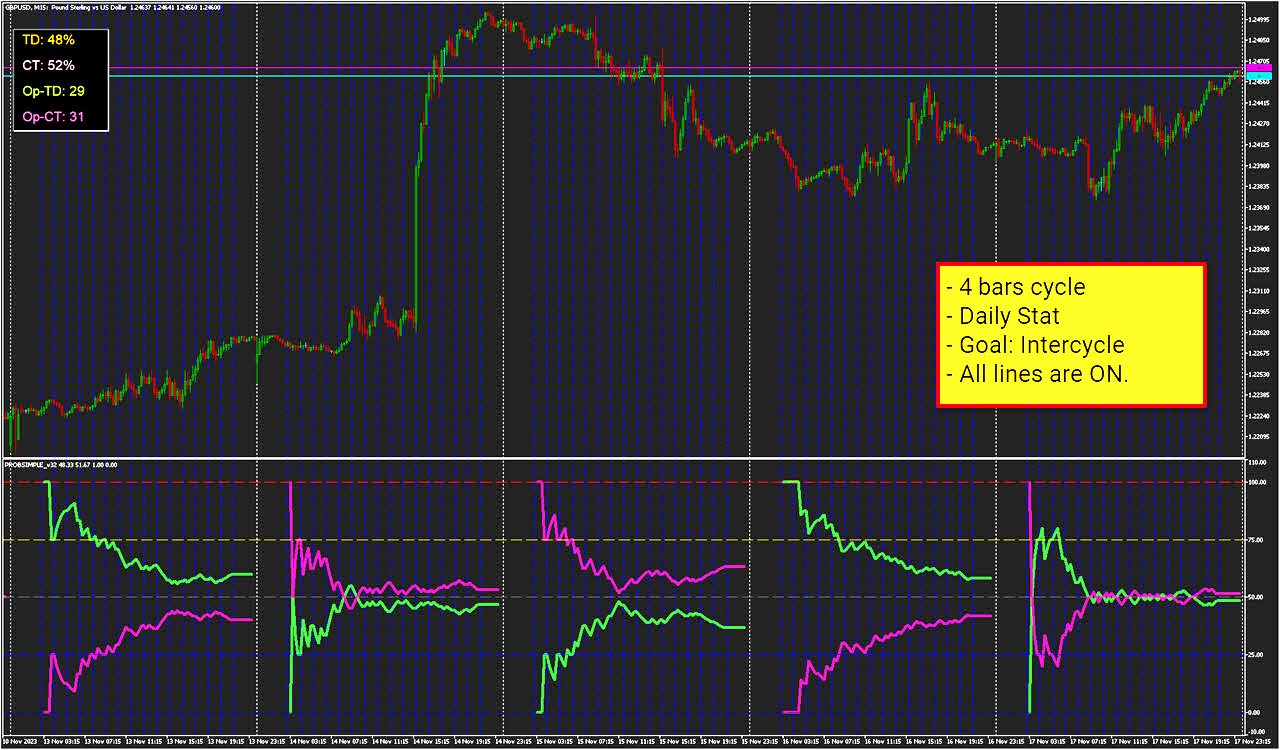
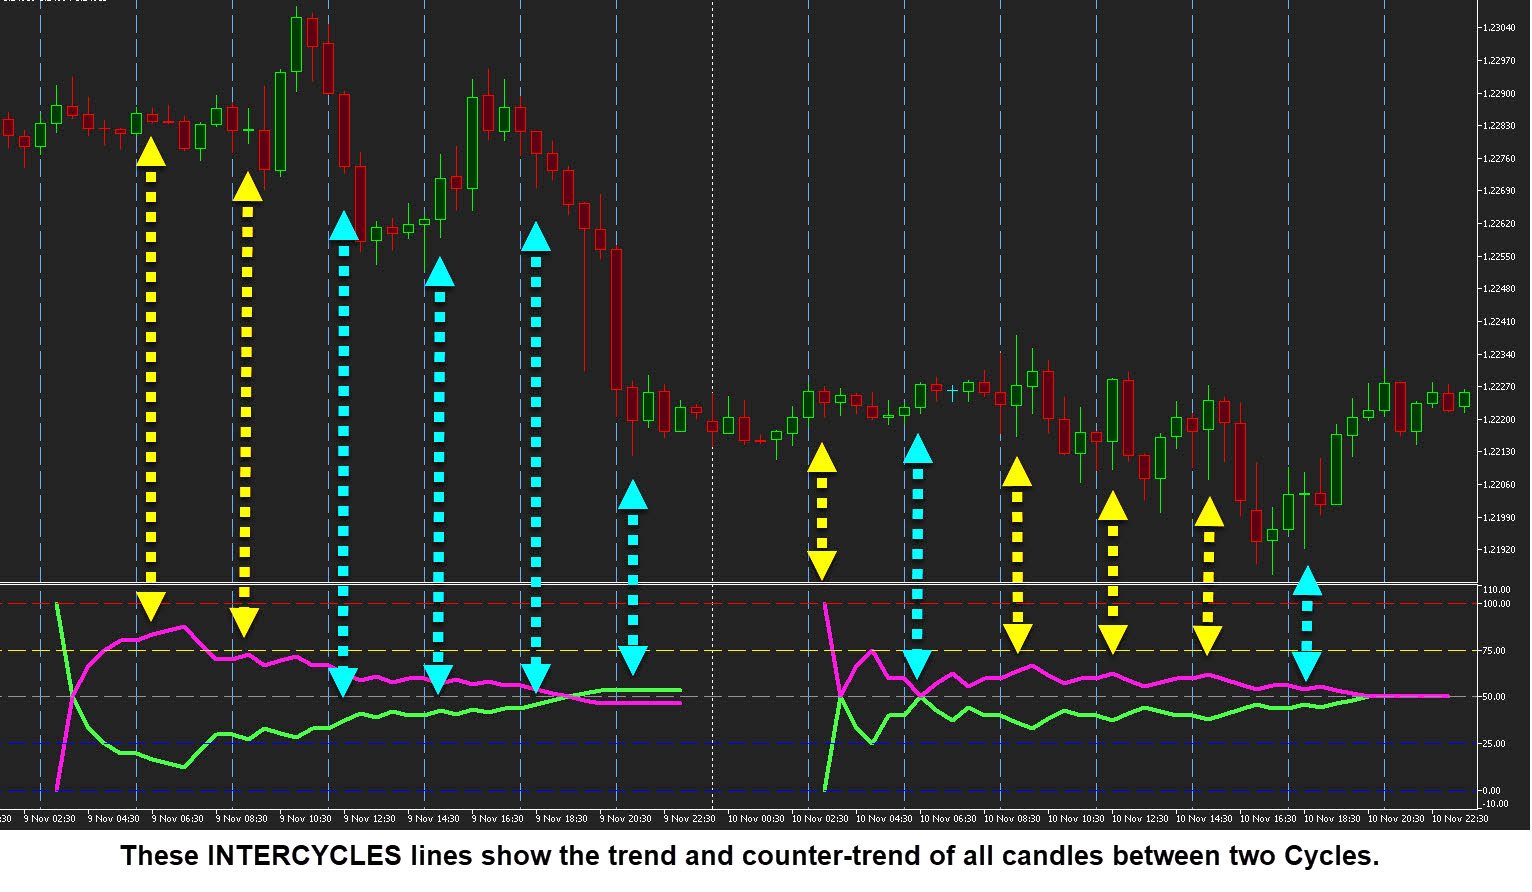
⦁ Statistical Goal as INTERCYCLES: The algorithm considers all candles between each cycle.

Based on the selected Statistical Goal, each candle's trend is compared to the trend of the CYCLE candle, resulting in an increase in TREND-Percent (TD) and Trend-Occurrences (N-TD) for identical directions, or in COUNTER-TREND (CT and N-CT) for diverging trends. Additionally, the indicator provides a statistical sum for Daily, Weekly, or Monthly periods, revealing the number of candles following the "trend" or "counter-trend" of each CYCLE during these periods. At the end of each predefined period, statistics reset for the subsequent cycle.

Features

⦁ No-Repaint Statistical Info: Optimize the analysis of trends and counter-trends in specific cycles/times, evaluating the probability of repetitions (and divergences) based on the CANDLE SUBSEQUENT TO THE CYCLE or INTERCYCLES CANDLES.

⦁ Intuitive: Displays the count and percentage of trends/counter-trends in both text and graphic modes. Additionally, it shows CYCLE lines and TREND/COUNTER-TREND lines that can be fully configured and even suppressed.

⦁ Easily and quickly configure START/END TIME, CYCLES, GOAL, and PERIODS. The START/END times work in a smart mode, adapting to the selected TIMEFRAME in case of incompatibility (e.g., even hours in odd TIMEFRAMES like M3, M15, etc).

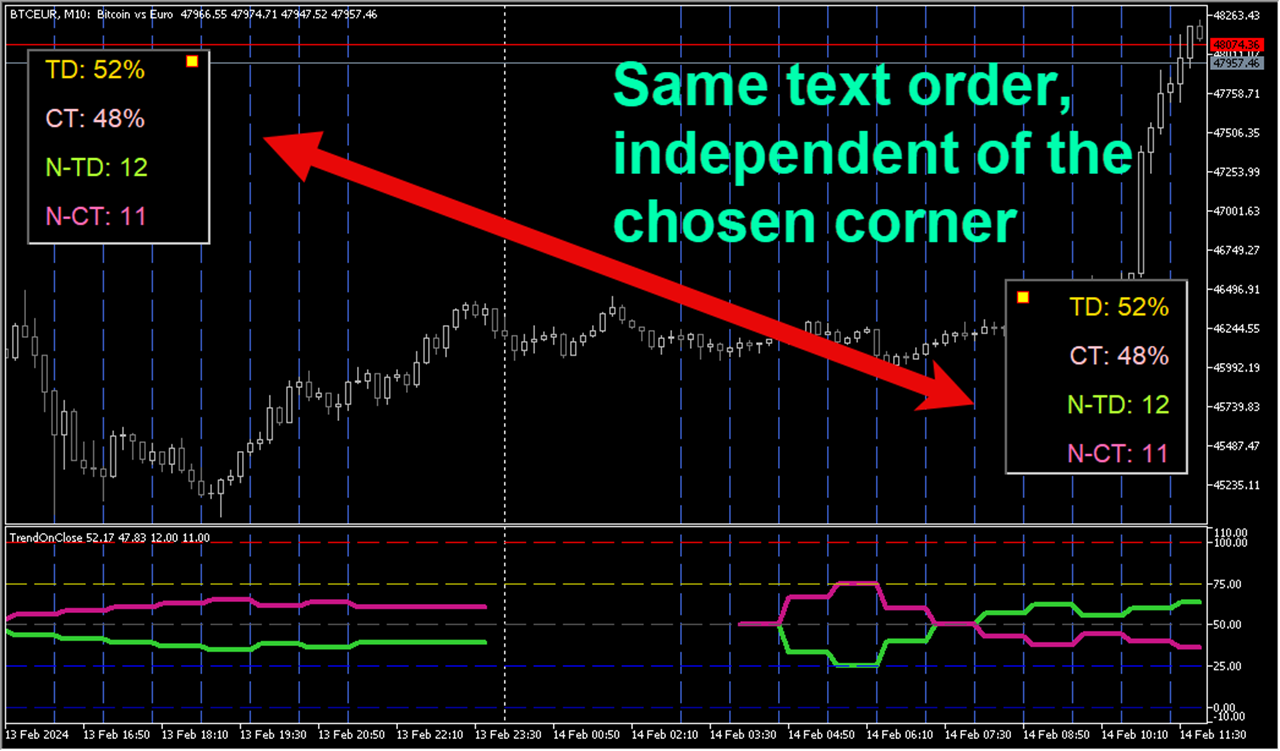
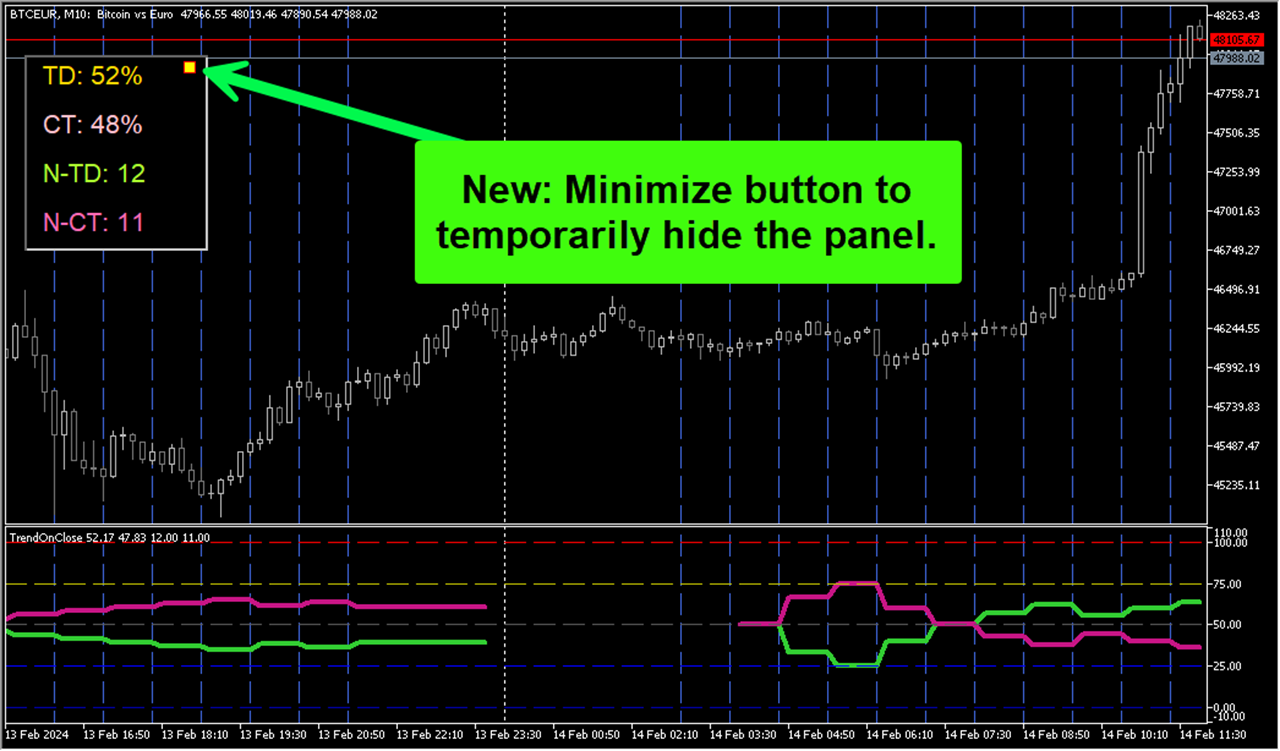
⦁ A PANEL for quick access to statistical information in text mode. The panel can be minimized or moved to any of the four quadrants of the main CHART, with many layout options.

추천 제품
Limitless MT5
Dmitriy Kashevich
Limitless MT5 is a universal indicator suitable for every beginner and experienced trader. works on all currency pairs, cryptocurrencies, raw stocks Limitless MT5 - already configured and does not require additional configuration And now the main thing Why Limitless MT5? 1 complete lack of redrawing 2 two years of testing by the best specialists in trading 3 the accuracy of correct signals exceeds 80% 4 performed well in trading during news releases Trading rules 1 buy signa
Smooth price for Monarch
Konstantin Gruzdev
5 (1)
The Smooth Price technical indicator is used for plotting a smoothed line as close to the price of the financial instrument as possible, and serves to eliminate its noise components. The indicator is part of the Monarch trading system, but here it is presented as an independent technical analysis tool. The indicator is based on the cluster digital filter , which, unlike the ClusterSMA , is applied directly to the price time series. Smooth Price does not redraw (except the very last, zero bar) an
Big Player Range
Thalles Nascimento De Carvalho
5 (1)
"BigPlayerRange"의 힘을 발견하세요: 시장 기술 분석에서 당신의 동맹 BigPlayerRange 를 소개합니다. 이 고급 기술 분석 도구는 시장에서 기관 투자자들의 관심 영역을 드러내기 위해 설계되었습니다. 이 도구를 사용하면 주요 시장 참여자들이 어디에서 활발히 활동하고 있는지를 정확히 식별하고, 이로 인해 거래 전략에 어떤 영향을 미칠 수 있는지를 이해할 수 있습니다. 주요 특징: 기관 투자자의 관심 영역 매핑 : BigPlayerRange 는 기관 투자자들이 활발히 활동하는 구역을 강조하여 시장의 잠재적인 움직임에 대한 귀중한 통찰을 제공합니다. 출구 참조를 위한 예측 : 이 지표는 두 단계에서 가능한 출구를 제안하는 예측을 활용하여, 미래 가격 동향을 기반으로 전략을 계획하는 데 도움을 줍니다. 되돌림 확률 : 가격이 식별된 범위로 돌아올 때의 되돌림 확률을 평가합니다. 이 기능은 리스크 관리를 돕고 전략을 조정하는 데 유용합니다. BigPla
HiLo Activator Plus
Rodrigo Galeote
5 (1)
HiLo Activator is one of the most used indicators to determine trend. Find it here with the ability to customize period and colors. This indicator also plots up and down arrows when there is a change on the trend, indicating very strong entry and exit points. HiLo fits well to different types of periods for day trading. You can easily understand when it is time to buy or sell. It works pretty good also for other periods like daily and monthly signalizing long-term trends. The use of the indicato
Deriv Boom sell
Yaovi Inoussa Atchou
Our BOOM SELL ALERT indicator is specifically engineered to   take candles on BOOM 1000 , BOOM 500 is tool is optimized for M1 (1-minute) timeframe, ensuring you receive timely and actionable insights.   The indicator is a combination of   many indicators. -        AO Oscillator -        Stochastic   HOW TO USE THIS INDICATOR To use well this indicator , it   need to use SCHAFF TREND RSX ( 5 MIN OR M5) IF SCHAFF trend RSX is GREEN and you have a signal then SELL when you have ENTRY and out with
Win43 Scalper
Eadvisors Software Inc.
O novo s43 Scalper para Mini-Índice (WIN-IND) faz operações de curto prazo no timeframe 1min buscando pequenas variações do mercado, utiliza nova tecnologia de trade, os resultados no intraday são íncríveis, confira:      Após a instalação adicione no gráfico dos instrumentos win para visualizar os resultados no backteste. Recomendamos o timeframe de 1min.
PipFinite Exit EDGE MT5
Karlo Wilson Vendiola
4.83 (23)
Did You Have A Profitable Trade But Suddenly Reversed? In a solid strategy, exiting a trade is equally important as entering. Exit EDGE helps maximize your current trade profit and avoid turning winning trades to losers. Never Miss An Exit Signal Again Monitor all pairs and timeframes in just 1 chart www.mql5.com/en/blogs/post/726558 How To Trade You can close your open trades as soon as you receive a signal Close your Buy orders if you receive an Exit Buy Signal. Close your Sell orde
AutoSignals Trend Panel
Danilo Maia Siqueira
The indicator tracks the trend in 5 different chart times for the same asset, based on 6 signals for each chart time. The main objective of the indicator is to show us the majority trend of the financial asset in which it was placed. The system transmits the information of the trends in several graphical times, in this way the user is able to have a wide view of the movement of the asset, this type of tool makes the user have a higher hit rate by helping the operator to execute orders in fa
XCalper HiLo Activator
Aecio de Feo Flora Neto
HiLo Activator v1.02 by xCalper The HiLo Activator is similar to moving average of previous highs and lows. It is a trend-following indicator used to display market’s direction of movement. The indicator is responsible for entry signals and also helps determine stop-loss levels. The HiLo Activator was first introduced by Robert Krausz in the Feb. 1998 issue of Stocks & Commodities Magazine.
표시기는 현재 시세를 작성하여 과거 시세와 비교할 수 있으며 이를 바탕으로 가격 변동을 예측합니다. 표시기에는 원하는 날짜로 빠르게 이동할 수 있는 텍스트 필드가 있습니다. 옵션: 기호 - 표시기가 표시할 기호 선택. SymbolPeriod - 지표가 데이터를 가져올 기간 선택. IndicatorColor - 표시기 색상. HorisontalShift - 지시자가 그린 따옴표를 지정된 막대 수만큼 이동합니다. Inverse - true는 인용 부호를 반대로, false - 원래 보기를 반전합니다. ChartVerticalShiftStep - 차트를 수직으로 이동합니다(키보드의 위/아래 화살표). 다음은 날짜를 입력할 수 있는 텍스트 필드의 설정으로, '엔터'를 누르면 즉시 이동할 수 있습니다.
>>> BIG SALE PROMOTION: 50% OFF + GIFT EA!  - Promo price: $64 / Regular price $129 <<< - The promotion will end soon! The Forex Trend Tracker is an advanced tool designed to enhance the trading capabilities of forex traders. This sophisticated indicator uses complex mathematical formulas alongside the Average True Range (ATR) to detect the beginnings of new upward and downward trends in the forex market. It offers visual cues and real-time alerts to give traders a competitive advantage in th
Классификатор силы тренда. Показания на истории не меняет. Изменяется классификация только незакрытого бара. По идее подобен полной системе ASCTrend, сигнальный модуль которой, точнее его аппроксимация в несколько "урезанном" виде, есть в свободном доступе, а также в терминале как сигнальный индикатор SilverTrend . Точной копией системы ASCTrend не является. Работает на всех инструментах и всех временных диапазонах. Индикатор использует несколько некоррелируемых между собой алгоритмов для класси
Noize Absorption Index
Ekaterina Saltykova
Noize Absorption Index - is the manual trading system that measures the difference of pressure between bears forces and bulls forces. Green line - is a noize free index that showing curent situation. Zero value of index shows totally choppy/flat market.Values above zero level shows how powerfull bullish wave is and values below zero measures bearish forces.Up arrow appears on bearish market when it's ready to reverse, dn arrow appears on weak bullish market, as a result of reverse expectation.
WanaScalper
Isaac Wanasolo
1 (1)
A scalping indicator based on mathematical patterns, which on average gives signals with relatively small SL, and also occasionally helps to catch big moves in the markets (more information in the video) This indicator has three main types of notifications: The first type warns of a possible/upcoming signal on the next bar The second type indicates the presence of a ready signal to enter the market/open a position The third type is for SL and TP levels - you will be notified every time price r
Golden Limit
Renato Fridschtein
There are no limits! Golden Limit is the ultimate indicator to get clear and easy readings of price movements on charts. It projects support and resistance ranges, calculated by statistical models involving Price Action and the Fibonacci sequence, revealing in advance the behavior of prices and the best places to trade and not to trade. It also has two moving averages to help choose the best entries. The Golden Limit method was created from a proven model. In summary: We use the names of preci
Setup Double 7s
Luigi Nunes Labigalini
Entry and exit signals from the Double 7's Strategy by Larry Connors in his book "Short Term Trading Strategies That Work". Larry claims this strategy predicted the market's direction over 80% of the time since 1995. Picking up the gains and being exposed in the market less than 25% of the time. Good for swing trading on Daily charts of SPY, Nasdaq, China's FXI, Brazil's EWZ and the majority of the equity ETFs and World Indices. How does it work? The indicator activates the buy signal when
SmartTrendMt5
Andrey Spiridonov
The SmartTrendMt5 trend indicator generates signals based on the principle of combined analysis of calculated reference points within the Keltner channel. The indicator plots the Keltner channel in a separate window (by default, red lines and a blue line - the middle of the channel), and also draws the histogram of calculated reference points for each candle (by default, the histogram bars are yellow). The should be attached to a chart of any timeframe and any trading symbol in the usual way.
Color Histogram Volume Set
Ricardo Almeida Branco
Do you use volume in your reading of the market? Certainly many traders use it, and do not imagine operating without it. The Color Histogram Volume Set indicator allows the user to choose the value that he considers interesting to monitor. When you pass this you will have visual confirmation and if you want you will also have the audible alert that is given by the indicator. Of course, there are other ways to try to find a high volume, such as assessing whether the volume
FT Gold Robot MT5
Marzena Maria Szmit
4.47 (58)
Introducing the FT Gold Robot MT5, your ultimate companion in navigating the intricate world of XAUUSD trading. Developed with precision and powered by cutting-edge algorithms, FT Gold is a forex robot meticulously crafted to optimize your trading performance with XAUUSD pairs . With its advanced analytical capabilities, FT Gold Robot constantly monitors the gold market, identifying key trends, patterns, and price movements with lightning speed. The FT Gold Robot opens 5 positions every day (you
Welcome to the Ultimate Harmonic Patterns recognition indicator that is focused to detect advanced patterns. The Gartley pattern, Bat pattern, and Cypher pattern  are popular technical analysis tools used by traders to identify potential reversal points in the market. Our Ultimate Harmonic Patterns recognition Indicator is a powerful tool that uses advanced algorithms to scan the markets and identify these patterns in real-time. With our Ultimate Harmonic Patterns recognition Indicator, you
Perfect Sniper
Ignacio Agustin Mene Franco
Perfect Sniper! is a triple indicator with support resistance detection, downtrend channel, uptrend channel Bands included! where he hunts the rebounds in the red lines for sale, in the green lines mark purchase, in the lower bands that are the breaks gives another second entry either buy or sell, perfect to take advantage of the double entrance, It is used in any temporality, It is used to scalp and long on h1 or h4 to D1. It works for Forex markets, All pairs. It is used for the synthetic inde
WAPV Weis Wave Chart Forex
Eduardo Da Costa Custodio Santos
The Weis Wave Chart Forex for MT5 is a Price and Volume indicator. The Price and Volume reading was widely disseminated through Richard Demille Wyckoff based on the three laws created by him: Supply and Demand, Cause and Effect and Effort vs. Result. In 1900 R.Wyckoff already used the wave chart in his analyses. Many years later, around 1990, David Weis Automated R. Wyckoff's wave chart and today we bring you the evolution of David Weis' wave chart. It shows the amount of Volume and the amount o
무한대에서 통화의 강도를 측정하는이 혁신적인 지표는 오랫동안 거래하는 암표 및 거래자에게 없어서는 안될 조수입니다. 통화의 강도/약점을 분석하는 시스템은 오랫동안 알려져 있으며 세계 최고의 거래자들에 의해 시장에서 사용되었습니다. 이 분석 없이는 차익 거래가 완료되지 않습니다. 우리의 지표는 서로 관련하여 기본 통화의 강도를 쉽게 결정합니다. 표시 라인에 차트에 대한 모든 또는 현재 통화 쌍의 수 있도록 즉각적인 분석 및 검색에 대한 강한 진입 점. 표시등,직관적 인 사용하면 신속하게 찾아와 스위치는 모든 쌍,모바일 패널 배치할 수 있는 모두에서 지하실에는 기본 차트. 통화의 강도의 변화의 통지의 타이머 모드는 상인에게 전화로 알림을받을 수있는 기회를 제공합니다.  통화 전력계 무한대 표시기를 사용하기위한 몇 가지 전략: 1. 신흥 추세에 대한 신호로 교차점을 검색 할 통화의 강도의 선형 표시의 차트를 사용하여 2. 추세 반전 신호가 나타난 후 강한 통화 방향으로 두피
Premium level Pro
Dmitriy Kashevich
Premium level is a unique indicator with more than 80% accuracy of correct predictions! This indicator has been tested for more than two months by the best Trading Specialists! The author's indicator you will not find anywhere else! From the screenshots you can see for yourself the accuracy of this tool! 1 is great for trading binary options with an expiration time of 1 candle. 2 works on all currency pairs, stocks, commodities, cryptocurrencies Instructions: As soon as the red ar
Based on the trading model/strategy/system of gold double-position hedging and arbitrage launched by Goodtrade Brokers, problems encountered in daily operations: 1. Account B immediately places an order immediately following account A. 2: After account A places an order, account B will automatically copy the stop loss and take profit. 3: Account A closes the position of Account B and closes the position at the same time. 4: When account B closes the position, account A also closes the position.
UPD1 Profile Levels MT5
Vitaliy Kuznetsov
5 (3)
표시기는 지정된 막대 수에 대한 작업 히스토그램에서 최대 및 최소 가격 볼륨(시장 프로필)의 수준을 찾습니다.   복합 프로파일. 히스토그램의 높이는 완전 자동이며 모든 기기 및 기간에 맞게 조정됩니다. 저자의 알고리즘이 사용되며 잘 알려진 아날로그를 반복하지 않습니다. 두 히스토그램의 높이는 촛불의 평균 높이와 거의 같습니다. 스마트 경고는 볼륨 레벨에 관한 가격에 대해 알려 도움이 될 것입니다. 개념Smart Money. Low Volume - Imbalance. ,좋은 시장 상황을 찾아 시장의 구조를 결정하고 바이너리 옵션에 대한 필터로 사용됩니다. 그것은 가격에 대한 자석입니다. High Volume - Liquidity. 는 시험을 위해 축적을 나갈 때 사용됩니다. 입력 매개 변수. 기본. Bars Count - 계산 및 표시 할 막대 수. Signal Fractal = 5 (색상 신호 레벨). 수준은 다음과 같은 조건에서 신호가 될 것입니다:그것을 초과하지 않는
우선적으로, 이 거래 도구는 전문적인 거래에 이상적인 비-다시 그리기 및 지연되지 않는 지표입니다.  온라인 강좌, 사용자 매뉴얼 및 데모. 스마트 가격 액션 컨셉트 인디케이터는 신규 및 경험 많은 트레이더 모두에게 매우 강력한 도구입니다. Inner Circle Trader Analysis 및 Smart Money Concepts Trading Strategies와 같은 고급 거래 아이디어를 결합하여 20가지 이상의 유용한 지표를 하나로 결합합니다. 이 인디케이터는 스마트 머니 컨셉트에 중점을 두어 대형 기관의 거래 방식을 제공하고 이동을 예측하는 데 도움을 줍니다.  특히 유동성 분석에 뛰어나 기관이 어떻게 거래하는지 이해하는 데 도움을 줍니다. 시장 트렌드를 예측하고 가격 변동을 신중하게 분석하는 데 탁월합니다. 귀하의 거래를 기관 전략에 맞추어 시장의 동향에 대해 더 정확한 예측을 할 수 있습니다. 이 인디케이터는 시장 구조를 분석하고 중요한 주문 블록을 식별하
Description The indicator uses market profile theory to show the most relevant trading zones, on a daily basis. The zones to be shown are LVN (low volume nodes) and POC (point of control). An LVN zone is one which represents price areas with the least time or volume throughout the day. Typically, these areas indicate a supply or demand initiative, and in the future, they can turn into important breakout or retracement zones. A POC zone is one which represents price areas with the most time or vo
The "RMA Signal Indicator MT5" refers to an indicator called "RMA" (Running Moving Average) Signal Indicator designed specifically for the MetaTrader 5 (MT5) trading platform. The RMA is a variation of the Moving Average indicator that emphasizes recent price data. The specific details and functionality of the "RMA Signal Indicator MT5" may depend on the developer or the version you are using. However, in general, here is a general approach to using a signal indicator like RMA on the MT5 platfor
Mt5TradeCopier
Mcblastus Gicharu Ndiba
Forex Trade copier MT5.  It copies forex trades, positions, orders from any accounts to any other account,  MT5 even multiple accounts. The unique copying algorithm exactly copies all trades from the master account to your client account. It is also noted for its high operation speed and Tough error handling. It also can copy from demo account to live account too. It is one of the best free trade copiers that can do ,  MT5 or to multiple accounts  MT5 to multiple accounts  Features of Trade Copi
이 제품의 구매자들이 또한 구매함
TPSpro RFI Levels MT5
Roman Podpora
4.63 (8)
Reversal First Impulse levels (RFI)      INSTRUCTIONS        RUS       -       ENG              R ecommended to use with an indicator   -   TPSpro  TREND PRO -  Version MT4                 A key element in trading is zones or levels from which decisions to buy or sell a trading instrument are made. Despite attempts by major players to conceal their presence in the market, they inevitably leave traces. Our task was to learn how to identify these traces and interpret them correctly. Main functi
TrendMaestro5
Stefano Frisetti
note: this indicator is for METATRADER4, if you want the version for METATRADER5 this is the link:  https://www.mql5.com/it/market/product/108106 TRENDMAESTRO ver 2.4 TRENDMAESTRO recognizes a new TREND in the bud, he never makes mistakes. The certainty of identifying a new TREND is priceless. DESCRIPTION TRENDMAESTRO identifies a new TREND in the bud, this indicator examines the volatility, volumes and momentum to identify the moment in which there is an explosion of one or more of these data a
Bill Williams Advanced
Siarhei Vashchylka
5 (8)
Bill Williams Advanced is designed for automatic chart analysis using Bill Williams' "Profitunity" system. The indicator analyzes four timeframes at once. Manual (Be sure to read before purchasing) Advantages 1. Automatically analyzes the chart using the "Profitunity" system of Bill Williams. The found signals are placed in a table in the corner of the screen. 2. Equipped with a trend filter based on the Alligator indicator. Most of the system signals are recommended to be used only accordi
Trade smarter, not harder: Empower your trading with Harmonacci Patterns Special Offer: Purchase now to receive free bonuses worth $165! (Read more for details) This is arguably the most complete harmonic price formation auto-recognition indicator you can find for the MetaTrader Platform. It detects 19 different patterns, takes fibonacci projections as seriously as you do, displays the Potential Reversal Zone (PRZ) and finds suitable stop-loss and take-profit levels. [ Installation Guide | Up
Introduction to X3 Chart Pattern Scanner X3 Cherart Pattern Scanner is the non-repainting and non-lagging indicator detecting X3 chart patterns including Harmonic pattern, Elliott Wave pattern, X3 patterns, and Japanese Candlestick patterns. Historical patterns match with signal patterns. Hence, you can readily develop the solid trading strategy in your chart. More importantly, this superb pattern scanner can detect the optimal pattern of its kind. In addition, you can switch on and off individu
FxaccurateLS
Shiv Raj Kumawat
WHY IS OUR FXACCCURATE LS MT5 THE PROFITABLE ? PROTECT YOUR CAPITAL WITH RISK MANAGEMENT Gives entry, stop and target levels from time to time. It finds Trading opportunities by analyzing what the price is doing during established trends. POWERFUL INDICATOR FOR A RELIABLE STRATEGIES We have made these indicators with a lot of years of hard work. It is made at a very advanced level. Established trends provide dozens of trading opportunities, but most trend indicators completely ignore them!
VTrende Pro
Andrii Diachenko
5 (1)
VTrende Pro - MTF indicator for trend trading with a display panel for MT5 *** Videos can be translated into any language using subtitles (video language - Russian) Although the signals of the VTrende Pro indicator can be used as signals of a full-fledged trading system, it is recommended to use them in conjunction with the Bill Williams TS. VTrende Pro is an extended version of the VTrende indicator. Difference between Pro version and VTrende: - Time zones - Signal V - signal 1-2 waves
PZ Swing Trading MT5
PZ TRADING SLU
5 (3)
Protect against whipsaws: revolutionize your swing trading approach Special Offer: Purchase now to receive free bonuses worth $159! (Read more for details) Swing Trading is the first indicator designed to detect swings in the direction of the trend and possible reversal swings. It uses the baseline swing trading approach, widely described in trading literature. The indicator studies several price and time vectors to track the aggregate trend direction and detects situations in which the market i
IVISTscalp5
Vadym Zhukovskyi
5 (5)
당신에게 소개하는 iVISTscalp5 지표는 독특하면서도 거래 작업에서 효과적입니다. 이 지표는 시간 데이터를 기반으로 하며 금융 시장의 많은 경험과 깊은 분석의 결과입니다. iVISTscalp5 지표는 수동 거래에 뛰어난 도구입니다. 편리성, 간단함 및 시각화 - 모든 복잡성은 숨겨져 있습니다. 우리는 iVISTscalp5 지표의 설정과 사용을 최대한 단순화했습니다. 이 지표는 MT5 터미널에서 가지고 있는 모든 금융 상품에 적합합니다. 시간 기준으로 작동하는 시간은 4am에서 8pm (UTC+3)입니다. iVISTscalp5 지표 메뉴 (스크린샷 1 참조): History - 표시할 주간 수 계산 dT_min - 시간 설정 간격 선택 (분) TFline - 수평 볼륨 생성 (타임프레임) BARSline - 수평 볼륨 생성 (바 수) TFtrend1 - 매일 채널 생성 (타임프레임) BARStrend1 - 매일 채널 생성 (바 수) TFtrend2 - 주간 채널 생성 (타임프레임
Dragon Multi Indicator MT5
Mansour Babasafary
5 (5)
3 Indicators in 1 indicator Strategy based on price action Made specifically for the best forex currency pairs Can be used in the best time frame of the market at a very reasonable price This indicator is basically 3 different indicatos . But we have combined these 3 indicators in 1 indicator so that you can use 3 indicators at the lowest price. All three strategies are based on price action. But based on different trends. Long term, medium term and short term Attributes : No repaintin
The iChannels
BeeXXI Corporation
5 (1)
Ultra-fast recognition of parabolic channels (as well as linear, horizontal and wavy channels) throughout the depth of history, creating a hierarchy of channels. Required setting: Max bars in chart: Unlimited This indicator is designed primarily for algorithmic trading, but can also be used for manual trading.  This indicator will have a very active evolution in the near future and detailed descriptions on how to apply to create robots
Matreshka
Dimitr Trifonov
5 (1)
Matreshka self-testing and self-optimizing indicator: 1. Is an interpretation of the Elliott Wave Analysis Theory. 2. Based on the principle of the indicator type ZigZag, and the waves are based on the principle of interpretation of the theory of DeMark. 3. Filters waves in length and height. 4. Draws up to six levels of ZigZag at the same time, tracking waves of different orders. 5. Marks Pulsed and Recoil Waves. 6. Draws arrows to open positions 7. Draws three channels. 8. Notes support and re
Elliot Waves Analyzer Pro
Viktor Weidenthal
2.67 (3)
Elliot Waves Analyzer Pro calculates Elliot Waves to Help Identify Trend direction and Entry Levels. Mainly for Swing Trading Strategies. Usually one would open a Position in trend direction for Wave 3 or a Correction for Wave C . This Indicator draws Target Levels for the current and next wave. Most important Rules for Elliot Wave Analysis are verified by the Indicator.  The Pro version analyzes Multiple Timeframes and shows the Subwaves and Target-Levels.   For an Overview  " Elliot Waves Anal
Piranha version 2
Maria Strudov
5 (1)
"Piranha" - an autonomous trading system that determines overbought and oversold levels on the chart. Red and blue zones represent overbought and oversold levels respectively. Entry points are marked with arrows: a downward arrow in the red zone for "sell" and an upward arrow in the blue zone for "buy". The Take profit level is indicated by the green moving average. Key features: Adjusting the Take profit level as the green moving average changes position. Averaging ability when a new market e
Introducing the South African Sniper indicator created by a small group of traders with a few years trading trading the financial market profitably . This is a plug and play indicator that provides you with  BUY and SELL (SNIPER ENTRY) signals with TARGET and trail stops. The indicator Works with all MT5 trading instruments. The indicator uses previous  chart data as receipt to speculate on future market moves.  "The South African Sniper indicator community are very happy with the indicator an
Limited Offer:    Take advantage of our limited-time offer on the FxBears Powers Indicator! When you purchase this powerful tool, you'll also receive the renowned FxBears EA, an expert advisor that automatically executes the indicator's signals. Don't miss out on this unbeatable combination to enhance your trading strategy! No more losses with this indicator, test it for years ago and see if there is losses in one day results. but before testing it please see the explaining video down here. 
PZ Trend Trading MT5
PZ TRADING SLU
3.67 (3)
Capture every opportunity: your go-to indicator for profitable trend trading Special Offer: Purchase now to receive free bonuses worth $159! (Read more for details) Trend Trading is an indicator designed to profit as much as possible from trends taking place in the market, by timing pullbacks and breakouts. It finds trading opportunities by analyzing what the price is doing during established trends. [ Installation Guide | Update Guide | Troubleshooting | FAQ | All Products ] Trade financial
The indicator is designed to close positions on the market in time. For example: to take profits ahead of schedule if the price has not reached TakeProfit, and the market is turning around. The indicator analyzes the momentum, not the trend. He does not give any information about the trend. The indicator is well suited for finding divergence. The Ershov 38 Parrots indicator dynamically adjusts to the market and detects price movement impulses of medium and high amplitude. It almost does not rea
PZ Divergence Trading MT5
PZ TRADING SLU
3.75 (4)
Unlock hidden profits: accurate divergence trading for all markets Special Offer: Purchase now to receive free bonuses worth $159! (Read more for details) Tricky to find and scarce in frequency, divergences are one of the most reliable trading scenarios. This indicator finds and scans for regular and hidden divergences automatically using your favourite oscillator. [ Installation Guide | Update Guide | Troubleshooting | FAQ | All Products ] Easy to trade Finds regular and hidden divergences
PZ Day Trading MT5
PZ TRADING SLU
2.4 (5)
Effortless trading: non-repainting indicator for accurate price reversals Special Offer: Purchase now to receive free bonuses worth $159! (Read more for details) This indicator detects price reversals in a zig-zag fashion, using only price action analysis and a donchian channel. It has been specifically designed for short-term trading, without repainting or backpainting at all. It is a fantastic tool for shrewd traders aiming to increase the timing of their operations. [ Installation Guide | Up
SMCpro
Arief
5 (1)
Currently Price  20% OFF  ( for unlimited use ) Indicator   USER MANUAL , trade setups, solving issues, etc :  Direct Download Here     (  for users only  ) Hello World! Introducing.. SMCpro tool and Indicator for  MetaTrader 5 , a cutting-edge feature designed to revolutionize your trading experience. With innovative ICT Smart Money Concept, you gain unparalleled insight into market dynamics, empowering you to make informed trading decisions like never before. SMC Indicator built on th
Introducing the Power Trade Plus indicator designed by a small group of traders with a few years of experience trading the market profitably.  The Power Trade Plus is derived from the Power Trade indicator,  the indicator strive in powerful sniper entries and take profit levels,  with an algorithm that's can determine the markets volatility and Provides entries based on the current market volatility. This indicator is much more effective in stock ,currencies and indices.
How to use Pair Trading Station Pair Trading Station is recommended for H1 time frame and you can use it for any currency pairs. To generate buy and sell signal, follow few steps below to apply Pair Trading Station to your MetaTrader terminal. When you load Pair Trading Station on your chart, Pair Trading station will assess available historical data in your MetaTrader platforms for each currency pair. On your chart, the amount of historical data available will be displayed for each currency pai
VIP Buy Sell Signals
Hapu Arachchilage Tharindu Lakmal
Here is a Live DEMO testing account for the indicator. ( Profit proofs ) Login (MT5) - 100246 Server - FusionMarkets-Demo Investor PW - VIPindicator@2024 Contact me through this email aaddress to download the FREE strategy PDF for this indicator tharindu999lakmal@gmail.com Introduction   The   "Buy Sell Signals"   is designed to provide BUY and SELL trade signals based on the current market conditions.   A   Profitable   Trading Strategy   (Chee sheet)   is provided for this trading indicato
Go Way TREND
Ywsf Hsyn Hmad Alrsh
추세와 함께 가십시오. 네, 15분 프레임에 매수든 매도든 진입 신호를 기다리고, 30분 프레임에 신호가 나타나는지 확인하세요(때때로 신호가 나타나는 데 1시간 이상이 소요됩니다. 돌아올 수 있습니다) 15분 프레임으로 갔다가 30분 프레임으로 돌아가서 메인 시그널이 나타날 때까지 이를 반복합니다. 30분 프레임에 시그널이 나타나면 가격을 가지고 진입하여 선이 바뀔 때 수익을 얻습니다. , 이익이 기록되거나 반대 신호가 나타나는 경우 매우 간단하며 모든 주요 통화에서 작동합니다.  금속, 표시기, 모든 프레임이지만 가장 좋은 결과는 30분 프레임입니다. 항상 캔들 바닥 아래에 스톱로스를 설정하고 자본 관리를 초과해서는 안 됩니다. 자본금의 10% 추세와 함께 가십시오. 네, 15분 프레임에 매수든 매도든 진입 신호를 기다리고, 30분 프레임에 신호가 나타나는지 확인하세요(때때로 신호가 나타나는 데 1시간 이상이 소요됩니다. 돌아올 수 있습니다) 15분 프레임으로 갔다가 30분
Dinapoli Package MT5
Samil Bozuyuk
5 (2)
All in One package includes the  Oscillator Predictor ,  MACD Predictor ,  Thrust Scanner  and  Advanced Fibonacci  indicators which are mandatory for applying  Dinapoli  trade plans.  Please visit below links for detailed explanations of indicators. Advanced Fibonacci Indicator =>  https://www.mql5.com/en/market/product/107933 Thrust Scanner Indicator =>  https://www.mql5.com/en/market/product/52829 Overbought /Oversold Predictor indicator => https://www.mql5.com/en/market/product/52628 Macd
Contact us to receive a comprehensive user guide after purchasing. William Delbert Gann, commonly known as W.D. Gann, was an exceptional market analyst renowned for his unique trading style in the early 20th century.  His trading techniques were based on a blend of mathematics, geometry, astrology, and ancient mathematics. Gann believed that stock market movements followed specific patterns and cycles, rather than being random. His methodologies, celebrated for their accuracy and relevance, con
인공 지능을 기반으로 하는 이 지표는 발자국을 판독하여 가능한 시장 반전 지점을 식별하고 소규모 시장 움직임이 발생하기 전에 사전에 신호를 보냅니다. "늦은" 항목을 생성하는 가격 및 거래량 지표와 달리, 즉 방향 변경 시 가격이나 거래량이 이미 확인되어 움직임이 이미 종료된 경우, 이 지표는 "이동이 일어나야 할 때"라는 발자취를 남기고, 따라서 운동이 시작되는 즉시 시장에 진입할 수 있는 가능성을 제공합니다. 이는 반전 신호를 생성할 뿐만 아니라 이미 진행 중인 추세가 지속된다는 신호도 생성합니다. 지표는 인공 지능 덕분에 실제로 시장에서 체결된 계약을 각 수준별로 읽습니다(장부에서 실행 대기 중인 계약이 아니라 실행 직전에 알고트레이딩을 통해 제거됨). 이 지표는 입찰 및 요청으로 실행된 계약(따라서 본질적으로 수동 주문에서 공격적인 주문을 인식함), 시장에서 실행되는 빈도 및 공격성(따라서 대규모 운영자의 "밀기" 의도를 감지함)을 구별할 수 있습니다. 시장을 특정 방향
Fibonacci Suavizado
Cesar Juan Flores Navarro
Indicador en MQL5, que obtiene el promedio de 10 EMAS, que son alineadas según Fibonacci, obteniendo un promedio, que sera suavizado.  Se puede ingresar un numero desde 2 a N, que multiplica a los EMA-Fibonacci. Funciona en cualquier criptomoneda, etc. etc... pudiendo calcular el futuro segun la tendencia de las EMAS. Funciona excelentemente en tramos largos, determinando exactamente el mejor inicio/salida. El precio inicial por apertura sera por un periodo de tiempo, luego aumentará.
TREND HARMONY MT5 – Multi Timeframe Trend and Phase and Pullback Level Visualizer indicator for Metatrader5 The TREND HARMONY indicator automates deep trend analysis and generates visualizations for you. Take control of your trades by eliminating uncertainty! Revolutionize your trading experience with precision and insight through the TREND HARMONY Multi Timeframe indicator – your ultimate MT5 trend visualization indicator. [  Features and Manual   | MT4 version |   All Products   ] Are you t
제작자의 제품 더 보기
How many times have you looked for a PIVOT that works on a specific candle every day? Many traders like to estimate the direction of the day's trend based on a specific time each day, such as 30 minutes after the market opens, or at 12 noon, and so on. This indicator allows you to specify a certain time (hour and minute) and plots a pivot from that time to the next day at the same time. It shows five lines based on that specific candle/hour: median, maximum, minimum, support and resistance.
FREE
Keltner Enhanced
David Ben Svaiter
Keltner-Enhanced improves the accuracy and readability of Keltner Channels with many options for adjusting them and more five price calculations beyond the META default. The Keltner-E indicator is a banded indicator similar to Bollinger Bands and Moving Average Envelopes. They consist of an upper envelope above a midline and a lower envelope below the midline.  The main occurrences to look out for when using Keltner Channels are breakouts above the Upper Envelope or below the Lower Envelope
FREE
Jurik Advanced MA
David Ben Svaiter
The Jurik Advanced MA (JurMA) is a non-repaint technical indicator developed over the original JMA concepted by Mark Jurik.  It is designed to reduce lag present in traditional moving averages, improve smoothness, and reduce noise. JurMA adapts to market volatility and can be fine-tuned by the user for sensitivity, making it useful for identifying trends and reversals in financial markets. This adaptability and efficiency make it popular among traders and analysts. In the wide context of ot
HAshi-E is an enhanced way to analyze Heiken-Ashi signals. Briefing: Heiken-Ashi is particularly valued for its ability to filter out short-term volatility, making it a preferred tool for identifying and following trends, helps in decision-making regarding entry and exit points, and assists in distinguishing between false signals and genuine trend reversals. Unlike traditional candlestick charts, Heiken-Ashi candles are calculated using average values of previous bars, creating a smoother,
The Enhanced ADXW
David Ben Svaiter
Designed by Welles Wilder for daily commodity charts, the ADXW is now used in various markets by technical traders to assess the strength of a trend or even a trend for short- or long-term trades. The ADXW uses a positive (DI+) and negative (DI-) directional indicator in addition to its trend line (ADX). According to Wilder, a trend has strength when the ADX signal is above 25; the trend is weak (or the price has no trend) when the ADX is below 20. The absence of a trend does not mean that
On-Balance Volume (OBV) is a technical indicator that relates volume and price to identify price movements. The basic idea behind OBV is that changes in volume generally precede price changes. The indicator accumulates volumes for periods when the price closes higher and subtracts volumes for periods when the price closes lower. This results in a value used to identify the direction of the asset's trend. The interpretation of the OBV is simple: a rising OBV suggests that buyers are willing to
In the realm of technical analysis, ParbMA emerges as a highly intuitive tool for examining the Parabolic SAR trend . This innovative approach leverages a customizable line, distinguished by its versatility in color, shape, and width options. Such flexibility enhances visual analysis and significantly aids in strategizing and decision-making. The ParbMA (Parabolic Moving Average) is a custom technical indicator that combines the concepts of J. Welles Wilder's Parabolic SAR (Stop and Reverse)
Slow AMA
David Ben Svaiter
Compared to simple or exponential moving averages, slow adaptive trend lines might offer a more nuanced view of the trend by adjusting their sensitivity based on market conditions. However, their slow nature might also mean they are late in signaling reversals when market conditions change rapidly - and that is the difference between them and our SlowAMA . SlowAMA was designed to be a better long-term trend indicator than EMA and other Moving Averages. It uses our JurMA calculations, reducing
HAshi-E is an enhanced way to analyze Heiken-Ashi signals. Briefing: Heiken-Ashi is particularly valued for its ability to filter out short-term volatility, making it a preferred tool for identifying and following trends, helps in decision-making regarding entry and exit points, and assists in distinguishing between false signals and genuine trend reversals. Unlike traditional candlestick charts, Heiken-Ashi candles are calculated using average values of previous bars, creating a smoother,
Pivot on Day Range
David Ben Svaiter
How many times have you looked for a PIVOT that works on a specific timeframe every day? Many traders like to estimate the direction of the day's trend based on a specific time interval every day, such as from 2 hours before the NYSE opens to 1 hour after, or from the NYSE opens to 30 minutes after. This indicator allows you to specify a certain time interval (hour and minute) and plots a pivot from that interval to the next day in the same time interval. It shows five lines based on this:
VIDYA Enhanced
David Ben Svaiter
The VIDYA-ENHANCED indicator (Variable Index Dynamic Average) is a technical analysis tool used to identify trends and sideways movements. It dynamically adjusts its sensitivity based on market volatility, using the Chande Momentum Oscillator as a volatility index. This feature allows VIDYA-ENHANCED to be more agile during periods of significant price movements, while remaining more stable during less volatile phases.  Features: - Select the price from 12 options - 5 more than the Metatra
필터:
리뷰 없음
리뷰 답변
버전 3.92 2024.02.16
- minor bugs fix.
버전 3.91 2024.02.16
- Addition of new "minimize" and "restore" buttons to the text panel.
- The text information now appears in the same order, regardless of which corner the panel is placed in.
- The text panel now works with the TIMER event, reducing the CPU load related to it.
- Improved DPI handling for 4K and 8K monitors.
- Fixed an intermittent problem with the numeric values on candle 0.
- Fixed the EMPTY_VALUE display on the dashboard.
버전 3.9 2024.02.15
- Added new "minimize" and "restore" buttons to the text dashboard.
- Text information now appears in the same order, regardless of the corner where the dashboard will be placed.
- Text dashboard now works with the TIMER event, reducing the CPU load related to it.
- Enhanced the DPI handling for 4K and 8K monitors.
- Fixed an intermittent problem with the numerical values on candle 0.
버전 3.4 2024.01.24
- Performance optimized in 10%.