Volatility Master MT5
- 지표
- INTRAQUOTES
- 버전: 1.6
- 업데이트됨: 24 3월 2025
- 활성화: 5
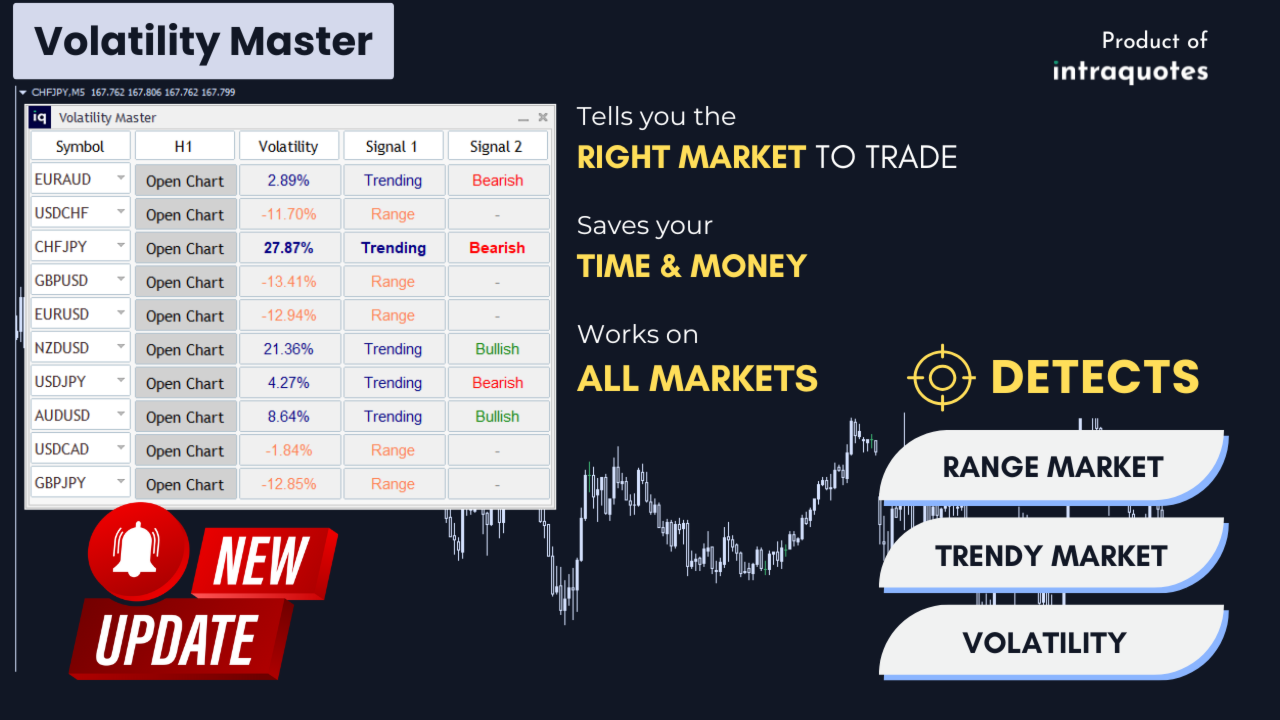
Volatility Master for MetaTrader is a real-time dashboard tool that scans up to 30 symbols to identify high-volatility, trending markets instantly. With clear bullish/bearish signals, customizable alerts, and a user-friendly interface, it helps you avoid range-bound conditions and focus on high-probability trades. Clarity leads to confidence. This is your chance to trade confidently and protect your capital effectively, don't miss the opportunity that you might regret later!
- Download Metatrader 4 Version.
- Message us here for the indicator manual after you purchase.
- Get it NOW - the price will increase after the next 10 purchases.
Read the product description carefully before purchasing the product.
Disclaimer:
• Due to regulatory restrictions, our service is unavailable in certain countries such as India, Pakistan, and Bangladesh.
• We do not sell any of the Intraquotes products on Telegram or any other platform or website.
• We never contact anyone or sell our products privately, or provide any personal trading advice.
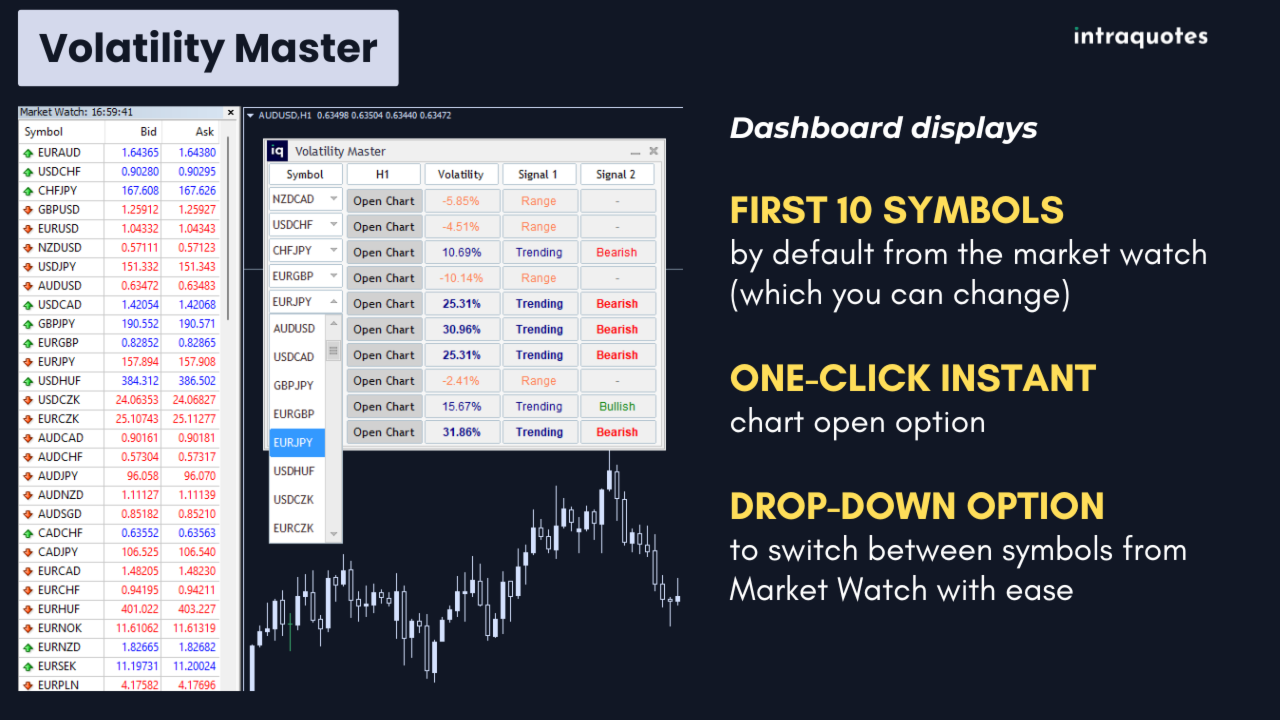
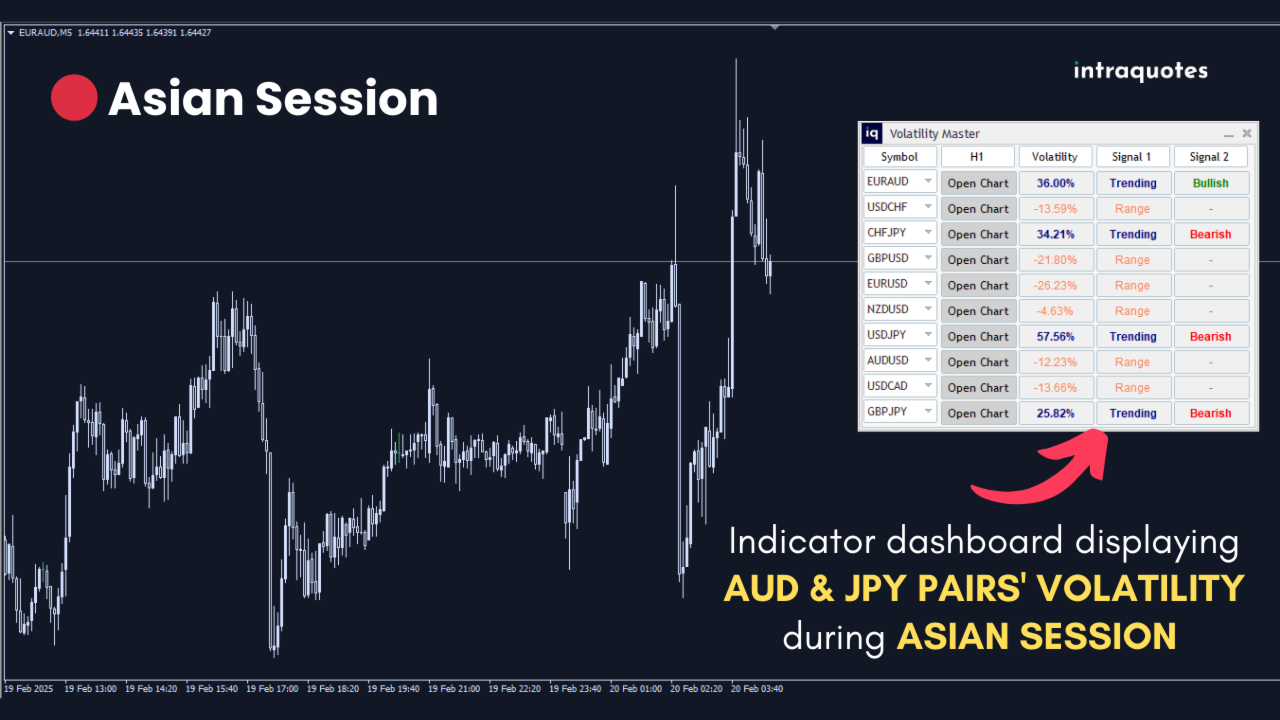
- Indicator Dashboards - Get live signal of 10 trading assets' volatility at a glance.
- Customizable Symbols – Easily switch between assets from Market Watch using indicator dashboard's drop-down menu.
- Timeframe Flexibility – Analyze market trends using H1 (default), H4, or D1 timeframes.
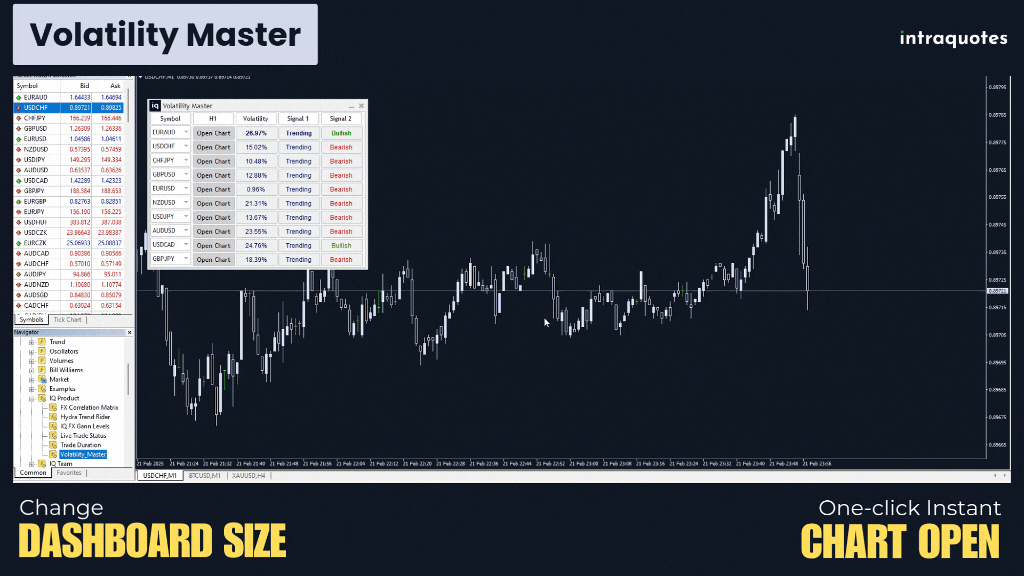
- Dashboard Resizing – Optimized for SD, HD, Full HD, and 4K screens.
- User-Friendly Design – Move or minimize the dashboard for a clutter-free chart.
- 5 PC Activation – Use the indicator across 5 PCs with multiple brokers for a seamless trading experience.
-
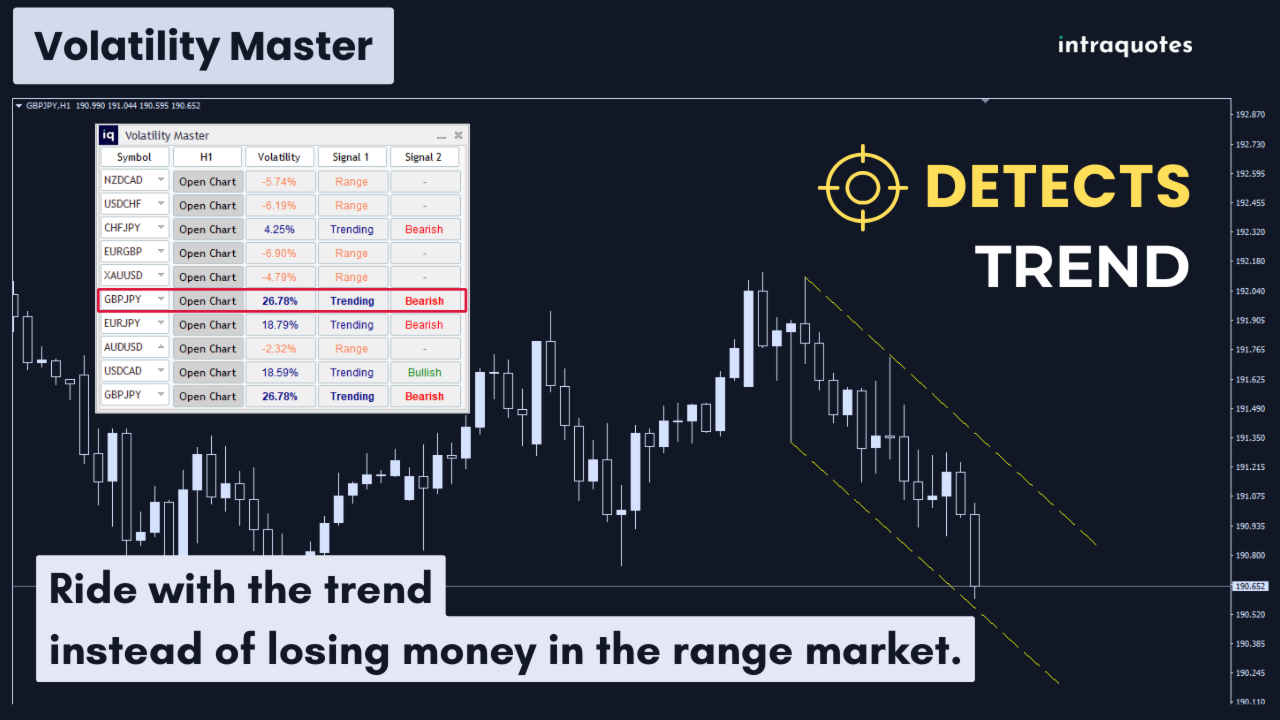
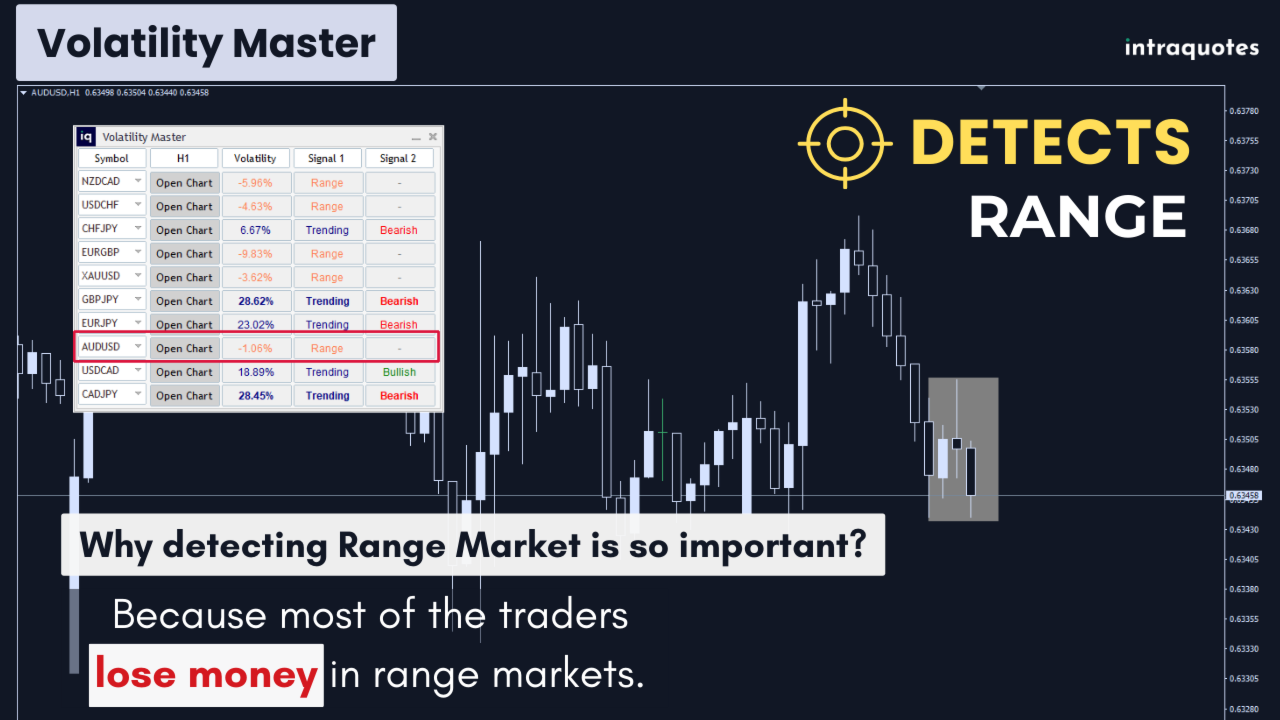
Identifies High Volatility Markets:
Avoid range-bound trading and enter only strong trending markets. -
Instant Trade Decision Support:
Get real-time signals indicating whether the market is bullish, bearish, or ranging, and not just whether it is volatile or not. -
Saves Time and Effort:
The dashboard consolidates crucial volatility data, reducing analysis time.
If you want to learn more about how this indicator works and how you can take profitable trades, follow our intraquotes official MQL5 channel. We post market-analysis using our powerful indicators to train traders how to study the chart with indicators, where to set targets, and how to take profitable trades. We help you build your confidence with daily market analysis using our indicator so that you can trade without any fear.
Subscribe to intraquotes MQL5 channel for daily market updates, analysis, and much more.
Volatility Master is a perfect tool if you are looking to avoid getting stuck in low-volatile markets and focus on trending assets only. Whether you are a scalper, intraday trader, or swing trader, this tool helps identify high-probability trade opportunities in just one glance.
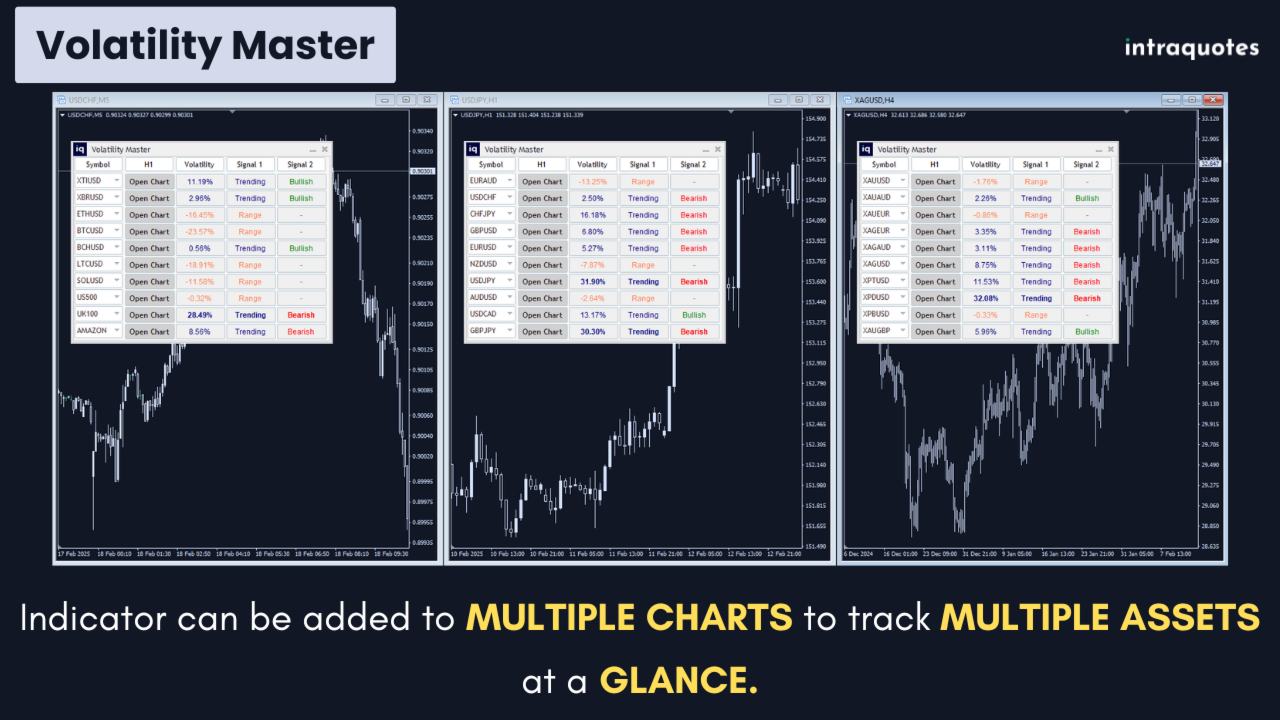
4. Supported Symbols & Timeframes
Volatility Master Dashboard shows any symbol that is in the Market Watch list. Dashboard supports all major trading assets, including forex (major & minor pairs), metals, indices, cryptocurrencies, oil, and more. Volatility of 3 timeframes are supported that can be changed from the input settings as per your choice- H1, H4, and D1.
You can use up to 3 indicator dashboards across 3 separate charts at a time, to monitor up to 30 symbols simultaneously.
-
After purchasing, open MetaTrader Software, log in to your account, and open Toolbox - Market - Purchased.
-
Install the indicator.
-
Open Navigator - Market - Drag & drop the indicator to the chart.
-
Follow the volatility dashboard for live market signals for confident trading.
7. How do Volatility Master Work?
Monitors Market Volatility
• Analyzes symbols in real time to detect strong trends.
Drop-down Symbol List
• To switch between multiple assets from the Market Watch list with ease.
Provides Actionable Signals (Signal 1)
• Clearly indicates whether a market is trending or ranging.
Shows Bullish or Bearish Trends (Signal 2)
• Helps you enter trades with confidence.
One-Click Chart Navigation
• Instantly switch to high-volatility assets.
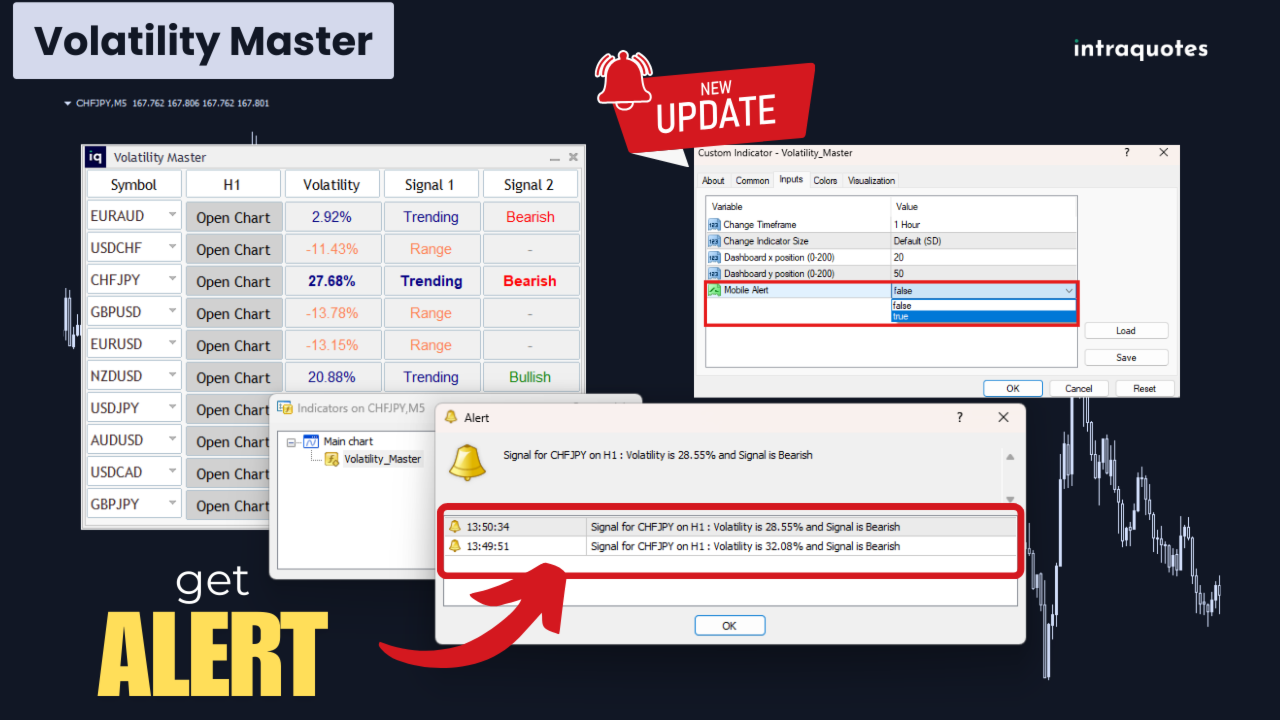
Customizable Alerts
• Get notified when market conditions meet your strategy.
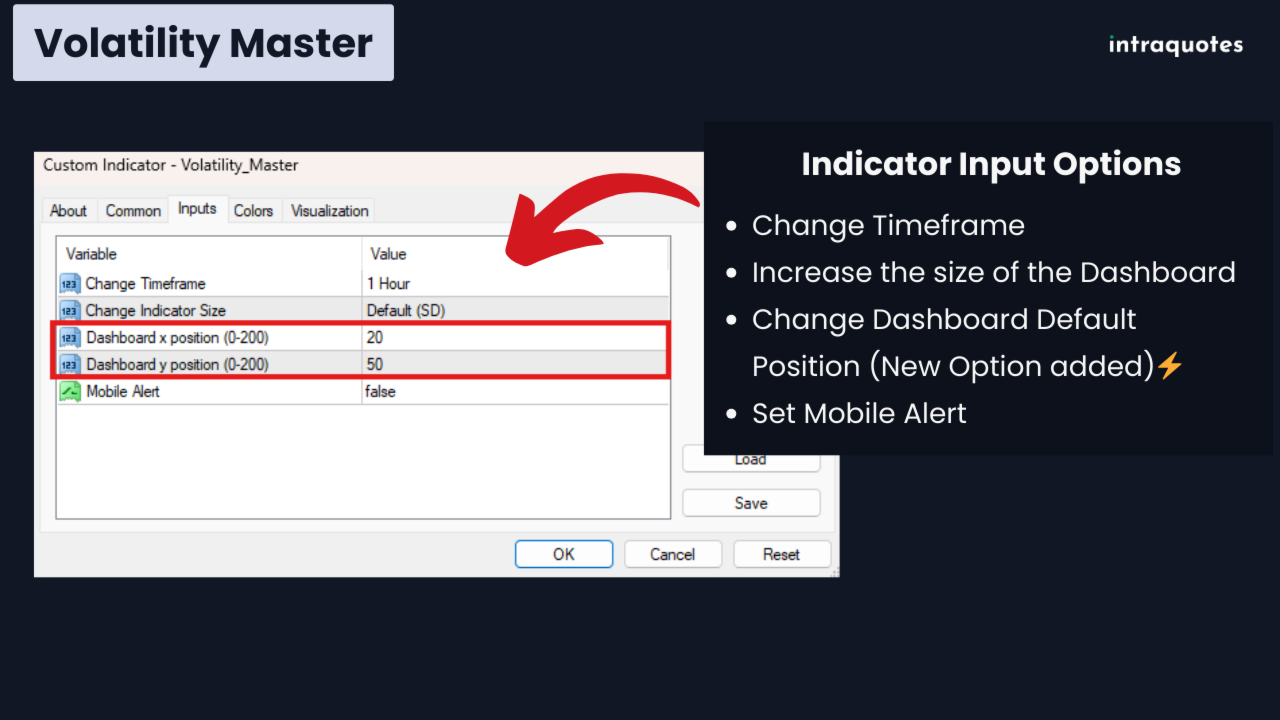
8. Indicator Settings
Customize Volatility Master as per your preference:
Timeframe Selection
• Switch between H1, H4, and D1 based on your trading strategy.
Dashboard Positioning
• Set default X/Y coordinates for a consistent dashboard layout.
Resizable Dashboard
• Adjust for any screen resolution among the options: Default (SD), 125% (HD), 150% (Full HD), 200% (4K).
Mobile Alerts
• Enable/Disable Mobile Alert (Options: True/False) for instant trade alerts.
Move & Minimize Option
• Customize display preferences for an optimized chart experience.
9. Note for Mobile Alert
To receive mobile alerts for this indicator, enable push notifications in MetaTrader 5 by pressing Ctrl + O (or accessing Options) and navigating to the Notifications tab. Enter your MetaQuotes ID from the MetaTrader app on your mobile device to link it with your platform. Once connected, test the setup to ensure alerts are working. If you face any issues, contact our support team for assistance through MQL5 inbox message.
10. Indicator Troubleshooting
The user guide covers all the topics comprehensively. Inbox us on MQL5 after you purchase the indicator successfully.
- For assistance, send us a direct message on MQL5.
- Follow our channel for updates and market insights.
- If you encounter any technical issues with the indicator, contact us directly on MQL5.
Stop wasting time and money in low-volatile markets and start trading with confidence in good trendy markets! Volatility Master is the ultimate tool for identifying high-probability opportunities, saving you from frustrating range-bound conditions. With real-time signals, customizable settings, and a user-friendly dashboard, this indicator gives you the edge to trade smarter and more efficiently. Upgrade your trading game today—get Volatility Master now!
Good Luck and Happy Trading!
Risk Disclosure:
Trading financial markets carry inherent risks and may not be suitable for every investor. This indicator is designed as a tool to assist in trading decisions but does not guarantee profits or prevent losses, which could exceed your initial investment. Past performance is not a reliable indicator of future outcomes. Users are encouraged to fully understand the risks and seek independent financial advice if needed. Any trading decisions made using this indicator are at the user's discretion and responsibility.
Related Topics: Trend Analysis, Average True Range Trading Strategy, Volatility strategy, trend following, forex, multiple currency pairs analysis, volatility, forex market volatility, volatility calculator, market volatility dashboard, volatility scanner, trending symbols, bullish bearish signal, volatility percentage, multiple currency volatility, volatility dashboard, live volatility scanner, scan volatile symbols, scan volatile currencies