TrendLine Auto Executor MT4
- 유틸리티
- Alessandro Bertoli
- 버전: 1.0
- 활성화: 10
ATTENTION: the utility cannot work in the Strategy Tester, if you want to try the demo version for free for a week, or have any questions, write me an email! You can find my address on my user profile.
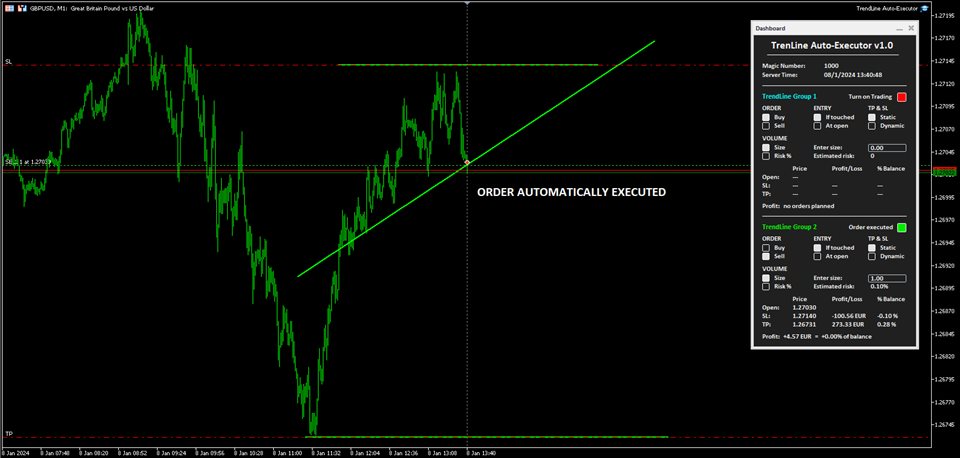
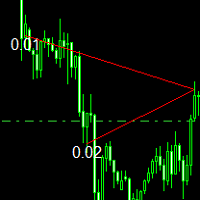
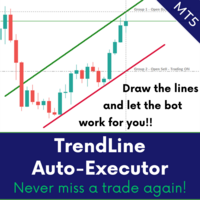
TrendLine Auto Executor is a software capable of identifying the trendlines you have drawn on the chart and opening orders as soon as they are touched or exceeded.
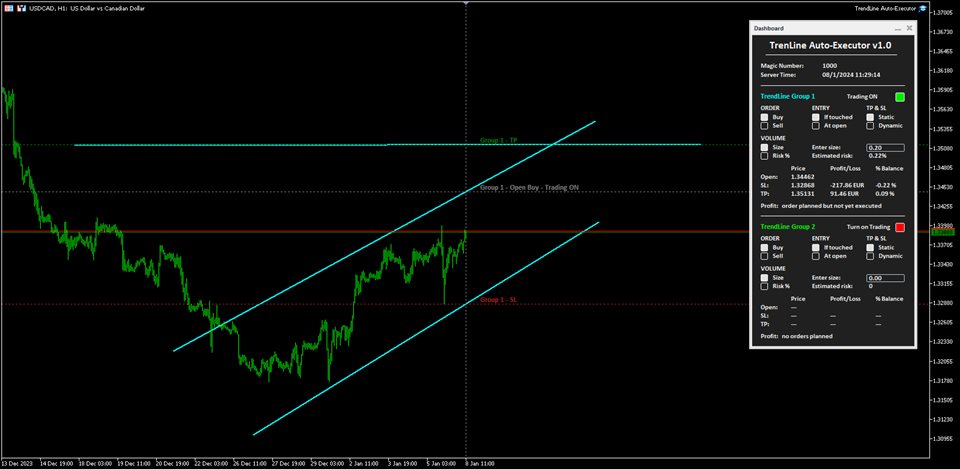
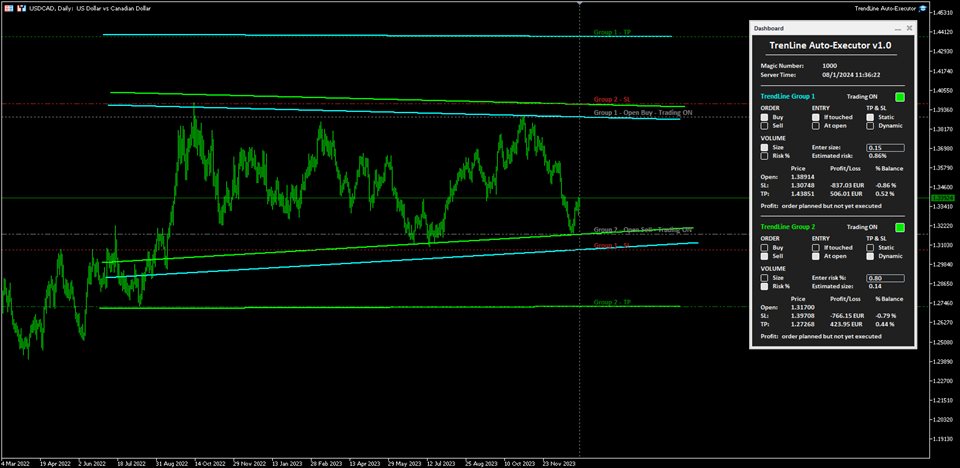
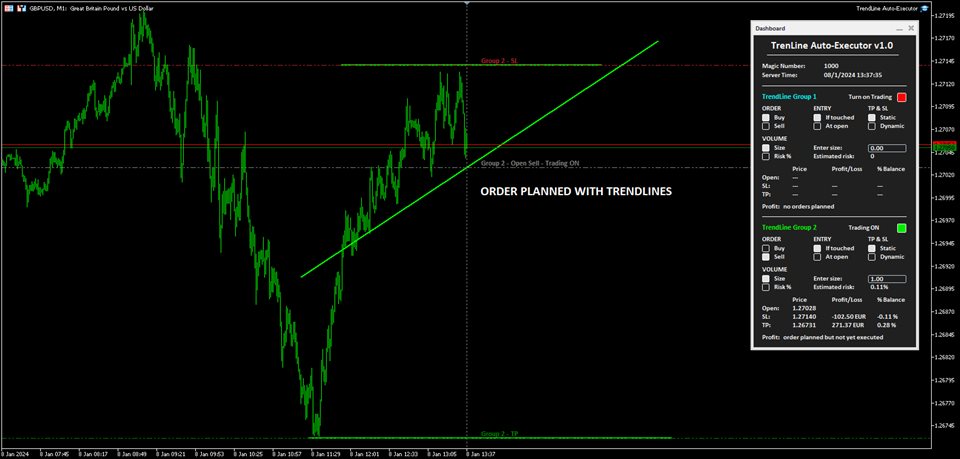
The software allows you to manage two orders at a time for each chart by tracking two groups of trendlines, one for each order, and each order is defined by tracking 3 lines:
- the first trendline drawn identifies the opening price of the order
- the second trendline (optional) identifies the price at which to place the stop loss
- the third trendline (optional) identifies the price at which to place the take profit
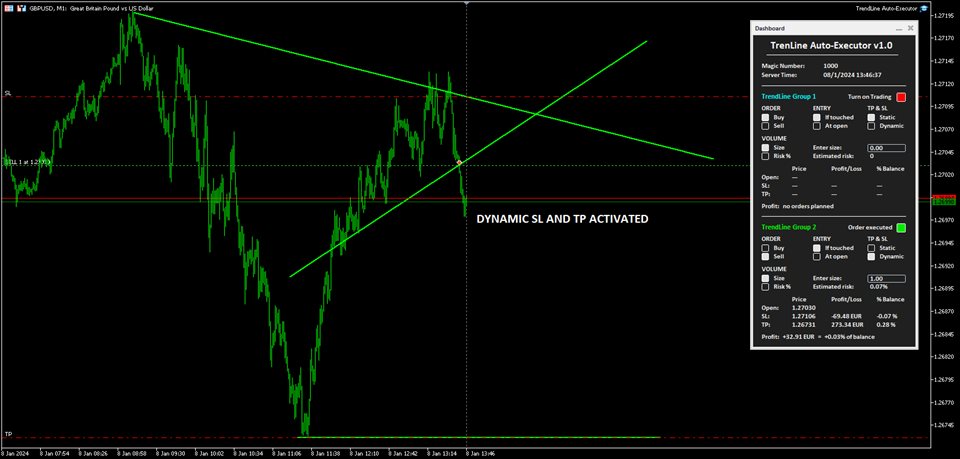
Once the trendlines have been drawn, TrendLine Auto Executor automatically updates, candle after candle, the opening, take profit and stop loss prices following the inclination of the lines, until the order is opened.
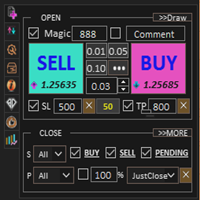
Everything is managed via a simple and practical control panel (dashboard) present on the price graph which allows you to set the type and size of the order.
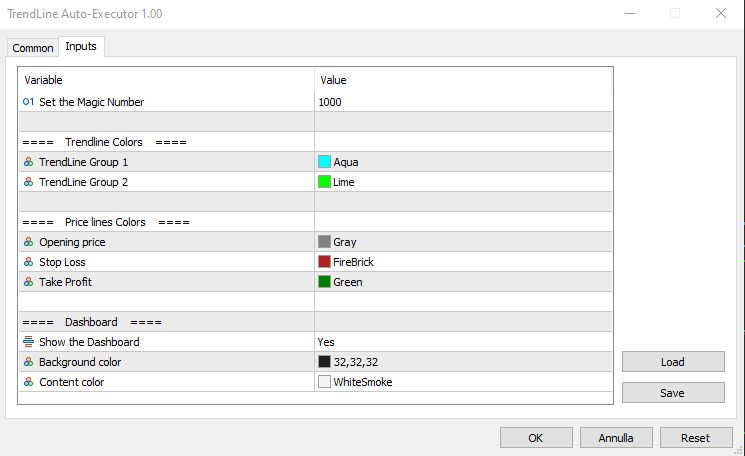
Input parameters:
Set the Magic Number: allows you to set the bot's magic number
Trendline Colors
- TrendLine Group 1: allows you to set the color of the trendlines of group 1
- TrendLine Group 2: allows you to set the color of the trendlines of group 2
Price lines Colors
- Opening price: allows you to set the color of the horizontal line automatically drawn on the graph that identifies the opening price of the order
- Stop Loss: allows you to set the color of the horizontal line automatically drawn on the graph that identifies the stop loss
- Take Profit: allows you to set the color of the horizontal line automatically drawn on the graph that identifies the take profit
Dashboard
- Show the Dashboard: Select Yes to display the dashboard, No to hide it
- Background color: allows you to set the background color of the dashboard
- Content color: allows you to set the color of all elements within the dashboard
Dashboard
The dashboard allows you to define the type of order you wish to open in a very simple way, using the various buttons. Each part of it is described below.
- Magic number: indicates the magic number assigned when setting the parameters.
- Server Time: i ndicates the current server time.
- TrendLine Group 1 (and Trendline Group 2): indicates the area within the dashboard dedicated to group 1, or group 2, of trendlines. The color of the writing recalls the one set for the trendline group when setting the parameters.
- Turn on Trading: by clicking on the red button you can activate trading and open orders (the button turns green and the writing shows “Trading ON”).
- ORDER (the two buttons allow you to set the type of order)
- Buy: to set the automatic opening of a buy order.
- Sell: to set the automatic opening of a sell order.
- ENTRY (the two buttons allow you to set the type of entry)
- If touched: the order will be executed as soon as the price touches the trendline.
- At open: the order will be executed when a new candle opens. If Buy has been set, the new candle must open above the trendline, while the opening of the previous one must be below. In the case of a Sell order, the new candle must open below the trendline, while the opening of the previous candle must be above.
- TP & SL (the two buttons allow you to set how to manage the take profit and stop loss once the order has been opened)
- Static: once the market order is opened, the TP and SL (if present) will remain unchanged.
- Dynamic: once the market order has been opened, the TP and SL (if present) will follow the trendlines drawn, assuming the same values, furthermore by manually moving the trendlines it is possible to also move the TP and SL.
- VOLUME (the two buttons allow you to set the volume of the operation)
- Size: the volume is set by defining the number of lots or contracts. The value must be entered in the field alongside indicated by the words “Enter size:”. The estimated percentage risk in relation to the Balance is indicated just below (the Stop Loss line must have been drawn).
- Risk%: the volume is set by defining the percentage risk compared to the Balance. The value must be entered in the field alongside indicated by the writing “Enter risk %:”. The estimated size for opening the order is indicated just below (the Stop Loss line must have been drawn to calculate the size and therefore open the order).
- The table at the bottom indicates the prices, the monetary profit and in percentage of the Balance, both of the order not yet placed based on where the trendlines have been positioned, and of the market order once opened by the software.
- Finally, the word Profit positioned at the bottom shows the indication:
- “no orders planned”, if no trendlines are drawn on the graph and therefore no order has been planned
- “order planned but not yet executed” , if trendlines are drawn but the order has not yet been executed
- The monetary profit and the profit compared to the balance, if the order has been executed and is at market
Notes for correct use:
- The software is developed to only recognize trendlines of the color specified when setting the parameters, other types of lines and other colors are not taken into consideration.
- To be identified and recognized, trendlines must be traced up to the current candlestick, otherwise it is as if they were not present.
- To define an order it is necessary to draw at least one trendline to identify the opening price.
- If you set the At open option as ENTRY, the order will open according to the set chart timeframe.
- Once the order is closed (manually, for take profit or stop loss) the bot disables trading by returning the "Turn on Trading" button to the red color and the size to zero. The trendlines still remain positioned on the chart so you can reuse them to plan new orders.
- Once the trendlines have been drawn, the software automatically draws horizontal lines that indicate the opening price of the order and, if indicated, the prices at which to place the stop loss and take profit.
- The buttons and writings on the dashboard update their status with each new tick of the market, in phases of low liquidity there may be some delay in the response of the buttons.

