• 미리보기
  • 리뷰
  • 코멘트
  • 새 소식

MACD Bands

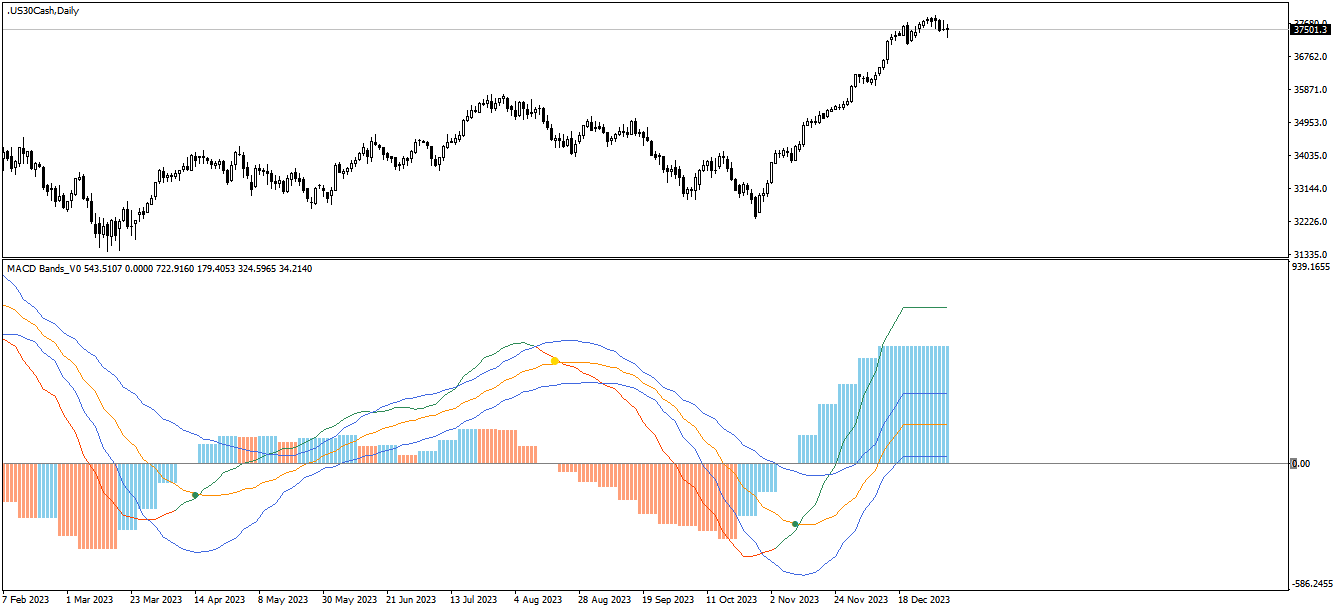
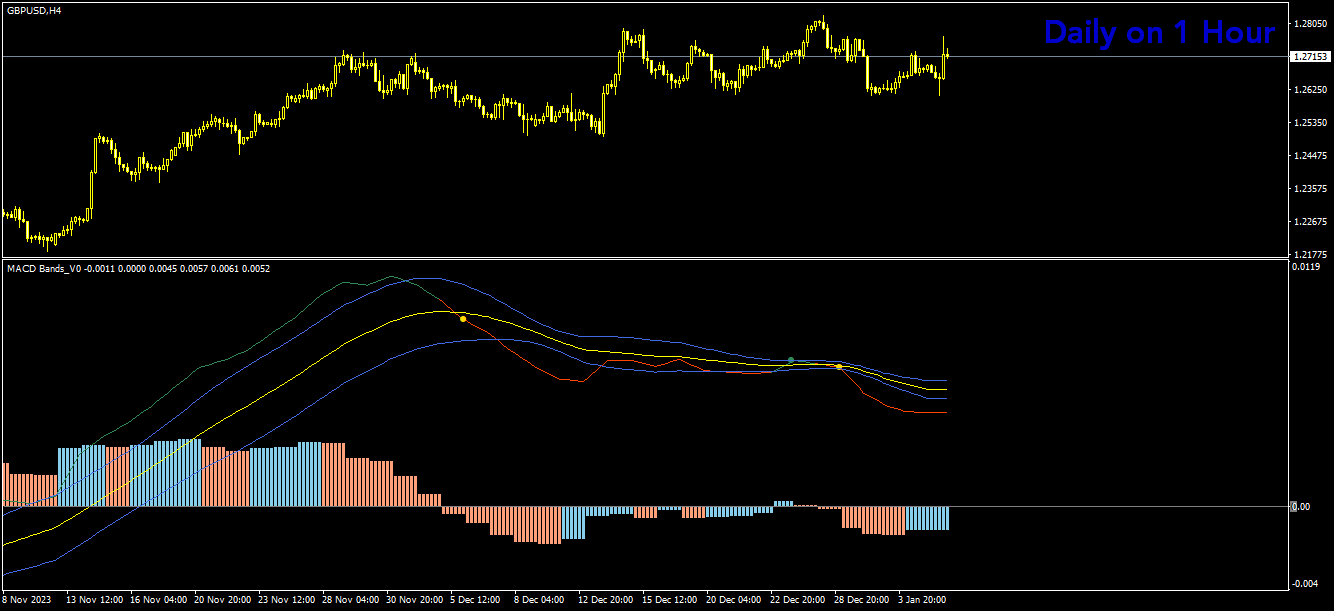
제품은 다른 플랫폼에서 변환된 것이며 TradeMaster Lite에서 만든 원본입니다. 인디케이터는 기본적으로 MACD 개념을 사용하지만 다양한 유형의 평균화 기법을 통해 그 능력을 발휘합니다. 추세 및 반전 식별에 강력합니다. 

다음은 원래 소유자의 세부 정보입니다:

다음과 같은 기능을 갖춘 사용자 정의 가능한 MACD 지표를 제공합니다:
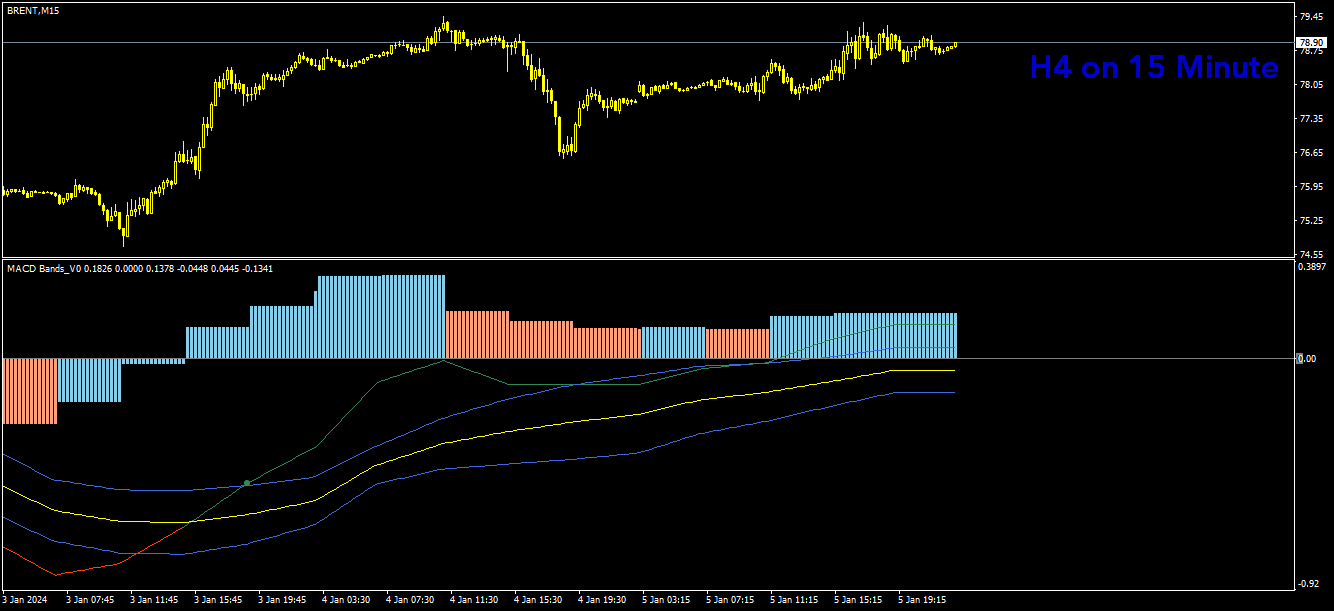
멀티 타임프레임
비정상적인 변동성을 파악하기 위한 편차 밴드
9가지 이동평균 유형
조건부 색상 및 선 교차
👉비정상적인 변동성을 파악하는 편차 밴드:
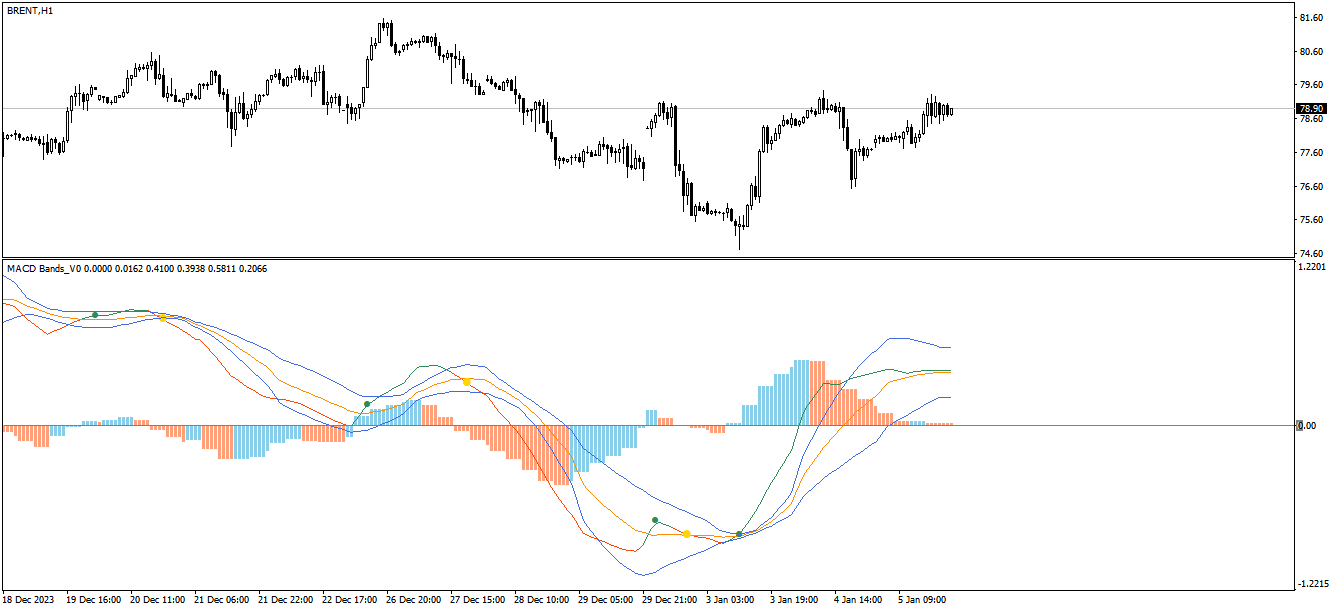
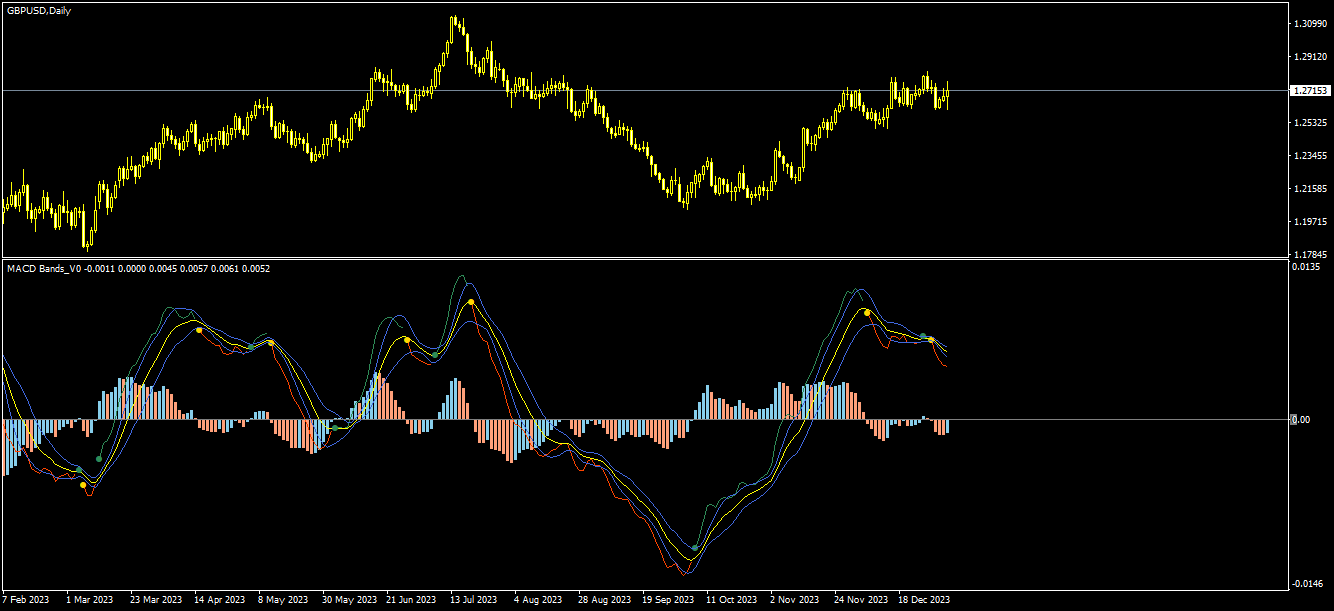
편차 밴드는 신호선 주위에 표시되어 비정상적인 변동성 기간을 식별하는 데 도움이 될 수 있습니다. MACD 선이 편차 밴드를 벗어나면 시장 변동성이 커지고 있으며 해당 방향으로 강한 추세가 형성될 수 있음을 나타냅니다.

스크립트에서 9가지 이동평균 유형을 사용할 수 있습니다. 각 이동평균 유형은 고유한 관점을 제공하며 다양한 시나리오에서 시장 추세를 파악하는 데 사용할 수 있습니다.
SMA(단순이동평균): 선택한 값 범위의 평균을 해당 범위의 기간 수로 계산합니다.
SMMA(평활이동평균): 사용 가능한 모든 데이터를 고려하여 값에 동일한 가중치를 할당합니다.
EMA(지수 이동 평균): 가장 최근의 데이터 포인트에 더 큰 가중치와 중요성을 부여합니다.
DEMA(이중 지수 이동 평균): 데이터 포인트의 지연을 줄이기 위해 독점적인 계산을 사용하는 더 빠르게 움직이는 평균입니다.
TEMA(삼중 지수 이동 평균): 이평선보다 훨씬 빠르므로 트레이더가 추세 변화에 더 빨리 대응할 수 있습니다.
LSMA(최소제곱이동평균): 이 이동 평균은 최소 제곱 회귀 방법을 적용하여 추세의 미래 방향을 결정합니다.
HMA(선형 이동평균): 이 이동평균은 지연을 줄이고 부드러움을 개선하여 단기 시장 움직임에 대한 더 빠른 신호를 제공하도록 설계되었습니다.
VWMA(거래량 가중 이동평균): 거래량이 많은 캔들에 더 많은 가중치를 부여하여 거래량이 많은 기간에 실제 평균값을 더 정확하게 반영합니다.
WMA(가중이동평균): 이는 최신 데이터에 더 많은 가중치를 부여하지만 EMA만큼은 아닙니다.

👉조건부 컬러링:
이 기능은 MACD 선의 방향에 따라 색상을 지정하고 MACD 선과 편차 밴드 가장자리 사이의 영역을 채워 잠재적 변동성과 모멘텀의 강도를 강조합니다. 이는 시장이 강한 추세일 때와 중립적이거나 고르지 못한 상태일 때를 식별하는 데 유용할 수 있습니다.

👉MACD 라인 - 신호 라인 교차:
이는 MACD 선이 신호선 위 또는 아래를 교차할 때 발생하는 전형적인 MACD 거래 신호입니다. 크로스오버는 잠재적인 추세 반전을 식별하는 데 사용할 수 있습니다. 크로스오버의 방향에 따라 강세 또는 약세 신호가 될 수 있습니다.


👉일반적 조언

다른 보조지표와 신호 확인:
모든 기술적 지표와 마찬가지로 지지선 및 저항선과 같은 다른 분석 도구와 RSI, MACD, 거래량과 같은 지표로 잠재적 신호를 확인하는 것이 중요합니다. 이는 성공적인 거래 확률을 높이는 데 도움이 됩니다.

적절한 위험 관리를 사용하세요:
이 지표 또는 다른 지표를 사용할 때는 적절한 위험 관리를 하는 것이 중요합니다. 손절가 설정과 신중한 포지션 규모 설정을 고려하세요.

다른 보조지표와 결합:
이 보조지표는 다른 보조지표와 함께 사용하면 종합적인 트레이딩 전략을 세우고 추가 확인을 위해 효과적으로 사용할 수 있습니다.

유의사항:
트레이딩 결정을 내리기 전에 철저한 리서치와 백테스팅은 필수입니다. 또한 보조지표와 보조지표의 동작을 확실히 이해하는 것이 중요합니다. 또한 펀더멘털 분석을 통합하고 시장 심리를 고려하는 것도 트레이딩 접근 방식에서 고려해야 할 중요한 요소가 될 수 있습니다.

한계:
이 지표는 후행 지표입니다. 이 지표는 후행 지표인 이동 평균을 사용한다는 점에 유의하십시오.
TradeMaster Lite 패키지의 보조지표는 원래 목적과 가치를 유지하면서 단순성과 효율성을 목표로 합니다. 일부 설정, 기능 또는 비주얼은 예상보다 단순할 수 있습니다.
추천 제품
To get access to MT5 version please click here . - This is the exact conversion from TradingView: "Stochastic Momentum Index" By "UCSgears". - This is a popular version of stochastic oscillator on tradingview. - This is a light-load processing and non-repaint indicator. - Buffers are available for the lines on chart. - You can message in private chat for further changes you need. Thanks for downloading
The Bollinger Band is a strategy that has become one of the most useful tools for spotlighting extreme short-term price moves. Bollinger Bands consist of a centerline and two price channels or bands above and below it. The centerline is typically a   simple moving average   while the price channels are the standard deviations of the stock being studied. The bands expand and contract as the   price action   of an issue becomes volatile (expansion) or becomes bound into a tight trading pattern (c
Trend Impulse Scanner
Mehmet Ozhan Hastaoglu
Provides maximum revenue from trends. You can receive signals from Zigzag, Front Fibonacci Retracement, Back Fibonacci Retracement and Stochastic Oscillator indicators. You can run these indicators in the background. It will give you a warning at the levels you set. You can change all levels from the settings. Designed to help you get the most out of trends. Fibo Level : 38.2 / 61.8 / 76.4 Stochastic : 20 / 80
이 인디케이터는 수동 및 자동 방법으로 차트에 그려진 조화 패턴을 감지합니다. 사용 후기를 추가하십시오. 참고 사항: 이 인디케이터에는 제어 패널이 있으며 모든 (차트 및 시간대) 설정을 저장합니다. 더 많은 공간을 확보하려면 최소화할 수 있으며 다른 분석 도구와 함께 작업하려면 모든 인디케이터 데이터를 숨기려면 닫기 버튼을 누를 수 있습니다. 이 인디케이터를 사용하고 설정을 변경하면 이동평균이나 볼린저 밴드와 같은 인디케이터를 추가할 때 편집 내용의 템플릿을 자동으로 저장하고 필요할 때 언제든지 로드할 수 있습니다. Windows 10을 사용하는 경우 MetaTrader 아이콘을 마우스 오른쪽 단추로 클릭한 다음 호환성 > 고DPI 설정 변경 > 시스템(개선)을 선택하여 최상의 화면 설정을 사용할 수 있습니다(HD 기기에서 수행되어야 함). 이 인디케이터는 본질적으로 차트에서 조화 거래 이론을 해석하는 것으로 조화 패턴을 감지합니다. 배우고 싶다면 Scott Carney의 "Har
This product is a part of  ON Trade Waves Patterns Harmonic Elliot Wolfe you can test free version on EURJPY from this link  Wolf Waves Indicator 울프 웨이브(Wolf Waves) 발견하기 - 귀하의 궁극적인 거래 도구! 어떤 시간 프레임에서든 울프 웨이브를 쉽게 찾을 수 있는 강력한 도구를 찾고 계신가요? 더 이상 찾을 필요가 없습니다! 저희의 울프 웨이브 인디케이터는 이 작업을 쉽게 해내며, 여기서 왜 귀하에게 완벽한지 설명하겠습니다: 주요 기능: 자동 감지: 우리의 울프 웨이브 인디케이터는 복잡한 알고리즘을 사용하여 키 포인트를 자동으로 찾아 차트에 해당 선을 그립니다. 수동으로 패턴을 찾아 다니는 번거로움을 이제 더 이상 느낄 필요가 없습니다. 사용자 친화성: 이 인디케이터는 사용하기 간단하게 설계되어 있어 경험이 풍부한 트레이더든 울프 웨이브에 처음 접하
YK Fibo Pivot Indicator
Peechanat Chatsermsak
YK-Fibo Pivot Indicator: Trade Smarter with Fibonacci Pivot Points The YK-Fibo Pivot Indicator is a powerful technical analysis tool that combines the precision of Fibonacci retracements with the insights of Pivot Points. Whether you're a novice or seasoned trader, this indicator empowers you to spot profitable opportunities in the market with ease. Why Choose YK-Fibo Pivot? Pinpoint Support & Resistance: By calculating Fibonacci levels based on the previous day's high, low, and close prices, y
Real Magic Trend
Muhammed Emin Ugur
This   Real Magic Trend   indicator is designed for signal trading. This indicator generates trend signals. It uses many algorithms and indicators to generate this signal. It tries to generate signals from the points with the highest trend potential. This indicator is a complete trading product. This indicator does not need any additional indicators. The indicator is never repainted. The point at which the signal is given does not change.      Features and Recommendations Time Frame
Classic Fractals indicator for MT4, with additional Trendlines connecting the latest couples of fractals ( fractals are showing highest high, and lowest low on each period) Rules for trendlines: -if new top fractal is below the last one = new resistance line -if new bot fractal is above the last one = new support line -Trendlines can be hidden -Fractals can be hidden Fractal Period = can be both even or uneven number, as it is setting for half (one side) of the bars sequence
To download MT5 version please click here . This is the exact conversion from TradingView: "B-Xtrender" By "QuantTherapy". - It is an oscillator based on RSI and multiple layers of moving averages. -   It is a two in one indicator to calculate overbought and oversold zones for different RSI settings. -  This indicator lets you read the buffers for all data on the window. - This is a non-repaint and light processing load indicator. - You can message in private chat for further changes you need.
To get access to MT5 version please click here . This is the exact conversion from TradingView: "[SHK] Schaff Trend Cycle (STC)" by "shayankm". This is a light-load processing indicator. This is a non-repaint indicator. Buffers are available for processing in EAs. All input fields are available. You can message in private chat for further changes you need. Thanks for downloading
Fibonacci retracement and extension line drawing tool Fibonacci retracement and extended line drawing tool for MT4 platform is suitable for traders who use  golden section trading Advantages: There is no extra line, no too long line, and it is easy to observe and find trading opportunities Trial version: https://www.mql5.com/zh/market/product/35884 Main functions: 1. Multiple groups of Fibonacci turns can be drawn directly, and the relationship between important turning points
The   Strategy Tester   product is an indicator where you can both test and run strategies. There are 64 strategies in total in this indicator. It uses 3 indicators. You can test tens of thousands of strategies by changing the parameter settings of these indicators. You can run 6 strategies at the same time. With this product, you will now create your own signals. Recommendations and Features Used indicators:   Rsi, Bears power, Stochastic It works on all   time frame   Recommended time frame
Master scalping M1
Nataliia Marchuk
Master Scalping M1 is an innovative indicator that uses an algorithm to quickly and accurately determine the trend.The indicator calculates the time of opening and closing positions, the indicator's algorithms allow you to find the ideal moments to enter a deal (buy or sell an asset), which increase the success of transactions for most traders. Benefits of the indicator: Easy to assemble, does not overload the chart with unnecessary information. Can be used as a filter for any strategy. Works on
Real Pro Signal
Muhammed Emin Ugur
Real Pro Signal   indicator is designed for signal trading. This indicator generates trend signals. It uses many algorithms and indicators to generate this signal. It tries to generate a signal from the points with the highest trend potential. This indicator is a complete trading product. This indicator does not need any additional indicators. The indicator certainly does not repaint. The point at which the signal is given does not change.     Features and Suggestions Time Frame: H1 W
The Strategy Tester product is an indicator where you can both test and run strategies. There are 64 strategies in total in this indicator. It uses 3 indicators. You can test tens of thousands of strategies by changing the parameter settings of these indicators. You can run 6 strategies at the same time. With this product, you will now create your own signals. Recommendations and Features Used indicators: Stochastic, Macd, Williams Percent Range It works on all time frame   Recommended time f
Murrey Math Multi Timeframe Indicator Support/Resistance  Murrey Math Lines are strong tools to plot the support and resistance levels. Murrey Math Multi Timeframe Indicator draws multi timeframe MM lines on a smaller tf chart. General Information: According to Gann, prices move in 1/8's, these 1/8's act as points of price support and resistance as an entity's price changes in time. Given this 1/8 characteristic of price action, Murrey assigns properties to each of the MML's in an a given
Crazy Dancing Levels
Mohamed yehia Osman
Crazy Dancing moving RES/SUP Levels Automatic redrawing of moving Supports and resistances levels  to indicate price breaking supports (signal SELL)  or breaking resistance levels (signal BUY) Very simple appearing indicator but very clever and smart too !!!! Main Inputs: # of bars for the support and resistances levels + the initial shift from start + moving average for filter signaling Smaller values for bars /shift inputs when using Higher Time frames (D1-H4) and the reverse higher values for
The Bollinger Bands Oscillator is an oscillator based on the "Mastering the Trade" strategy by John Carter. The strategy aims to track the movement from low to high volatility. The Bollinger Bands Oscillator measures the market's momentum. If volatility increases, Bollinger Bands is expanding and encircling the Keltner channel. Bollinger Bands Oscillator uses Bollinger Bands and Keltner Channel. The Momentum indicator is also used as a confirmation of open positions. Recommendations Currency p
Noize Absorption Index MT4
Ekaterina Saltykova
5 (1)
Noize Absorption Index - is the manual trading system that measures the difference of pressure between bears forces and bulls forces. Green line - is a noize free index that showing curent situation. Zero value of index shows totally choppy/flat market.Values above zero level shows how powerfull bullish wave is and values below zero measures bearish forces.Up arrow appears on bearish market when it's ready to reverse, dn arrow appears on weak bullish market, as a result of reverse expectation. S
"The Squeeze indicator attempts to identify periods of consolidation in a market. In general the market is either in a period of quiet consolidation or vertical price discovery. By identifying these calm periods, we have a better opportunity of getting into trades with the potential for larger moves. Once a market enters into a "squeeze," we watch the overall market momentum to help forecast the market direction and await a release of market energy." The StdATR Squeeze Channel combines standard
Happy Trend Arrow
Muhammed Emin Ugur
This   Happy Trend Arrow   indicator is designed for signal trading. This indicator generates trend signals. It uses many algorithms and indicators to generate this signal. It tries to generate signals from the points with the highest trend potential. This indicator is a complete trading product. This indicator does not need any additional indicators. The indicator is never repainted. The point at which the signal is given does not change.       Features and Recommendations Time Fra
ATeam Divergence
Hoang Ngoc Thach
The CCI Divergence is a reasonably useful indicator in itself, but it is even more effective when used with divergence pattern trading. The CCI Divergence indicator signal is one of the most potent signals among the indicators that exist in the market. Here is new version for Divergence Indicator using CCI method, with more improvements. Divergences indicate a potential investment point because the directional moment does not confirm the price. A bullish divergence occurs when the underlying
Pro Magic Signal   indicator is designed for signal trading. This indicator generates trend signals.  It uses many algorithms and indicators to generate this signal. It tries to generate a signal from the points with the highest trend potential. This indicator is a complete trading product. This indicator does not need any additional indicators.  The indicator certainly does not repaint. The point at which the signal is given does not change.  Thanks to the alert features you can get the signals
Cosmic Diviner X Planet
Olena Kondratenko
4 (2)
This unique multi-currency strategy simultaneously determines the strength of trends and market entry points, visualizing this using histograms on the chart. The indicator is optimally adapted for trading on the timeframes М5, М15, М30, Н1. For the convenience of users, the indicator renders the entry point (in the form of an arrow), recommended take profit levels (TP1, TP2 with text labels) and the recommended Stop Loss level. The take profit levels (TP1, TP2) are automatically calculated for
MT4용 R 2EMA 색상 표시기는 2 EMA의 교차를 기반으로 견고한 거래 신호를 제공합니다. 키 포인트 가격이 두 개의 녹색 EMA 위로 교차하고 닫히면 구매 거래 신호가 생성됩니다. 가격이 두 개의 빨간색 EMA 위로 교차하고 닫히면 매도 거래 신호가 생성됩니다. R 2EMA Color Forex 지표를 사용하면 구매 및 판매 시점을 더욱 쉽게 결정할 수 있습니다. 2개의 EMA 라인이 녹색으로 바뀌면 매수 신호가 발생합니다. 2개의 EMA 라인이 빨간색으로 바뀌면 매도 신호가 발생합니다. 그것으로 거래하는 방법? 두 개의 EMA 신호선이 빨간색에서 녹색으로 바뀌는 즉시 구매 거래를 시작하면 이제 추세가 긍정적입니다. 두 개의 EMA 신호선이 녹색에서 빨간색으로 바뀌는 즉시 매도 거래를 시작하십시오. 추세는 이제 음수입니다. 차트에서 반대 거래 신호가 발생하면 거래를 종료하십시오. 좋아하는 거래 방법을 자유롭게 사용하여 R 2EMA 색상 표시기로 거래를 열고 닫으십
Automatic fibonacci with alerts is an indicator that automatically plots a fibonacci retracement based on the number of bars you select on the BarsToScan setting in the indicator. The fibonacci is automatically updated in real time as new highest and lowest values appear amongst the selected bars. You can select which level values to be displayed in the indicator settings. You can also select the color of the levels thus enabling the trader to be able to attach the indicator several times with d
The Fibonacci Target indicator is an indicator that uses the Low, High and Fibonacci levels. This indicator has the ability to predict the target. It tries to determine the target that the graph will go on average and draws a target region. The indicator also serves as an oscillator. It can be used as a trend oscillator after making the necessary settings. This indicator is helpful to your strategy. There is no signal generating capability. Parameters TargetPeriod - Target line period setting
Infinity Oscillator Ultimate는   RSI, 스토캐스틱, MACD, CCI 및 거래량 전략을 활용하는 트레이더의 거래 경험을 향상시키도록 설계된 포괄적인   OSCI-KIT   입니다. 포괄적인 범위의 기능을 갖춘 이 지표는 시장 추세를 분석하고 반전 및 되돌림을 식별하며 ATR을 사용하여 일중 목표를 계산하고 중요한 거래 이벤트에 대한 정보를 얻을 수 있는 강력한 도구 세트를 제공합니다. 이 지표의 뛰어난 기능 중 하나는 가장 인기 있는 5개의 오실레이터를 단일 지표 창으로 통합하는 기능입니다. 각 오실레이터는 고유한 색상으로 표시되어 트레이더가 추세, 반전 및 되돌림을 한 눈에 쉽게 식별할 수 있습니다. 이러한 오실레이터를 결합함으로써 Infinity Oscillators Ultimate는 시장 역학에 대한 전체적인 관점을 제공하여 트레이더가 정보에 입각한 거래 결정을 내릴 수 있도록 합니다. 트레이더가 시장 움직임에 대한 최신 정보를 얻을 수 있도록 이
Pro Trend Tracking   indicator is designed for trend and signal trading. This indicator generates trend signals.  It uses many algorithms and indicators to generate this signal. It tries to generate a signal from the points with the highest trend potential. This indicator is a complete trading product. This indicator does not need any additional indicators.  You can only trade with this indicator. The generated signals are displayed on the graphical screen.  Thanks to the alert features you can
Precise Cross Arrow
Muhammed Emin Ugur
Precise Cross Arrow     indicator is designed for signal trading. This indicator generates trend signals. It uses many algorithms and indicators to generate this signal. It tries to generate a signal from the points with the highest trend potential. This indicator is a complete trading product. This indicator does not need any additional indicators. The indicator certainly does not repaint. The point at which the signal is given does not change.     Features and Suggestions Time Frame
이 제품의 구매자들이 또한 구매함
Gann Made Easy
Oleg Rodin
4.88 (90)
Gann Made Easy 는 mr.의 이론을 사용하여 최고의 거래 원칙을 기반으로 하는 전문적이고 사용하기 쉬운 Forex 거래 시스템입니다. W.D. 간. 이 표시기는 Stop Loss 및 Take Profit Levels를 포함하여 정확한 BUY 및 SELL 신호를 제공합니다. PUSH 알림을 사용하여 이동 중에도 거래할 수 있습니다. 구매 후 연락주세요! 내 거래 팁과 훌륭한 보너스 지표를 무료로 공유하겠습니다! 아마도 Gann 거래 방법에 대해 이미 여러 번 들었을 것입니다. 일반적으로 Gann의 이론은 초보자 거래자뿐만 아니라 이미 거래 경험이 있는 사람들에게도 매우 복잡한 것입니다. Gann의 거래 방식은 이론적으로 적용하기 쉽지 않기 때문입니다. 나는 그 지식을 연마하고 Forex 지표에 최고의 원칙을 적용하기 위해 몇 년을 보냈습니다. 표시기는 적용하기가 매우 쉽습니다. 차트에 첨부하고 간단한 거래 권장 사항을 따르기만 하면 됩니다. 지표는 지속적으로 시장 분석 작업
Gold Stuff
Vasiliy Strukov
4.89 (265)
Gold Stuff는 금을 위해 특별히 설계된 추세 지표이며 모든 금융 상품에서도 사용할 수 있습니다. 표시기가 다시 그려지지 않고 지연되지 않습니다. 권장 기간 H1. 표시기에서 완전 자동 Expert Advisor EA Gold Stuff를 작동합니다. 내 프로필에서 찾을 수 있습니다. 설정 및 개인 보너스를 받으려면 구매 후 즉시 저에게 연락하십시오!   강력한 지원 및 트렌드 스캐너 표시기의 무료 사본을 받으실 수 있습니다. 메시지를 보내주세요. 나!   설정 화살표 그리기 - 켜기 끄기. 차트에 화살표 그리기. 경고 - 가청 경고를 끕니다. 이메일 알림 - 켜기 끄기. 이메일 알림. Puch-notification - 켜기 끄기. 푸시 알림. 다음으로 색 영역을 조정합니다. Gold Stuff는 금을 위해 특별히 설계된 추세 지표이며 모든 금융 상품에서도 사용할 수 있습니다. 표시기가 다시 그려지지 않고 지연되지 않습니다. 권장 기간 H1. 표시기에서 완
Atomic Analyst
Issam Kassas
5 (3)
우선적으로 언급할 점은이 거래 지표가 다시 그리지 않고 지연되지 않으며 이를 통해 수동 및 로봇 거래 모두에 이상적이라는 점입니다. 사용자 매뉴얼: 설정, 입력 및 전략. Atomic Analyst는 가격의 강도와 모멘텀을 활용하여 시장에서 더 나은 이점을 찾는 PA Price Action Indicator입니다. 고급 필터를 장착하여 잡음과 거짓 신호를 제거하고 거래 잠재력을 높이는 데 도움이 됩니다. 복잡한 지표의 다중 레이어를 사용하여 Atomic Analyst는 차트를 스캔하고 복잡한 수학적 계산을 간단한 신호와 색상으로 변환하여 초보 트레이더가 이해하고 일관된 거래 결정을 내릴 수 있도록합니다. "Atomic Analyst"는 새로운 및 경험이 풍부한 트레이더를위한 종합적인 거래 솔루션입니다. 프리미엄 지표와 최고 수준의 기능을 하나의 거래 전략에 결합하여 모든 종류의 트레이더에 대한 다재다능한 선택지가되었습니다. 인트라데이 거래 및 스캘핑 전략 : 빠르고 정확한
Scalper Inside PRO
Alexey Minkov
4.75 (59)
An exclusive indicator that utilizes an innovative algorithm to swiftly and accurately determine the market trend. The indicator automatically calculates opening, closing, and profit levels, providing detailed trading statistics. With these features, you can choose the most appropriate trading instrument for the current market conditions. Additionally, you can easily integrate your own arrow indicators into Scalper Inside Pro to quickly evaluate their statistics and profitability. Scalper Inside
TPSpro RFI Levels
Roman Podpora
4.86 (21)
Reversal First Impulse levels (RFI)    INSTRUCTIONS        RUS       -       ENG              R ecommended to use with an indicator   -   TPSpro  TREND PRO -  Version MT5 A key element in trading is zones or levels from which decisions to buy or sell a trading instrument are made. Despite attempts by major players to conceal their presence in the market, they inevitably leave traces. Our task was to learn how to identify these traces and interpret them correctly. Main functions: Displaying activ
FX Power MT4 NG
Daniel Stein
5 (12)
모닝 브리핑 여기 mql5 와 텔레그램에서 FX Power MT4 NG 는 오랫동안 인기 있는 통화 강도 측정기인 FX Power의 차세대 버전입니다. 이 차세대 강도 측정기는 무엇을 제공합니까? 기존 FX Power에서 좋아했던 모든 것 PLUS GOLD/XAU 강도 분석 더욱 정밀한 계산 결과 개별 구성 가능한 분석 기간 더 나은 성능을 위한 사용자 정의 가능한 계산 한도 특별 멀티더 많은 것을보고 싶은 사람들을위한 특별한 다중 인스턴스 설정 모든 차트에서 좋아하는 색상을위한 끝없는 그래픽 설정 수많은 알림 옵션, 중요한 것을 다시는 놓치지 않도록 Windows 11 및 macOS 스타일의 둥근 모서리가 있는 새로운 디자인 마법처럼 움직이는 인디케이터 패널 FX 파워 키 특징 모든 주요 통화의 완전한 강세 이력 모든 시간대에 걸친 통화 강세 이력 모든 브로커 및 차트에서 고유 계산 결과 100% 신뢰할 수있는 실시간100 % 신뢰할 수있는 실시간 계산-> 다시 칠하지 않음
Currency Strength Wizard
Oleg Rodin
4.91 (46)
통화 강도 마법사는 성공적인 거래를 위한 올인원 솔루션을 제공하는 매우 강력한 지표입니다. 표시기는 여러 시간 프레임의 모든 통화 데이터를 사용하여 이 또는 해당 외환 쌍의 힘을 계산합니다. 이 데이터는 특정 통화의 힘을 확인하는 데 사용할 수 있는 사용하기 쉬운 통화 지수 및 통화 전력선의 형태로 표시됩니다. 필요한 것은 거래하려는 차트에 표시기를 부착하는 것뿐입니다. 표시기는 거래하는 통화의 실제 강세를 보여줍니다. 지표는 또한 추세와 거래할 때 유리하게 사용할 수 있는 구매 및 판매 거래량 압력의 극한값을 보여줍니다. 지표는 또한 피보나치에 기반한 가능한 대상을 보여줍니다. 표시기는 PUSH 알림을 포함한 모든 유형의 알림을 제공합니다. 구매 후 연락주세요. 나는 당신과 거래 팁을 공유하고 당신에게 무료로 훌륭한 보너스 지표를 줄 것입니다! 나는 당신에게 행복하고 유익한 거래를 기원합니다!
Quantum Breakout Indicator PRO
Bogdan Ion Puscasu
4.96 (26)
소개       Quantum Breakout PRO   , 브레이크아웃 존 거래 방식을 변화시키는 획기적인 MQL5 지표! 13년 이상의 거래 경험을 가진 숙련된 트레이더 팀이 개발한   Quantum Breakout PRO는   혁신적이고 역동적인 브레이크아웃 영역 전략으로 거래 여정을 새로운 차원으로 끌어올리도록 설계되었습니다. Quantum Breakout Indicator는 5개의 이익 목표 영역이 있는 브레이크아웃 영역의 신호 화살표와 브레이크아웃 상자를 기반으로 한 손절 제안을 제공합니다. 초보자 거래자와 전문 거래자 모두에게 적합합니다. Quantum EA 채널:       여기를 클릭하세요 MT5 버전 :   여기를 클릭하세요 중요한! 구매 후 설치 매뉴얼을 받으려면 개인 메시지를 보내주십시오. 추천: 기간: M15 통화쌍: GBPJPY, EURJPY, USDJPY,NZDUSD, XAUUSD 계정 유형: 스프레드가 매우 낮은 ECN, Ra
Advanced Currency Strength28 Indicator
Bernhard Schweigert
4.91 (666)
현재 26% 할인 초보자 또는 전문가 트레이더를 위한 최고의 솔루션! 이 지표는 우리가 독점 기능과 새로운 공식을 통합했기 때문에 독특하고 고품질이며 저렴한 거래 도구입니다. 단 하나의 차트로 28 Forex 쌍의 통화 강도를 읽을 수 있습니다! 새로운 추세 또는 스캘핑 기회의 정확한 트리거 포인트를 정확히 찾아낼 수 있기 때문에 거래가 어떻게 개선될지 상상해 보십시오. 사용 설명서: 여기를 클릭  https://www.mql5.com/en/blogs/post/697384 그것이 첫 번째, 원본입니다! 쓸모없는 지망생 클론을 사지 마십시오. 더 스페셜  강력한 통화 모멘텀을 보여주는 하위 창의 화살표 GAP가 거래를 안내합니다! 기본 또는 호가 통화가 과매도/과매도 영역(외부 시장 피보나치 수준)에 있을 때 개별 차트의 기본 창에 경고 표시가 나타납니다. 통화 강도가 외부 범위에서 떨어질 때 풀백/반전 경고. 교차 패턴의 특별 경고 추세를 빠르게 볼 수 있는
GOLD Impulse with Alert
Bernhard Schweigert
4.56 (9)
이 지표는 Advanced Currency IMPULSE with ALERT  +   Currency Strength Exotics  의 2가지 제품의 슈퍼 조합입니다. 그것은 모든 시간 프레임에 대해 작동하며 8개의 주요 통화와 하나의 기호에 대한 강약의 충동을 그래픽으로 보여줍니다! 이 표시기는 금, 이국적인 쌍, 상품, 지수 또는 선물과 같은 기호에 대한 통화 강도 가속을 표시하는 데 특화되어 있습니다. 금, 은, 오일, DAX, US30, MXN, TRY, CNH 등의 진정한 통화 강도 가속(충동 또는 속도)을 표시하기 위해 9번째 줄에 모든 기호를 추가할 수 있습니다. 새로운 기본 알고리즘을 기반으로 구축되어 잠재적인 거래를 훨씬 더 쉽게 식별하고 확인할 수 있습니다. 이는 통화의 강세 또는 약세가 가속되는지 여부를 그래픽으로 표시하고 가속 속도를 측정하기 때문입니다. 자동차의 속도계처럼 생각하면 됩니다. 가속화할 때 Forex 시장에서 동일한 일이 분명히
우선적으로, 이 거래 도구는 전문적인 거래에 이상적인 비-다시 그리기 및 지연되지 않는 지표입니다.  온라인 강좌, 사용자 매뉴얼 및 데모. 스마트 가격 액션 컨셉트 인디케이터는 신규 및 경험 많은 트레이더 모두에게 매우 강력한 도구입니다. Inner Circle Trader Analysis 및 Smart Money Concepts Trading Strategies와 같은 고급 거래 아이디어를 결합하여 20가지 이상의 유용한 지표를 하나로 결합합니다. 이 인디케이터는 스마트 머니 컨셉트에 중점을 두어 대형 기관의 거래 방식을 제공하고 이동을 예측하는 데 도움을 줍니다.  특히 유동성 분석에 뛰어나 기관이 어떻게 거래하는지 이해하는 데 도움을 줍니다. 시장 트렌드를 예측하고 가격 변동을 신중하게 분석하는 데 탁월합니다. 귀하의 거래를 기관 전략에 맞추어 시장의 동향에 대해 더 정확한 예측을 할 수 있습니다. 이 인디케이터는 시장 구조를 분석하고 중요한 주문 블록을 식별하고 다양한
M1 Arrow
Oleg Rodin
5 (14)
시장의 두 가지 기본 원칙에 기반한 일중 전략. 알고리즘은 추가 필터를 사용하여 거래량 및 가격 파동 분석을 기반으로 합니다. 지표의 지능형 알고리즘은 두 가지 시장 요인이 하나로 결합될 때만 신호를 제공합니다. 지표는 더 높은 시간 프레임의 데이터를 사용하여 M1 차트에서 특정 범위의 파도를 계산합니다. 그리고 파동을 확인하기 위해 지표는 볼륨 분석을 사용합니다. 이 표시기는 준비된 거래 시스템입니다. 트레이더가 필요로 하는 모든 것은 신호를 따르는 것입니다. 또한 지표는 자신의 거래 시스템의 기초가 될 수 있습니다. 거래는 분 차트에서만 수행됩니다. 지표가 MTF 원리를 사용한다는 사실에도 불구하고 지표 알고리즘은 가능한 한 안정적입니다. 구매 후 반드시 저에게 편지를 보내주세요! 내 거래 설정 및 권장 사항을 공유하겠습니다!
TPSproTREND PrO
Roman Podpora
4.78 (18)
TPSpro TRENDPRO  - is a trend indicator that automatically analyzes the market and provides information about the trend and each of its changes, as well as giving signals for entering trades without redrawing! The indicator uses each candle, analyzing them separately. referring to different impulses - up or down impulse. Exact entry points into transactions for currencies, crypto, metals, stocks, indices!  -  Version MT5               DETAILED DESCRIPTION                R ecommended to use with
Advanced Supply Demand
Bernhard Schweigert
4.92 (313)
현재 33% 할인! 초보자나 전문 트레이더를 위한 최고의 솔루션! 이 보조지표는 우리가 다수의 독창적 기능과 새로운 공식을 통합한 독특하고 고품질이며 저렴한 거래 도구입니다. 이 업데이트를 통해 이중 시간대를 표시할 수 있습니다. 더 높은 TF를 표시할 수 있을 뿐만 아니라 차트 TF와 더 높은 TF 모두를 표시할 수 있습니다: 중첩 영역 표시. 모든 Supply Demand 트레이더들이 좋아할 것입니다. :) 중요한 정보 공개 Advanced Supply Demand의 잠재력을 극대화하려면 다음을 방문하십시오. https://www.mql5.com/ko/blogs/post/720245   진입 또는 목표의 명확한 트리거 포인트를 정확히 찾아냄으로 해서 거래가 어떻게 개선될지 상상해 보십시오. 새로운 알고리즘을 기반으로 매수자와 매도자 간의 잠재적인 불균형을 훨씬 더 쉽게 분간할 수 있습니다. 왜냐하면 가장 강한 공급영역과 가장 강한 수요 영역과 과거에 어떻게 진행 되었는지를(이
Trend Punch
Mohamed Hassan
5 (17)
Manual guide:   Click here WEEK SALE PROMO:   $59 ONLY!  -- Next price is  $120 .  This indicator is unstoppable when combined with our other indicator called  Support & Resistance . After purchase, send us a message and you will get it   for  FREE as a BONUS! I like to use Trend Punch on XAUUSD on the M1 timeframe & higher ones!  Introducing Trend Punch , the revolutionary forex trend indicator that will transform the way you trade! Trend Punch is uniquely designed to provide pre
Cycle Sniper
Elmira Memish
4.41 (37)
NEW YEAR SALE PRICE FOR LIMITED TIME!!! Please contact us after your purchase and we will send you the complimentary indicators to complete the system Cycle Sniper is not a holy grail but when you use it in a system which is explained in the videos, you will feel the difference. If you are not willing to focus on the charts designed with Cycle Sniper and other free tools we provide, we recommend not buying this indicator. We recommend watching the videos about the indiactor and system before pu
현재 20% 할인 ! 초보자 또는 전문가 트레이더를 위한 최고의 솔루션! 이 대시보드 소프트웨어는 28개의 통화 쌍에서 작동합니다. 2가지 주요 지표(Advanced Currency Strength 28 및 Advanced Currency Impulse)를 기반으로 합니다. 전체 Forex 시장에 대한 훌륭한 개요를 제공합니다. 고급 통화 강도 값, 통화 이동 속도 및 모든(9) 시간대의 28 Forex 쌍에 대한 신호를 보여줍니다. 추세 및/또는 스캘핑 기회를 정확히 파악하기 위해 차트의 단일 지표를 사용하여 전체 시장을 볼 수 있을 때 거래가 어떻게 개선될지 상상해 보십시오! 잠재적인 거래를 식별하고 확인하면서 강력한 통화와 약한 통화를 더욱 쉽게 식별할 수 있도록 이 지표에 기능을 내장했습니다. 이 표시기는 통화의 강세 또는 약세가 증가 또는 감소하는지 여부와 모든 시간대에서 수행되는 방식을 그래픽으로 보여줍니다. 추가된 새로운 기능은 현재 시장 조건 변화에 적
Trend Screener
STE S.S.COMPANY
4.83 (90)
트렌드 표시기, 트렌드 트레이딩 및 필터링을 위한 획기적인 고유 솔루션, 하나의 도구 안에 내장된 모든 중요한 트렌드 기능! Forex, 상품, 암호 화폐, 지수 및 주식과 같은 모든 기호/도구에 사용할 수 있는 100% 다시 칠하지 않는 다중 시간 프레임 및 다중 통화 표시기입니다. Trend Screener는 차트에 점이 있는 화살표 추세 신호를 제공하는 효율적인 지표 추세 추종 지표입니다. 추세 분석기 표시기에서 사용할 수 있는 기능: 1. 트렌드 스캐너. 2. 최대 이익 분석이 있는 추세선. 3. 추세 통화 강도 측정기. 4. 경고가 있는 추세 반전 점. 5. 경고가 있는 강력한 추세 점. 6. 추세 화살표 Trend Screener Indicator가 있는 일일 분석 예, 일일 신호 성능...등은 여기에서 찾을 수 있습니다.   여기를 클릭하십시오. LIMITED TIME OFFER : Trend Screener Indicator는 50 $ 및 평생 동안만 사용할 수 있
RelicusRoad Pro
Relicus LLC
4.73 (140)
이제 $ 147 (몇 가지 업데이트 후 $ 499 증가) - 무제한 계정 (PCS 또는 MACS) RelicusRoad 사용 설명서 + 교육 비디오 + 비공개 Discord 그룹 액세스 + VIP 상태 시장을 보는 새로운 방법 RelicusRoad는 외환, 선물, 암호화폐, 주식 및 지수에 대한 세계에서 가장 강력한 거래 지표로서 거래자에게 수익성을 유지하는 데 필요한 모든 정보와 도구를 제공합니다. 우리는 초보자부터 고급까지 모든 거래자가 성공할 수 있도록 기술적 분석 및 거래 계획을 제공합니다. 미래 시장을 예측할 수 있는 충분한 정보를 제공하는 핵심 거래 지표입니다. 우리는 차트에서 말이 안 되는 여러 지표 대신 완전한 솔루션을 믿습니다. 타의 추종을 불허하는 매우 정확한 신호, 화살표 + 가격 조치 정보를 표시하는 올인원 표시기입니다. 강력한 AI를 기반으로 하는 RelicusRoad는 누락된 정보와 도구를 제공하여 교육하고 성공적인 트레이더인 트레이딩 전문
IX Power MT4
Daniel Stein
5 (6)
IX Power는 마침내 FX Power의 탁월한 정밀도를 외환이 아닌 기호에도 적용했습니다. 좋아하는 지수, 주식, 원자재, ETF, 심지어 암호화폐까지 단기, 중기, 장기 추세의 강도를 정확하게 파악할 수 있습니다. 단말기가 제공하는 모든 것을 분석할 수 있습니다. 사용해 보고 트레이딩 타이밍이 크게 향상되는 것을 경험해 보세요. IX Power 주요 특징 단말기에서 사용 가능한 모든 거래 심볼에 대해 100% 정확한 비재도장 계산 결과 제공 사전 구성 및 추가적으로 개별 구성 가능한 강도 분석 기간의 드롭다운 선택 가능 이메일, 메시지, 모바일 알림을 통한 다양한 알림 옵션 제공 EA 요청을 위한 액세스 가능한 버퍼 더 나은 성능을 위한 사용자 지정 가능한 계산 한도 더 많은 것을 보고 싶은 사용자를 위한 특별 다중 인스턴스 설정 모든 차트에서 좋아하는 색상을 위한 무한한 그래픽 설정 가능 Windows 11 및 macOS 스타일의 둥근 모서리를 가
Indicator : RealValueIndicator Description : RealValueIndicator is a powerful tool designed specifically for trading on the EURUSD pair. This indicator analyzes all EUR and USD pairs, calculates their real currency strength values, and displays them as a single realistic value to give you a head start on price. This indicator will tell you moves before they happen if you use it right. RealValueIndicator allows you to get a quick and accurate overview of the EURUSD currency pair tops and bottoms,
Advanced Currency IMPULSE with ALERT
Bernhard Schweigert
4.91 (495)
현재 31% 할인!! 초보자 또는 전문가 트레이더를 위한 최고의 솔루션! 이 지표는 우리가 독점 기능과 비밀 공식을 통합했기 때문에 독특하고 고품질이며 저렴한 거래 도구입니다. 단 하나의 차트로 28개 통화 쌍 모두에 대한 경고를 제공합니다. 새로운 추세 또는 스캘핑 기회의 정확한 트리거 포인트를 정확히 찾아낼 수 있기 때문에 거래가 어떻게 개선될지 상상해 보십시오! 새로운 기본 알고리즘을 기반으로 구축되어 잠재적인 거래를 훨씬 더 쉽게 식별하고 확인할 수 있습니다. 이는 통화의 강세 또는 약세가 가속되는지 여부를 그래픽으로 표시하고 가속 속도를 측정하기 때문입니다. 자동차의 속도계처럼 생각하면 됩니다. 가속화할 때 Forex 시장에서 동일한 일이 분명히 더 빠르게 발생합니다. 즉, 반대 방향으로 가속화되는 통화를 페어링하면 잠재적으로 수익성 있는 거래를 식별한 것입니다. 통화 모멘텀의 수직선과 화살표가 거래를 안내합니다! 역동적인 Market Fibonacci 23
Quantum Trend Sniper Indicator MT4
Bogdan Ion Puscasu
4.6 (40)
소개       Quantum Trend Sniper Indicator는   추세 반전을 식별하고 거래하는 방식을 변화시키는 획기적인 MQL5 지표입니다! 13년 이상의 거래 경험을 가진 숙련된 트레이더 팀이 개발한       Quantum Trend Sniper 표시기       매우 높은 정확도로 추세 반전을 식별하는 혁신적인 방법으로 거래 여정을 새로운 차원으로 끌어올리도록 설계되었습니다. ***Quantum Trend Sniper Indicator를 구입하면 Quantum Breakout Indicator를 무료로 받을 수 있습니다!*** Quantum Trend Sniper Indicator는 추세 반전을 식별하고 세 가지 이익실현 수준을 제안할 때 경고, 신호 화살표를 제공합니다. 초보자 거래자와 전문 거래자 모두에게 적합합니다. Quantum EA 채널:       여기를 클릭하세요 MT5 버전:       여기를 클릭하세요
Trend Line Map Pro
STE S.S.COMPANY
4.73 (15)
트렌드 라인 맵 표시기는 트렌드 스크리너 표시기의 애드온입니다. Trend screener (Trend Line Signals)에 의해 생성된 모든 신호에 대한 스캐너로 작동합니다. Trend Screener Indicator 기반의 Trend Line Scanner입니다. Trend Screener Pro 표시기가 없으면 Trend Line Map Pro가 작동하지 않습니다. MQL5 블로그에 액세스하여 추세선 지도 표시기의 무료 버전을 다운로드할 수 있습니다. Metatrader Tester 제한 없이 구매하기 전에 사용해 보십시오. :   여기를 클릭하세요 1. 쉽게 얻을 수 있는 이점 통화 및 시간 프레임을 기반으로 매수 및 매도 신호를 표시합니다. 차트에 화살표가 나타난 이후 가격이 몇 핍 증가 또는 감소했는지 평가하십시오. ( 트렌드 스크리너 표시기 화살표 ) 신호의 타이밍을 표시합니다. 구매 및 판매 알림에 대한 다중 기간 및 다중 통화 알림 받기.
Market Swing Index MSI
Elias Mtwenge
5 (1)
JULY OFFER 80% OFF next price for unlimited version will be 17000$. This is the only time you can get this institutional and professional indicator at this price for unlimited version. Don't dare to miss this. The tool I am about to introduce to you you can't compare it with other tools due to its strategy and accuracy level in predicting the next price directional movement . This tool is designed for serious traders who have decided to make a difference through trading. Be the next person to wi
TrendMaestro
Stefano Frisetti
5 (3)
note: this indicator is for METATRADER4, if you want the version for METATRADER5 this is the link:  https://www.mql5.com/it/market/product/108106 TRENDMAESTRO ver 2.4 TRENDMAESTRO recognizes a new TREND in the bud, he never makes mistakes. The certainty of identifying a new TREND is priceless. DESCRIPTION TRENDMAESTRO identifies a new TREND in the bud, this indicator examines the volatility, volumes and momentum to identify the moment in which there is an explosion of one or more of these data a
Legacy of Gann
Pavel Zamoshnikov
4.85 (13)
The indicator very accurately determines the levels of the possible end of the trend and profit fixing. The method of determining levels is based on the ideas of W.D.Gann, using an algorithm developed by his follower Kirill Borovsky. Extremely high reliability of reaching levels (according to K. Borovsky  - 80-90%) Indispensable for any trading strategy – every trader needs to determine the exit point from the market! Precisely determines targets on any timeframes and any instruments (forex, met
FX Volume
Daniel Stein
4.61 (36)
모닝 브리핑을 통해 세부 정보와 스크린샷으로 매일 시장 업데이트를 받으세요 여기 mql5 및 텔레그램에서 FX 거래량은 브로커의 관점에서 시장 심리에 대한 실제 통찰력을 제공하는 최초이자 유일한 거래량 지표입니다. 브로커와 같은 기관 시장 참여자가 외환 시장에서 어떤 포지션을 취하고 있는지에 대한 훌륭한 통찰력을 COT 보고서보다 훨씬 빠르게 제공합니다. 차트에서 이 정보를 직접 확인하는 것은 트레이딩의 진정한 판도를 바꾸고 획기적인 솔루션입니다. 다음과 같은 고유한 시장 데이터 인사이트의 이점 비율 는 통화의 매수/매도 포지션 비율을 백분율로 표시 비율 변화 는 선택한 기간 내 매수 비율과 비율 변화를 표시 총 거래량 는 해당 통화의 총 거래량(롱 및 숏)을 로트 단위로 보여줍니다 Volumes Long 는 해당 통화의 모든 롱 포지션의 거래량을 보여줍니다 Volumes Short 는 해당 통화의 모든 숏 포지션의 거래량을 보여줍니다 Net Long 는 순 롱 포지션의 거래량
맞춤형 MT4 지표로 성공적인 외환 거래에 대한 비밀을 발견하십시오! 외환 시장에서 성공을 달성하고 위험을 최소화하면서 일관되게 이익을 얻는 방법을 궁금해 한 적이 있습니까? 여기에 당신이 찾고 있던 답이 있습니다! 거래에 대한 귀하의 접근 방식을 혁신 할 독점적 MT4 지표를 소개 할 수 있습니다. 독특한 다양성 우리의 지표는 Renko 및 Rangebar Candle Formations를 선호하는 사용자를 위해 특별히 설계되었습니다. 우리는 이러한 차트 유형이 많은 숙련 된 거래자들이 선호한다는 것을 이해하기 때문에 우리의 지표가 그들과 완벽하게 통합되어 비교할 수없는 시장 분석을 제공합니다. 명확한 추세 신호 복잡한 분석을 잊어 버리십시오! 우리의 지표는 생생한 색상과 명확한 점 구조를 사용하여 시장 동향을 명확하게 나타냅니다. 빨간색과 파란색 점은 가격 이동 방향에 대해 의심의 여지가 없어 거래에서 빠른 의사 결정을 할 수 있습니다. HH/HL HL/LL
ICT, SMC, SMART MONEY CONCEPTS, SMART MONEY, Smart Money Concept, Support and Resistance, Trend Analysis, Price Action, Market Structure, Order Blocks, BOS/CHoCH,   Breaker Blocks ,  Momentum Shift,   Supply&Demand Zone/Order Blocks , Strong Imbalance, HH/LL/HL/LH,    Fair Value Gap, FVG,  Premium  &   Discount   Zones, Fibonacci Retracement, OTE, Buy Side Liquidity, Sell Side Liquidity, BSL/SSL Taken, Equal Highs & Lows, MTF Dashboard, Multiple Time Frame, BigBar, HTF OB, HTF Market Structure, 
제작자의 제품 더 보기
Market Steps MT4
Mahdi Ebrahimzadeh
5 (1)
시장 단계 표시기는 Gann 시간/가격 상관 관계를 기반으로 설계 및 구축되었으며 Forex 시장에 대한 가격 조치 특정 규칙에 따라 최적화됩니다. 시장 주문 흐름 개념을 사용하여 대량 주문에 대한 잠재적 가격 영역을 예측합니다. 지표 수준은 거래 자체에 사용하거나 다른 전략/지표의 잘못된 신호를 필터링하기 위한 조합으로 사용할 수 있습니다. 모든 거래자는 차트에 다중 시간 프레임(TF) 영역과 가격 변동 가능성을 함께 표시할 수 있는 강력한 도구가 필요합니다. 테스터 모드에서 파워를 테스트하여 레벨이 차트보다 어떻게 가격을 책정하는지 확인할 수 있습니다. 표시기 장점: 두 개의 서로 다른 영역이 있는 마킹 차트는 서로 다른 TF에 대한 추세 및 범위 시장을 지정합니다. Price Action 거래자는 이를 사용하여 다른 TF/가격 구역의 주문 흐름을 식별하거나 FTR(Fail To Return)/FTC(Fail To Continue)를 확인할 수 있습니다. 시장의 휘발
럭스알고에서 코딩한 다른 플랫폼에서 변환한 인디케이터입니다. 다양한 유형의 이동 평균을 추가하여 데이터 소스를 다양화했습니다. 원래 버전에서 이동 평균은 SMA와 캔들 종가에서 수집 한 시장 데이터 소스입니다.  이 버전에서는 다양한 이동평균 유형을 선택할 수 있으며 고점/저점/HL2/HLC/HLC2/.. 와 같은 소스 데이터도 선택할 수 있습니다. 다음은 원 개발자의 설명입니다: 범위 탐지기 인디케이터는 가격 변동이 있는 구간을 감지하고 강조 표시하는 것을 목표로 합니다. 범위의 끝은 실시간으로 강조 표시되며, 브레이크 아웃은 끝의 색상 변화로 표시됩니다. 박스권 장세는 가격이 특정 범위 내에서 움직이는 고정 기간으로 정의됩니다. 박스권 장세를 감지하는 것은 트레이더가 수동으로 수행하는 일반적인 작업입니다. 가격이 박스권 양끝 중 하나를 돌파하면 새로운 추세를 나타낼 수 있으며, 가격이 박스권 상단 양끝을 돌파하면 상승 추세, 하단 양끝을 돌파하면 하락 추세
이 코드는 원래 다른 프로그래밍 언어에서 LuxAlgo에 의해 게시되었습니다.  다양한 트레이딩 목적으로 사용할 수 있는 적절한 추세 예측 기능을 가지고 있습니다. 다음은 코드 생성기의 설명입니다: 이 인디케이터는 이전에 게시한 나다라야-왓슨 스무더를 기반으로 합니다. 여기서는 커널 스무딩을 기반으로 한 봉투형 인디케이터를 만들었으며, 가격과 봉투형 극단의 교차를 통해 통합된 알림을 제공합니다. 나다라야-왓슨 추정기와 달리 이 지표는 반대 방법론을 따릅니다. 기본적으로 이 지표는 다시 칠할 수 있다는 점에 유의하세요. 사용자는 설정에서 다시 칠하지 않는 평활화 방법을 사용할 수 있습니다. 삼각형 레이블은 실시간 애플리케이션에서 인디케이터를 유용하게 사용할 수 있도록 설계되었습니다. 테스터에서 백 테스트의 경우 첫 번째 500 캔들이 지나갈 때까지 기다려주세요. 이는 지표가 매개 변수를 계산하기 위해 이전 기록 데이터를 사용하는 경우 테스터의 제한입니다. 이는 지표가
Indicator is converted from another programming language code by programmer " sbtnc ". MQL version is simplified to be more useful by less settings complexity.  There is some clues from programmer about indicator: The indicator tracks and reports the percentage of occurrence of daily tops and bottoms by the time of the day.  At certain times during the trading day, the market reverses and marks the high or low of the day. Tops and bottoms are vital when entering a trade, as they will decide if y
FREE
Relative Trend Index
Mahdi Ebrahimzadeh
인디케이터가 다른 프로그래밍 언어에서 MQL로 번역되었습니다. RTI는 차트의 추세를 진동 방식으로 식별하는 강력한 통행료입니다. 다음은 원 프로그래머의 메모입니다: 개요 Zeiierman이 개발한 상대적 추세 지수(RTI)는 시장 추세의 강도와 방향을 측정하기 위해 고안된 혁신적인 기술적 분석 도구입니다. 일부 기존 지표와 달리 RTI는 시장 변동성에 적응하고 대응하는 동시에 사소한 단기 시장 변동의 영향을 최소화하는 독특한 능력을 자랑합니다. 상대적 추세 지수는 추세 추종 및 평균 복귀 특성과 추세 강도에 대한 사용자 지정 가능하고 직관적인 접근 방식을 결합한 것으로, 가격 움직임에 민감하게 반응하기 때문에 이 지표가 돋보입니다. RSI 대신 이 RTI를 사용할 때의 이점 상대강도지수(RSI)와 상대추세지수(RTI)는 모두 강력한 기술적 지표로, 각각 고유한 강점을 가지고 있습니다. 그러나 특히 추세와 과매수/과매도(OB/OS) 영역을 식별하는 데 있어 RTI가
Market Steps MT5
Mahdi Ebrahimzadeh
시장 단계 표시기는 Gann 시간/가격 상관 관계를 기반으로 설계 및 구축되었으며 Forex 시장에 대한 가격 조치 특정 규칙에 따라 최적화됩니다. 시장 주문 흐름 개념을 사용하여 대량 주문에 대한 잠재적 가격 영역을 예측합니다. 지표 수준은 거래 자체에 사용하거나 다른 전략/지표의 잘못된 신호를 필터링하기 위한 조합으로 사용할 수 있습니다. 모든 거래자는 차트에 다중 시간 프레임(TF) 영역과 가격 변동 가능성을 함께 표시할 수 있는 강력한 도구가 필요합니다. 테스터 모드에서 파워를 테스트하여 레벨이 차트보다 어떻게 가격을 책정하는지 확인할 수 있습니다. 표시기 장점: 두 개의 서로 다른 영역이 있는 마킹 차트는 서로 다른 TF에 대한 추세 및 범위 시장을 지정합니다. Price Action 거래자는 이를 사용하여 다른 TF/가격 구역의 주문 흐름을 식별하거나 FTR(Fail To Return)/FTC(Fail To Continue)를 확인할 수 있습니다. 시장의 휘발
필터:
리뷰 없음
리뷰 답변
버전 1.10 2024.01.07
- small bugs solved