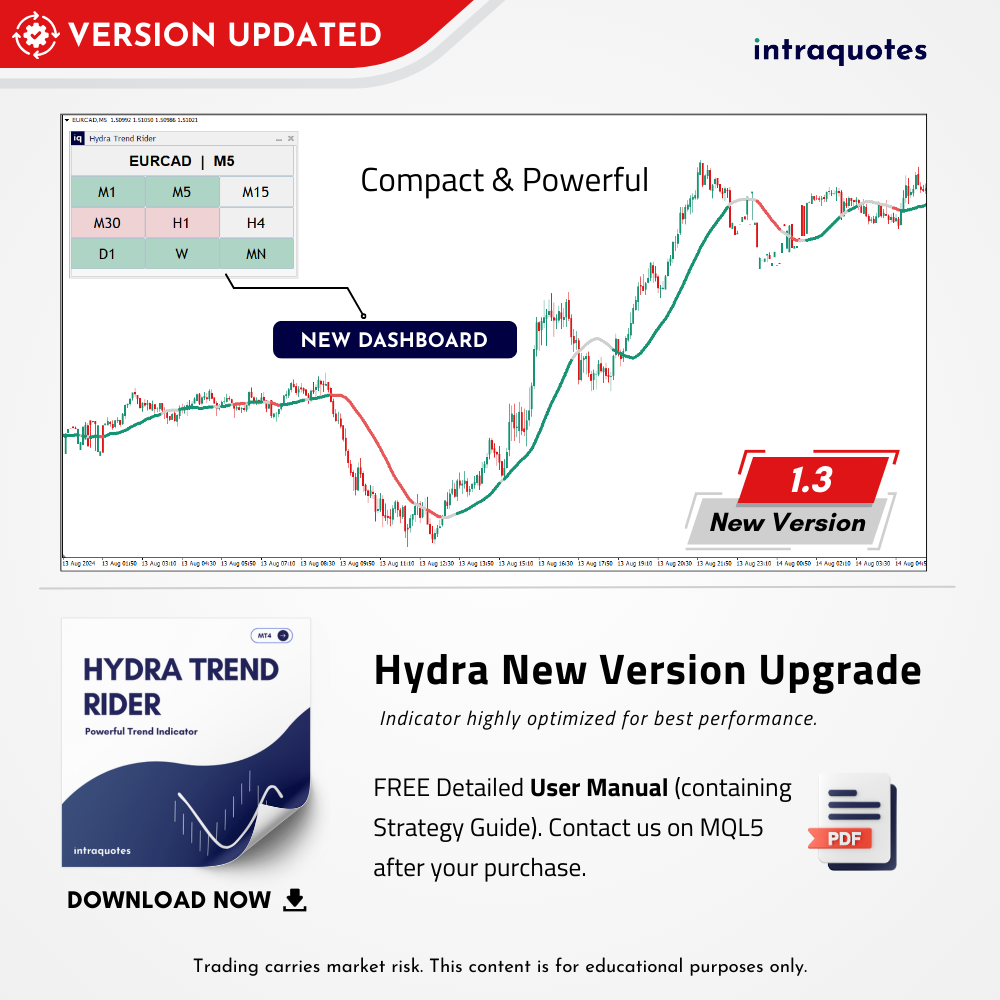
Hydra Trend Rider
- 지표
- INTRAQUOTES
- 버전: 1.3
- 업데이트됨: 23 8월 2024
- 활성화: 5
Contact us to receive a comprehensive user guide after purchasing.
Enhance your trading experience with the Hydra Trend Rider Indicator, meticulously designed by MQL5 silver award winning developer to provide you with unparalleled market insights and empower your decision-making process. This advanced tool is perfect for traders seeking precision and efficiency in their trading strategies.
- Join our MQL5 Channel
Indicator Features:
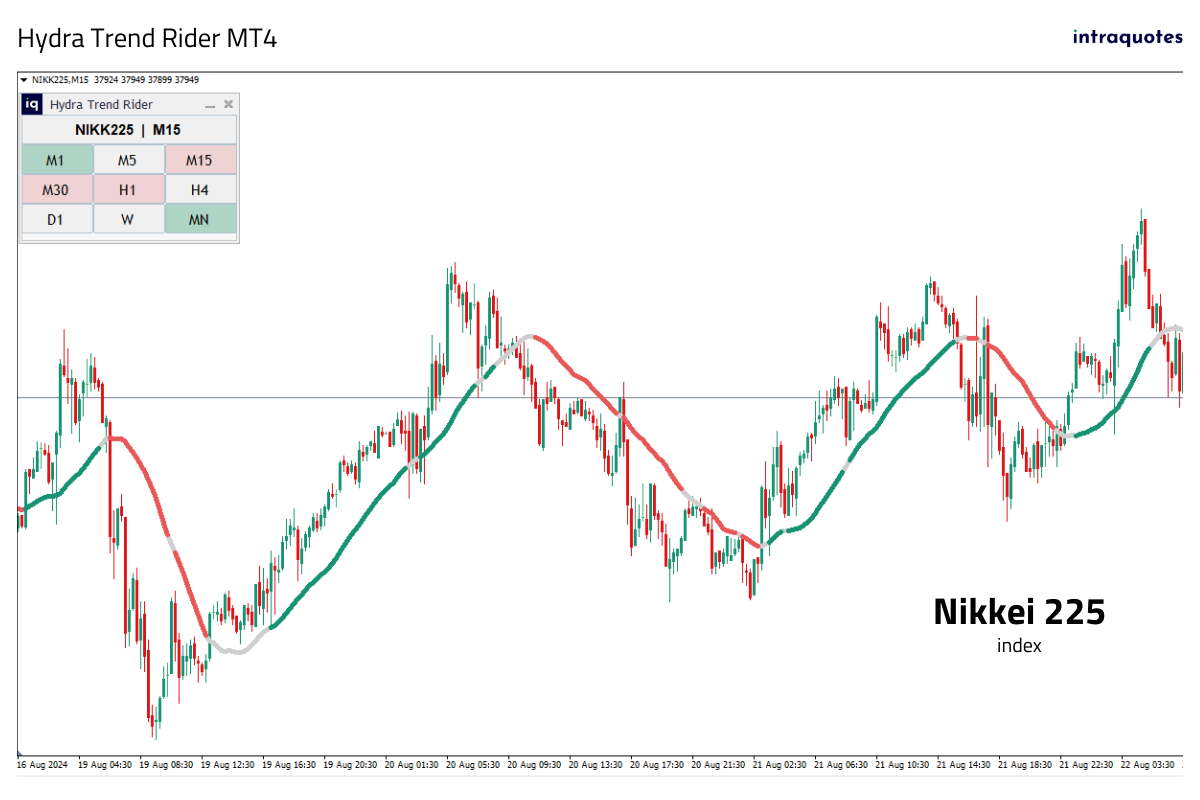
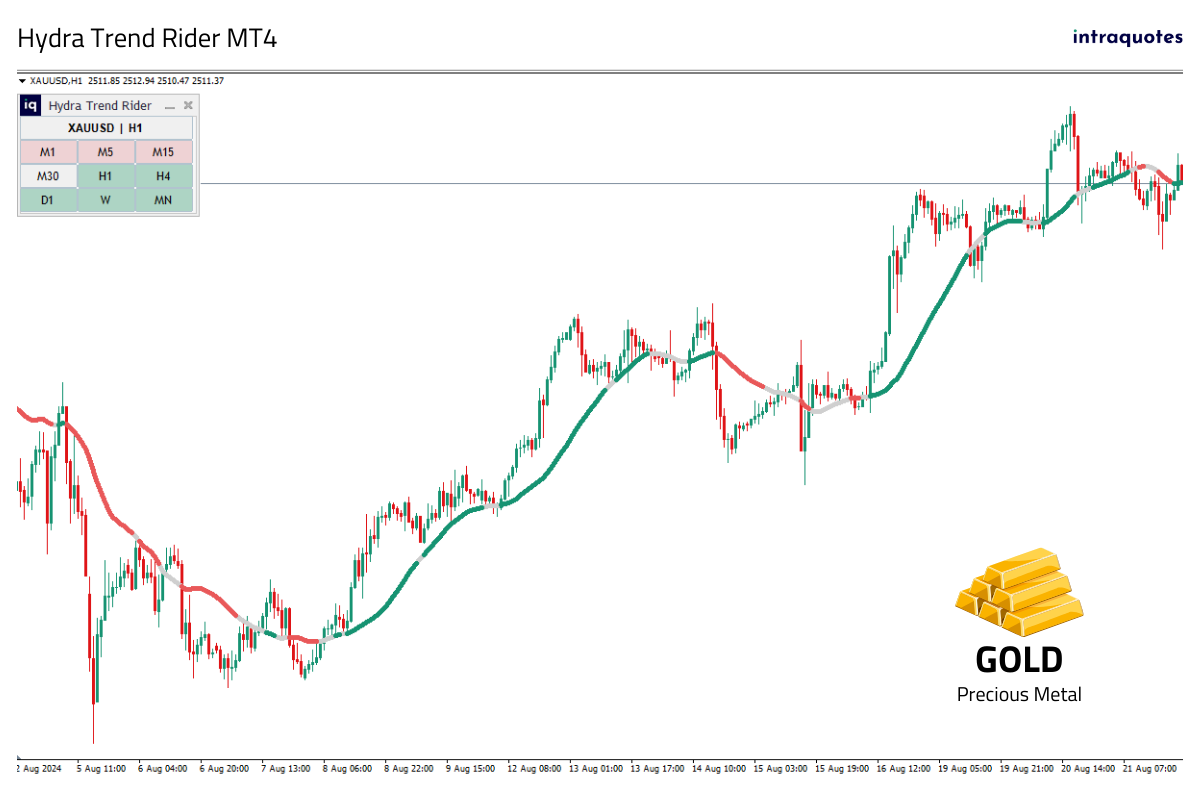
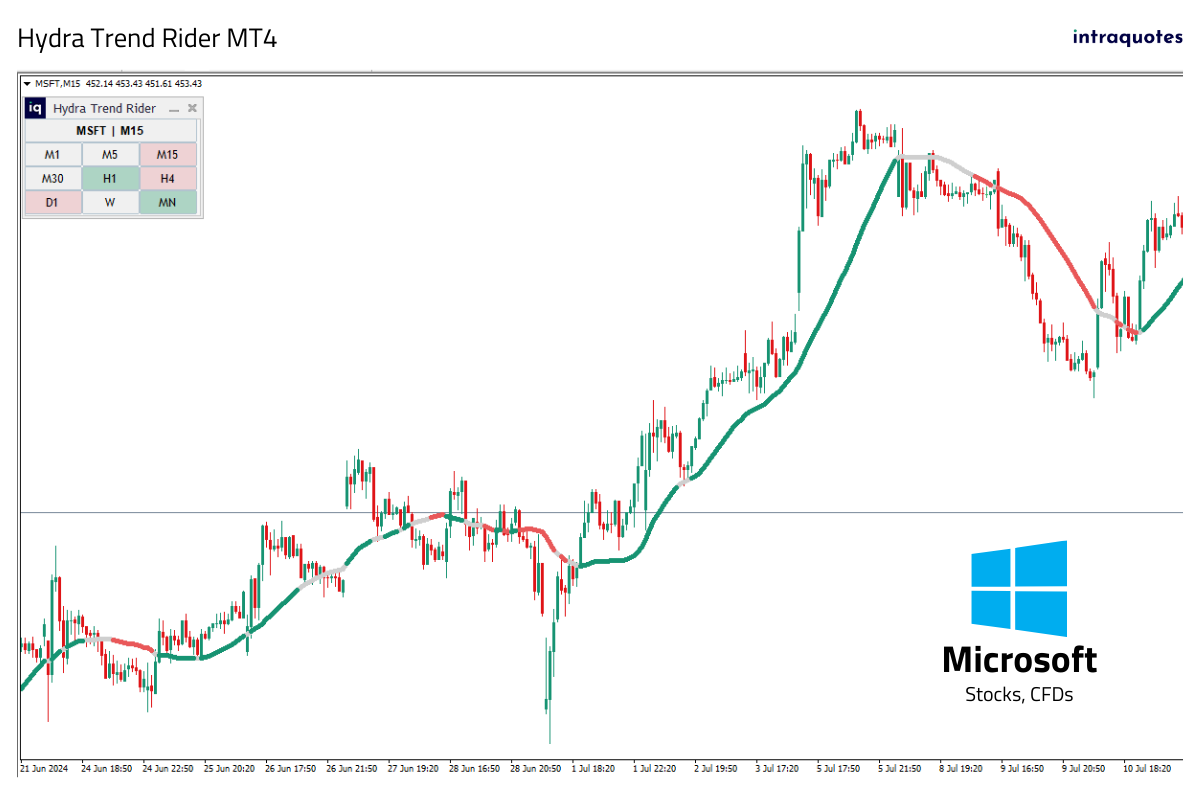
- Multiple Timeframe Dashboard:
Gain a comprehensive view of the market across different timeframes with our sophisticated dashboard. Whether you are analyzing short-term fluctuations or long-term trends, the Hydra Indicator ensures you never miss a beat.
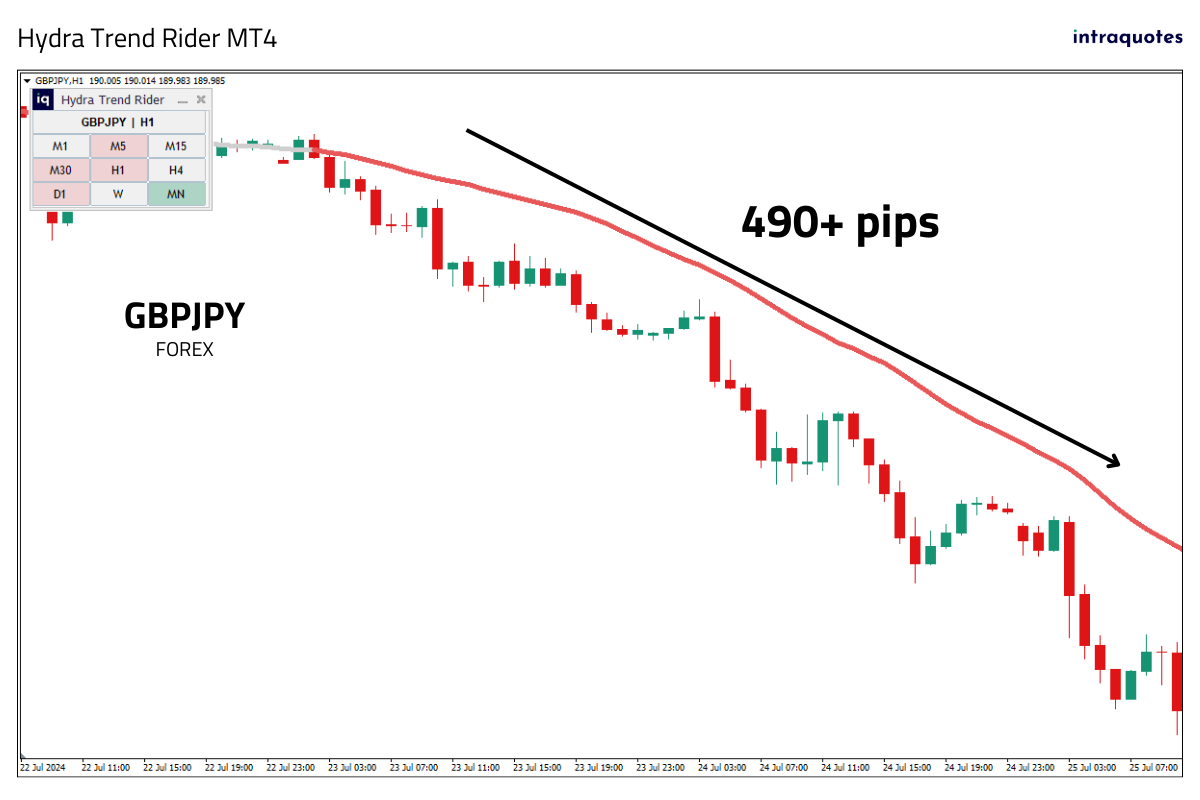
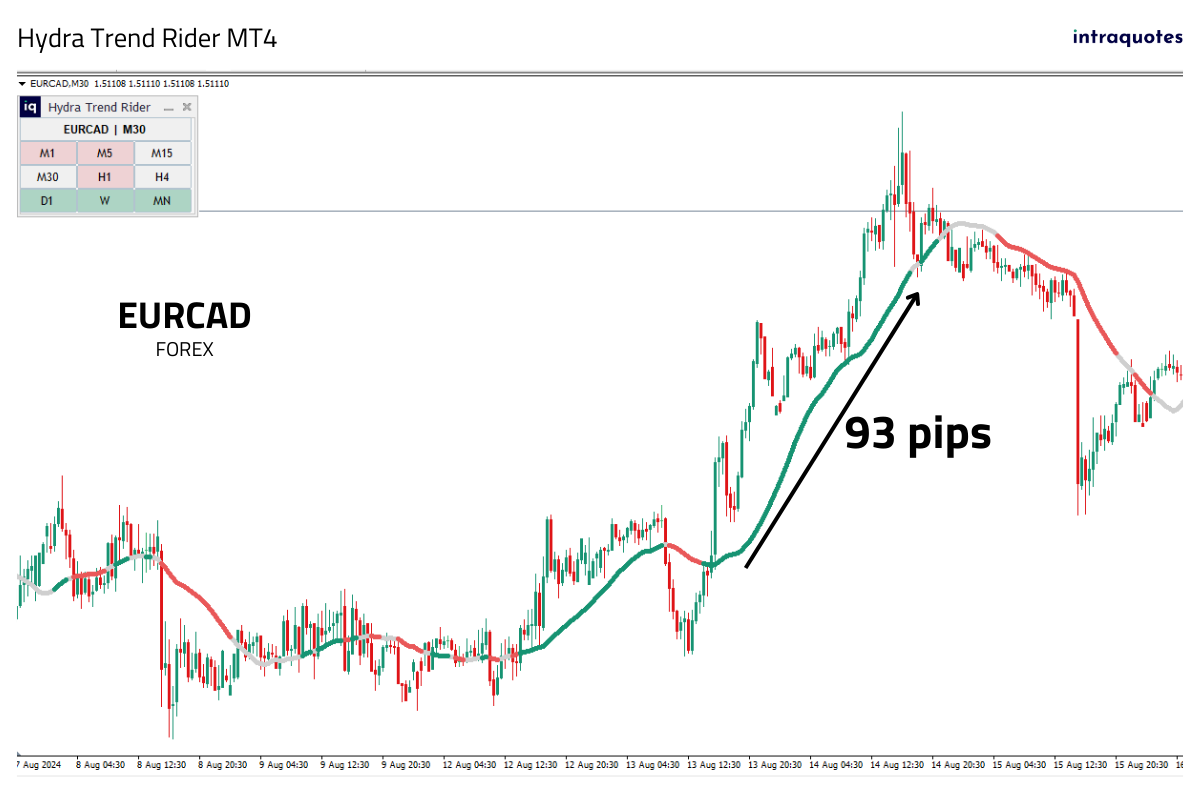
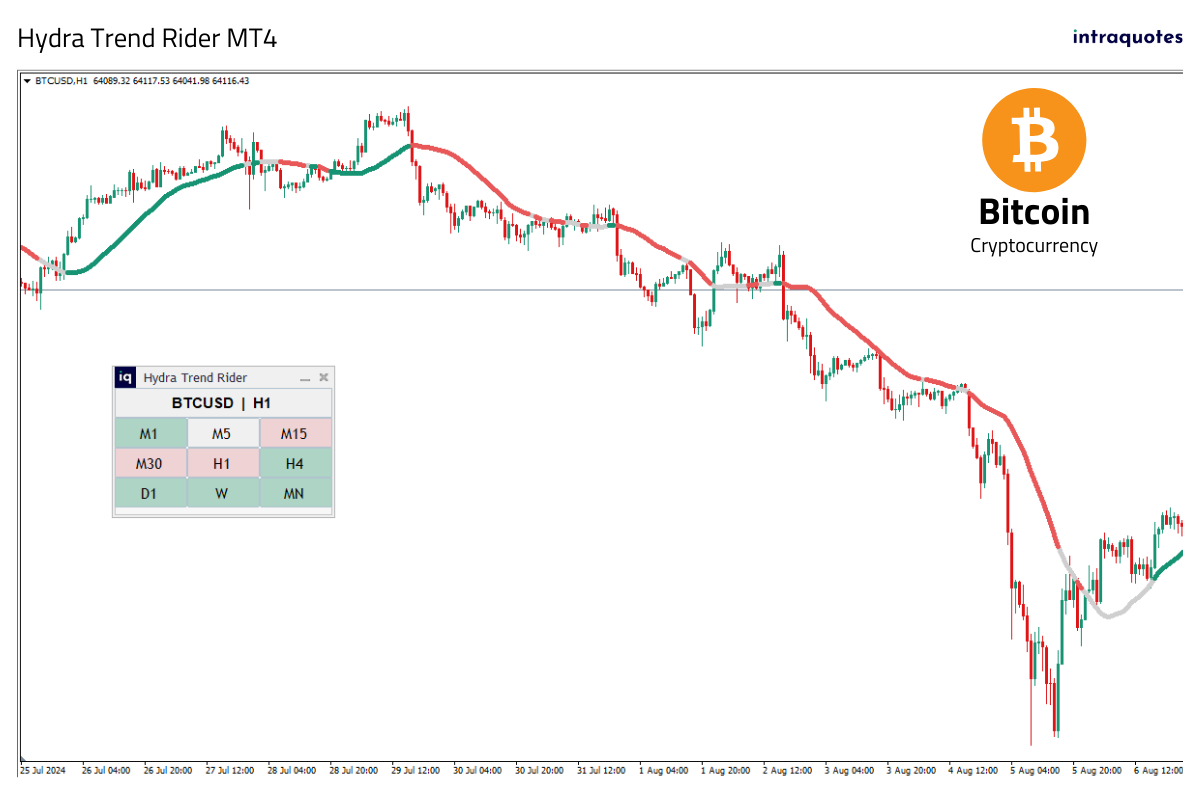
- Powerful Trend Signal:
Stay ahead of the market with our powerful trend signal feature. This tool helps you identify and capitalize on market trends, ensuring you can make timely and informed trading decisions.
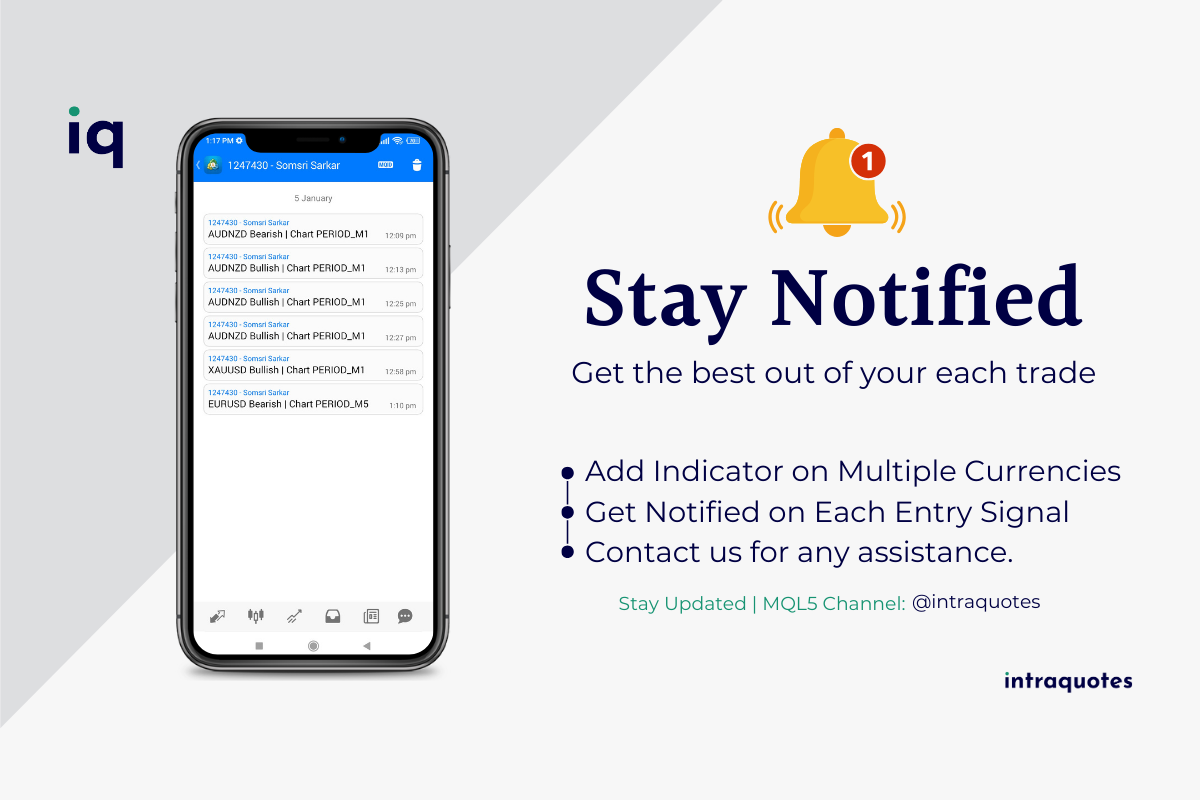
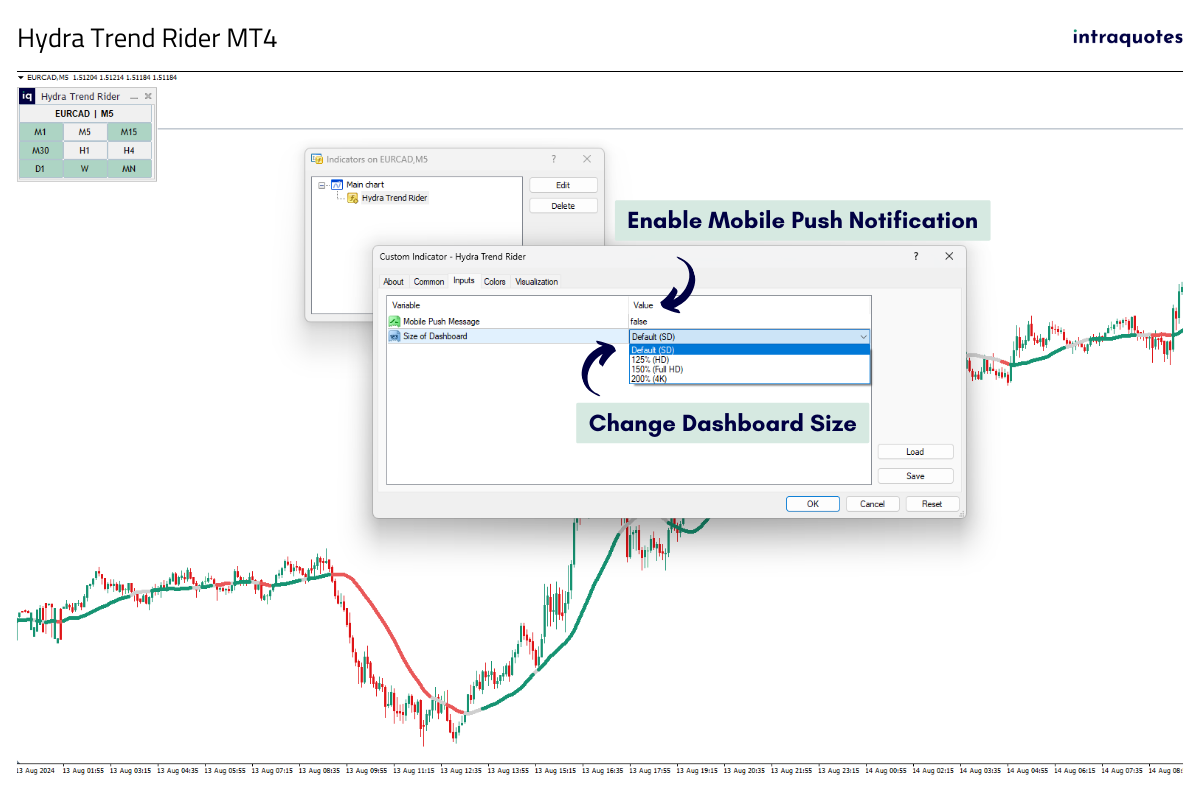
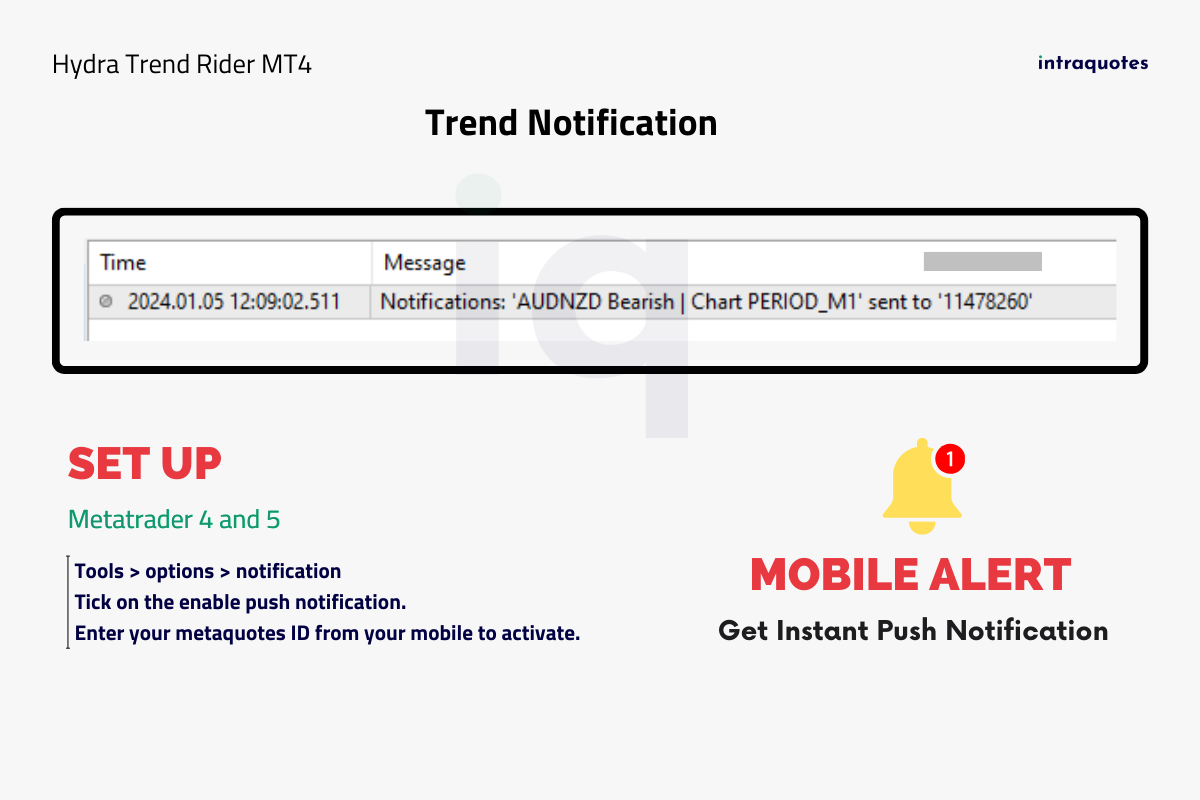
- Mobile Alert:
Stay connected and informed even on the go. With our mobile alert system, you will receive instant notifications on your smartphone, allowing you to react promptly to market changes and opportunities..
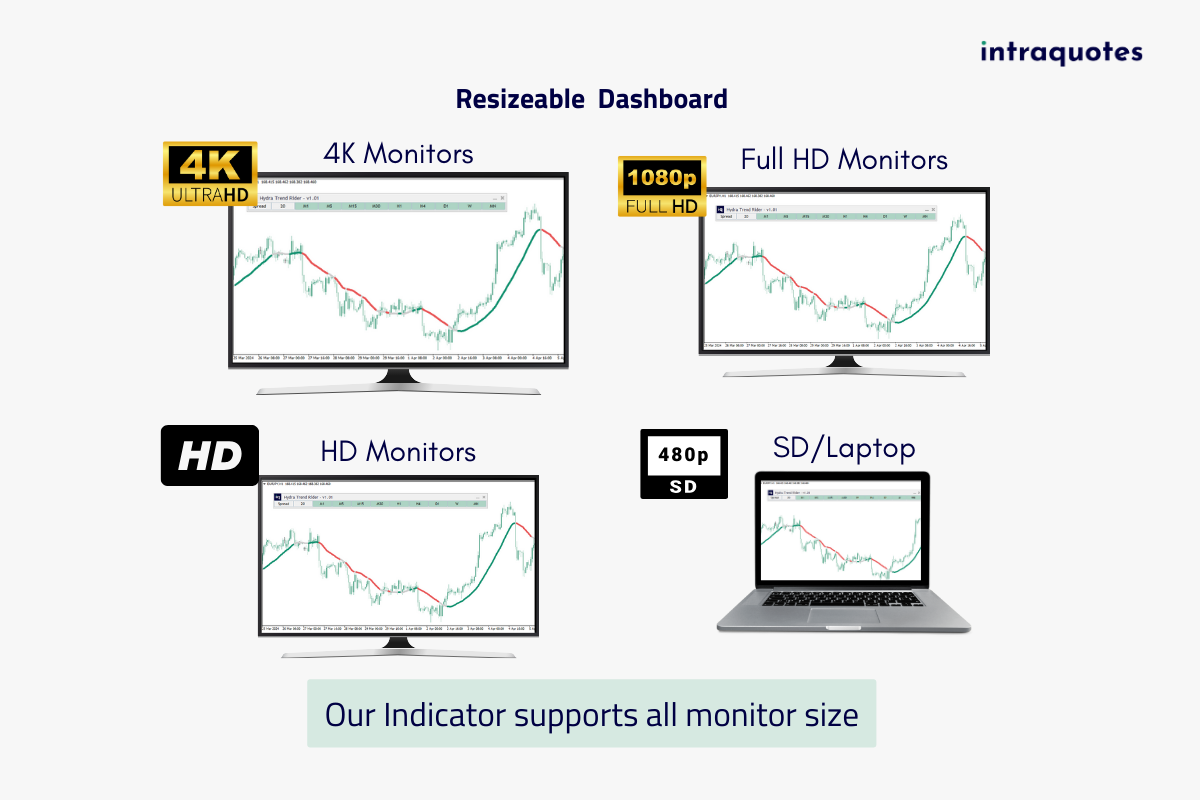
- Dashboard Customization:
Tailor the dashboard to fit your trading style and preferences. Choose from four dashboard sizes, ranging from standard to 4K. Dashboard can be moved anywhere on the screen, and can be minimized and restored as well, ensuring a seamless and comfortable trading experience on any monitor screen.
Advanced Strategies:
- Multiple Timeframe Strategy
Enhance your analysis by observing market behavior across multiple timeframes. This strategy allows you to confirm trends and make more accurate trading decisions.
- Trend Following
Utilize our trend-following feature as explained in the user guide to identify and follow market trends. This approach helps you to stay in profitable trades longer and maximize your gains.
- Trail Position
Optimize your exit plan with our trail position strategy. We will teach you how to adjust your stop-loss levels as the market moves in your favor, protecting your profits and minimizing risks.
- Spotting a Good Entry Signal
Our indicator excels in spotting optimal entry signals. This strategy enables you to enter trades at the most advantageous points, enhancing your potential for success.
- Entering a Trade After Correction
Powerful trends often corrects them before going even further. Hydra indicator can help you identify correction zones easily.
- Merging with Other Indicators
For enhanced trend confirmation, observe market price action and consider combining our indicator with others in your toolkit.
Indicator Troubleshooting:
Our user guide covers all the following topics with detailed solutions-
- How to get mobile alerts from MetaTrader Desktop
- How to do a Visual Backtest with Our Indicator
- Possible Issues with Backtesting
- Possible Issue with the Indicator Dashboard
Contact us:
For any issues, bug reports, or suggestions, feel free to contact us.
Service Limitation:
It is requested that purchases must be refrained from if the buyer is from India, Bangladesh, or Pakistan, as developer support for these regions is unavailable due to legal restrictions.
Risk Disclosure:
Our indicator doesn't guarantee future profits or losses. Trade responsibly, understanding that Intraquotes or the program developer is not liable for any incurred losses or the precision of signals. Our product serves as visual guidance, adding value to informed trading decisions.
Copyright © INTRAQUOTES a brand of Taracode International.