• 미리보기
  • 리뷰
  • 코멘트

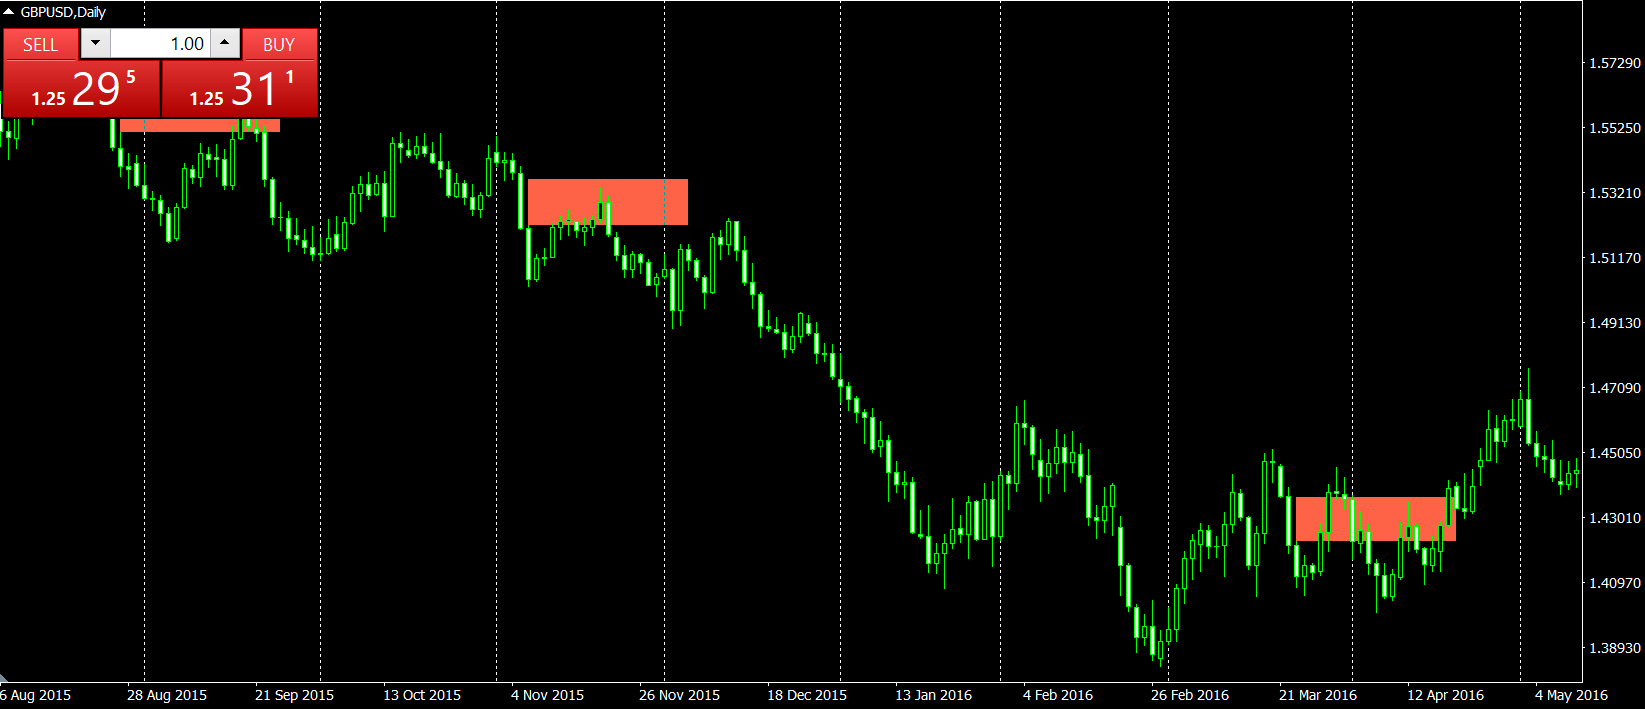
Fair Value Gap Indicator MT4

Are you searching for a tool that can uncover hidden market imbalances and guide your trading decisions? Look no further than the Fair Value Gap Indicator.

This powerful tool acts as a magnet, pulling the price back to its starting point before making a move. By identifying these gaps on charts, you can take advantage of bearish bias trades and predict potential future price movements with greater accuracy.

Created by a three-candle sequence, the Fair Value Gap Indicator is suitable for both bullish and bearish trades. It empowers you to make informed decisions and spot market inefficiencies like never before.

Don't hesitate, start using the Fair Value Gap Indicator today and elevate your trading game.

Understanding the Fair Value Gap

To understand the Fair Value Gap, analyze large candles with neighboring candles' wicks not fully overlapping within a three-candle sequence, indicating buying or selling imbalances in the market.

Fair value gaps, also known as FVGs, are visualized as significant price discrepancies that occur when the wicks of adjacent candles don't completely overlap. These gaps provide valuable insights into market dynamics and can act as magnets for future price movements.

The concept of fair value gaps revolves around the idea that when the price fills the gap before a downward move, it acts as a magnet, pulling the price back to its starting point before continuing higher. This pattern is often observed in bearish bias trades. Traders use fair value gaps to identify potential entry or exit points, as they indicate market imbalances and predict future price movements.

The Fair Value Gap indicator, available on the TrendSpider platform, simplifies the process of identifying and analyzing fair value gaps. By providing visual cues, it helps traders effortlessly spot potential trading opportunities.

To effectively trade fair value gaps, it's essential to understand their significance in price movement and use them in conjunction with other technical analysis tools for confirmation. By creating custom scans to identify and track fair value gaps, traders can stay updated on potential trading opportunities in real-time.

Factors Influencing the Fair Value Gap

Factors influencing the Fair Value Gap include the presence of significant bearish or bullish candlesticks, indicating undervalued or overrated fair value gaps, respectively. These candlesticks provide valuable information about market sentiment and can help traders identify potential trading opportunities.

When there's a bearish candlestick pattern, it suggests that the market is experiencing selling pressure and the fair value gap may be undervalued. This could indicate a potential opportunity to enter a short trade, anticipating a downward move.

On the other hand, a bullish candlestick pattern suggests buying pressure and an overrated fair value gap. Traders can use this information to consider entering a long trade, expecting the price to rise.

By analyzing these candlestick patterns, traders can gain insights into market imbalances and inefficiencies, allowing them to make more informed trading decisions.

The fair value gap indicator serves as a useful tool for identifying and analyzing fair value gaps, helping traders navigate the market and uncover potential trading opportunities.

Interpreting the Fair Value Gap Indicator

First, analyze the Fair Value Gap Indicator to gain insights into potential market imbalances and trading opportunities. The Fair Value Gap Indicator is a valuable tool for price action traders to identify market imbalances and make informed trading decisions.

By analyzing fair value gaps on charts, traders can identify potential market gaps and predict future price movements. These gaps can indicate bullish or bearish bias trades when the price fills the gap before a move in the respective direction.

For bullish trades, the fair value gap acts as a magnet that pulls the price back to its starting point before continuing higher. On the other hand, for bearish trades, the fair value gap acts as a magnet that pulls the price back to its starting point before continuing lower.

Traders can use the Fair Value Gap Indicator to identify potential entry or exit points, leveraging them for potential market opportunities. This indicator is a powerful tool for price action traders to identify market imbalances and make profitable trading decisions.

Using the Fair Value Gap in Investment Analysis

Analyze the Fair Value Gap Indicator to incorporate it into your investment analysis and identify potential market imbalances and trading opportunities.

The Fair Value Gap Indicator is a powerful tool that can enhance your investment analysis by providing visual cues for potential trading opportunities. By utilizing this indicator, you can visualize areas of potential market imbalances and predict future price movements.

The Fair Value Gap Indicator highlights fair value gaps on charts, allowing you to identify and track these value gaps as they form. These gaps can act as magnets for future price movement, indicating potential entry or exit points for your trades.

By understanding the significance of fair value gaps in price action analysis, you can make informed trading decisions. Incorporating the Fair Value Gap Indicator into your investment analysis can help you identify market inefficiencies and imbalances, giving you an edge in the market.

It's a valuable tool that can assist you in identifying potential trading opportunities and optimizing your trading strategy.

Limitations of the Fair Value Gap Indicator

To fully understand the Fair Value Gap Indicator, it's important to acknowledge its limitations.

While this indicator can help identify potential market imbalances and predict future price movements, it isn't foolproof and should be used alongside other technical analysis methods.

Value gaps occur based on a three-candle sequence, but external factors and unexpected market developments can impact whether or not these gaps get filled, affecting the reliability of predictions made solely on the indicator.

Additionally, the Fair Value Gap Indicator may not be directly usable in the scanner on the TrendSpider platform, limiting its application for scanning and identifying potential trading opportunities. Therefore, it's crucial for traders to use other technical analysis tools to confirm potential trading opportunities presented by Fair Value Gaps.

Relying solely on the indicator may not provide sufficient information for making trading decisions.


In conclusion, the Fair Value Gap Indicator is a powerful tool for price action traders to spot market inefficiencies and imbalances. By analyzing fair value gaps on charts, traders can make informed decisions and take advantage of bearish bias trades.

This indicator acts as a magnet, pulling the price back to its starting point before continuing higher.

With the Fair Value Gap Indicator in your arsenal, you can accurately predict potential future price movements and elevate your trading to new


추천 제품
Reversal Monster Mini
Abdulfattah Yahya Mohammed Alhazmi
The Most advanced and comprehensive EA to trade Trend Reversals/Pullbacks It is a very profitable EA, to trade trends breakout, and manage trades, takeprofit, stoploss, move to breakeven, and trailing stop. The   “Reversal Monster EA”   trades Reversal/Pullbacks when the current price of the pair pullback to a predefined horizontal level or trendline on the currency chart. The opening of the position can be immediate after pullback to the drawn trendline or after closing the candle below/abov
FREE
Hot Zones
Innovicient Limited
5 (1)
This indicator simplifies your entry zones by displaying the areas where you can plan your entry that potentially could give you high risk/reward ratios. Other than picking the most optimal entry points, the Hot Zone indicator can act as your typical support/resistance indicator for pullbacks for all timeframes. You can use this indicator as the only trading indicator or use it with another indicator for reentry purposes.  Besides, when using Hot Zones, the risk/reward ratio should be well abov
Fibo Engulfing MA Plus Changer TS Indie
Opengates Success International
Fibo Engulfing Changer Trading System Fibo Engulfing Changer Trading System is a great indicator created to locate an engulfing candle on the Chart with the aid of an Arrow and Popup alerts system. For accurate working of an engulfing candle based on market structure, it must be used with an Moving Average but we discovered that Moving average is subjected to individual trader's preferences, therefore it has been coded in a way that the Trader can choose MA he/she desires with a preferred PER
Extremum Reverse Bar
Yurij Izyumov
3.55 (11)
This indicator has been created for finding the probable reversal points of the symbol price. A small candlestick reversal pattern is used it its operation in conjunction with a filter of extremums. The indicator is not redrawn! If the extremum filter is disabled, the indicator shows all points that have a pattern. If the extremum filter is enabled, the condition works – if the history Previous bars 1 candles back contains higher candles and they are farther than the Previous bars 2 candle, such
FREE
ChartTrader is a professional trading tool that every trader needs in their toolbox. It has been developed to work with the MT4 Platform. ChartTrader offers a number of options to make placing orders in the Forex market quick and easy. The GUI sits on the chart window so there is no need to navigate to separate windows when placing orders. The program allows you to set pending and instant orders. It has a built in risk management system, so every trade can risk a percentage or a fixed amount in
Max LotSize
Luis Alberto Atuncar Sanchez
5 (3)
LotSize Indicator Discover the appropriate lot size to use in your trades based on the available margin. This indicator provides valuable information for risk management. If the indicator shows a value of 0, it means that your balance or available margin is insufficient for trading. It is important to maintain adequate margin levels for safe trading practices. This indicator is exclusively designed for the MT4 platform, a popular and reliable trading platform in the market. With the LotSize Indi
FREE
This EA is an extension for the free trade indicator Trend Mate . https://www.mql5.com/en/market/product/50082 The main idea is to support your decision to  trade  according to the current trend. It is possible to configure alert and push notification to receive when entering to first candle for bull / bear trend. For this extension of the free indicator now it is possible to filter the current trend info with other timeframes. For example show trend for timeframe M5 considering also timefra
Indicator LTS for MT4(Level + Trends + Speed)   The LTS indicator was specially created for quick analysis of   consolidations on the chart , which greatly facilitates decision-making when trading. LTS marks resistance and gives information about the forces affecting it, as well as the current speed and average travel. The indicator is easily customizable and can analyze any timeframe.    LTS uses a   unique trend analysis algorithm based on 4 parameters   from global to local.
PZ Penta O MT4
PZ TRADING SLU
2.25 (4)
The Penta-O is a 6-point retracement harmonacci pattern which usually precedes big market movements. Penta-O patterns can expand and repaint quite a bit. To make things easier this indicator implements a twist: it waits for a donchian breakout in the right direction before signaling the trade. The end result is an otherwise repainting indicator with a very reliable trading signal. The donchian breakout period is entered as an input. [ Installation Guide | Update Guide | Troubleshooting | FAQ | A
FREE
Dollar Mint Indicator
David Mwaniki Mbugua
Dollar mint indicator is a special workmanship with years of experience in forex.   Dollar mint ea is a fully non repaint indicator optimised with price action data such that once it gives you a signal t . The indicator   can be used to trade anything on the mt4 with much ease. Benefits ; Fully non repaint Use in any timeframe Use in all the available tradable assets on mt4 Best to use on h4. It generates fully analysed buy and sell signals based on trend and also filters out retracement
Pip Show - MultiStrategy Trading   The indicator is for free and you have to install it before you can use the Pip Show - MultiStrategy Trading EA. The use of the indicator is very simple, on green open buy positions and on red open sell positions. Its based on a MA calculation. Check out my fully automatic trading robot  multistrategy-trading.com It has four parameters: Period, Divisor ("speed"), Price and TimeFrame Period - how many candles , backwards, are calculating Divisor - how "quick" is
FREE
Awesome Oscillator by Bill Williams with the ability to fine-tune and replace the averaging algorithms of the indicator, which significantly expands the possibilities of using this oscillator in algorithmic trading and brings it closer in its properties to such an indicator as the MACD. To reduce price noise, the final indicator is processed with an additional Smooth averaging. The indicator has the ability to give alerts, send mail messages and push signals when the direction of movement of th
Rainbow MT4
Jamal El Alama
Rainbow MT4 is a technical indicator based on Moving average with period 34 and very easy to use. When price crosses above MA and MA changes color to green, it’s a signal to buy. When price crosses below MA and MA changes color to red, it’s a signal to sell. The Expert advisor ( Rainbow EA MT4) based on Rainbow MT4 indicator, as you can see in the short video below is now available here .
FREE
"Adjustable Fractals" - 프랙탈 표시기의 고급 버전으로 매우 유용한 거래 도구입니다! 우리가 알고 있듯이 표준 프랙탈 mt4 표시기에는 설정이 전혀 없습니다. 이는 거래자에게 매우 불편합니다. 조정 가능한 프랙탈(Adjustable Fractals)이 해당 문제를 해결했습니다. 필요한 모든 설정이 포함되어 있습니다. 조정 가능한 표시 기간(권장 값 - 7 이상) 고점/저점과의 거리 조절 가능 프랙탈 화살표에 따라 조정 가능한 디자인 // 더 훌륭한 전문가 자문 및 지표는 여기에서 확인할 수 있습니다: https://www.mql5.com/en/users/def1380/seller // 또한 수익성 있고 안정적이며 신뢰할 수 있는 신호 https://www.mql5.com/en/signals/1887493에 참여하실 수 있습니다. 본 MQL5 홈페이지에서만 제공되는 오리지널 제품입니다.
Lot Lines Calculator
Vyacheslav Ustinov
Most professional traders declare strict compliance with risk management. This simple tool allows quick calculation of trading lot size in accordance with the following basic risk management rules: The maximum allowable risk is set as a fixed percentage of the account deposit (for example, 1-2%). The risk is measured as a distance in points between the order opening level and the stop loss level. It is always difficult for beginners to calculate trade lot based on the risk value, so this indicat
Trend Catcher with Alert
Issam Kassas
4.84 (62)
트렌드 캐쳐: 알림 인디케이터와 함께 하는 트렌드 캐쳐 전략은 시장 트렌드와 잠재적인 진입 및 체크 포인트를 식별하는 데 도움이 되는 다목적 기술 분석 도구입니다. 이는 시장 상황에 적응하여 트렌드 방향을 명확하게 시각적으로 표현하는 동적 트렌드 캐쳐 전략을 제공합니다. 트레이더는 선호도와 위험 허용도에 맞게 매개변수를 사용자 정의할 수 있습니다. 이 인디케이터는 트렌드 식별을 지원하고 잠재적인 반전을 신호로 제공하며 트레일링 스탑 메커니즘으로 작동하며 실시간 경고를 제공하여 신속한 시장 대응을 돕습니다. 특징: - 트렌드 식별: 상승 트렌드와 하락 트렌드를 신호합니다. - 트렌드 반전: 양봉 색상이 상승에서 하락으로 변경되거나 그 반대의 경우 잠재적인 반전을 경고합니다. - 실시간 경고: 새로운 트렌드 식별을 위한 경고를 생성합니다. 추천사항: - 통화 및 페어: EURUSD, AUDUSD, XAUUSD 등... - 시간 프레임: H1. - 계정 유형: 모든 E
FREE
Delete All
Sergio D. Rocha
4 (1)
This is a very silly script but perhaps you find it useful. It deletes all objects from the chart. I recommend setting a hot key to call it just by pressing a couple of keys on your keyboard.  To avoid accidental deletion of object, the script will ask you to confirm the action as you won't be available to restore them with "undo" (Ctrl+Z).
FREE
The “ Ticks Overcome Signal ” indicator, as outlined in your provided code, is a custom tool designed for use with MetaTrader 4 (MT4), a popular platform for Forex trading. This indicator seems to focus on tracking the momentum and direction of price movements by counting consecutive up and down ticks. Here’s an overview of the psychological aspects, logic benefits, and usage instructions for this indicator on MT4: Decision Support : Traders often face psychological challenges in decision-making
FREE
The indicator displays price distribution on a horizontal histogram. Horizontal histogram help find out key levels of price so that you can make good decision on setting point of take profit, stop loss... You can improve exist trading strategy or get new trading idea with the histogram of price. Outstanding features Support multiple time frame : you can choose to work with history data in any time frame you want. It does not depend on current display time frame. Support weighting by volume a
FREE
Introduction to X3 Chart Pattern Scanner X3 Cherart Pattern Scanner is the non-repainting and non-lagging indicator detecting X3 chart patterns including Harmonic pattern, Elliott Wave pattern, X3 patterns, and Japanese Candlestick patterns. Historical patterns match with signal patterns. Hence, you can readily develop the solid trading strategy in your chart. More importantly, this superb pattern scanner can detect the optimal pattern of its kind. In addition, you can switch on and off individu
With the purchase of the   Auto-Harmonic Pattern Recognition Trading Software for MT4 , you will have access to: The Auto Harmonic Pattern recognition software is designed to take the heavy lifting out of a traders Harmonic trading strategy. The Software automatically Identifies and Projects Harmonic Pattern Completion Zones for the 6 most trade-able Harmonic Patterns.  If the Pattern Completes in the projected zone, then there is a high probability of the resulting trade being successful. Pleas
Trade History Drawer
David Leander Tschacher
Trade History Drawer is an indicator for MetaTrader 4. It shows trades on the chart and draws them in customized colors. Furthermore, the indicator shows a trade summary and saves a CSV history file for either one selected pair or all pairs. Inputs General Settings Number Trades : Number of trades to be drawn on the chart, if -1 then all trades Magic Number : Only trades with this magic number, if -1 then ignore Line Style : Line Style Line Thickness : Line Thickness Arrow Size :
MT4용 외환 지표 "ATR 트레일링 스톱" MT4용 훌륭한 보조 ATR 추적 중지 지표로 거래 방법을 업그레이드하세요. 이 표시기는 후행 중지 목적에 적합합니다. ATR Trailing Stop은 시장 변동성에 자동으로 적응합니다. 지연이 없고 설정이 쉽습니다. 이 지표는 주요 추세 방향으로의 가격 조치 항목과 결합하는 데 탁월합니다. // 더 훌륭한 전문가 자문 및 지표는 여기에서 확인할 수 있습니다: https://www.mql5.com/en/users/def1380/seller // 또한 수익성 있고 안정적이며 신뢰할 수 있는 신호 https://www.mql5.com/en/signals/1887493에 참여하실 수 있습니다. 본 MQL5 홈페이지에서만 제공되는 오리지널 제품입니다.
We present you the indicator "Candle closing counter", which will become your indispensable assistant in the world of trading. That’s why knowing when the candle will close can help: If you like to trade using candle patterns, you will know when the candle will be closed. This indicator will allow you to check if a known pattern has formed and if there is a possibility of trading. The indicator will help you to prepare for market opening and market closure. You can set a timer to create a p
TSim
Sergey Kruglov
Утилита  TSim   позволяет симулировать ручную торговлю в Тестере Стратегий MetaTrader 4. В панеле можно устанавливать размеры лота, тейпрофита и стоплосса. Панель имеет кнопки Sell   и Buy для выставления рыночных ордеров, а также кнопки CloseSell, CloseBuy и CloseAll для быстрого закрытия ордеров. Под панелью отображается список открытых ордеров. Внимание. Панель работает только в Визуальном режиме Тестера Стратегий MetaTrader 4.
FREE
This dynamic indicator allows you to measure retracements of price between any two points in either direction. It displays the price points, percentages and also displays the extension levels. User may Modify and Add addition levels and extensions." User may also Add multiple Fibonacci indicators on the chart and change their colors,   style and sizes. Can be used on any timeframe. This is the only Fibonacci Tool you'll need to measure and trade on Structure. MT5 Version Available as we
FREE
Wise Men Indicator
Bohdan Kasyanenko
The indicator displays signals according to the strategy of Bill Williams on a chart: 1. Signal "First Wise Man" is formed when there is a divergent bar with angulation. A bullish divergent bar has a lower minimum and the closing price in its upper half. A bearish divergent bar has a higher maximum and the closing price at the bottom half. Angulation is formed when all three lines of Alligator are intertwined, and the price has gone up significantly(or downwards). A valid bullish/bearish div
Market Profile is a graphic representation that shows price and time information as a distribution. The benefits of Market Profile include: Determine amount of time, number of ticks and volume traded at specific price levels or price ranges during a period Identify prices perceived as fair by the market Identify support and resistance levels to anticipate future price movements Each group of letters shows the price or price range where trades occured, usually in the 30 minutes chart timeframe. T
Market Marker MT4
Evgeny Shevtsov
4.5 (8)
The indicator displays peak levels of activity formed by the maximum volume, tracks the correlation of the candles on all timeframes (from the highest to the lowest one). Each volume level is a kind of key trading activity. The most important cluster is inside a month, week, day, hour, etc. Indicator operation features A volume level receives Demand status if the nearest volume level located to the left and above has been broken upwards. A volume level receives Supply status if the nearest vol
Trend Ray
Andriy Sydoruk
The indicator shows the potential trend direction by cyclical-wave dependence. Thus, all the rays of the intersection will be optimal rays, in the direction of which the price is expected to move, taking into account the indicator period. Rays can be used as a direction for potential market movement. But we must not forget that the approach must be comprehensive, the indicator signals require additional information to enter the market.
이 제품의 구매자들이 또한 구매함
Advanced Currency Strength28 Indicator
Bernhard Schweigert
4.91 (665)
현재 26% 할인 초보자 또는 전문가 트레이더를 위한 최고의 솔루션! 이 지표는 우리가 독점 기능과 새로운 공식을 통합했기 때문에 독특하고 고품질이며 저렴한 거래 도구입니다. 단 하나의 차트로 28 Forex 쌍의 통화 강도를 읽을 수 있습니다! 새로운 추세 또는 스캘핑 기회의 정확한 트리거 포인트를 정확히 찾아낼 수 있기 때문에 거래가 어떻게 개선될지 상상해 보십시오. 사용 설명서: 여기를 클릭  https://www.mql5.com/en/blogs/post/697384 그것이 첫 번째, 원본입니다! 쓸모없는 지망생 클론을 사지 마십시오. 더 스페셜  강력한 통화 모멘텀을 보여주는 하위 창의 화살표 GAP가 거래를 안내합니다! 기본 또는 호가 통화가 과매도/과매도 영역(외부 시장 피보나치 수준)에 있을 때 개별 차트의 기본 창에 경고 표시가 나타납니다. 통화 강도가 외부 범위에서 떨어질 때 풀백/반전 경고. 교차 패턴의 특별 경고 추세를 빠르게 볼 수 있는
Scalper Inside PRO
Alexey Minkov
4.74 (58)
An exclusive indicator that utilizes an innovative algorithm to swiftly and accurately determine the market trend. The indicator automatically calculates opening, closing, and profit levels, providing detailed trading statistics. With these features, you can choose the most appropriate trading instrument for the current market conditions. Additionally, you can easily integrate your own arrow indicators into Scalper Inside Pro to quickly evaluate their statistics and profitability. Scalper Inside
TPSpro RFI Levels
Roman Podpora
4.85 (20)
Reversal First Impulse levels (RFI)    INSTRUCTIONS        RUS       -       ENG              R ecommended to use with an indicator   -   TREND PRO -  Version MT5 A key element in trading is zones or levels from which decisions to buy or sell a trading instrument are made. Despite attempts by major players to conceal their presence in the market, they inevitably leave traces. Our task was to learn how to identify these traces and interpret them correctly. Main functions: Displaying active zones
Atomic Analyst
Issam Kassas
5 (3)
우선적으로 언급할 점은이 거래 지표가 다시 그리지 않고 지연되지 않으며 이를 통해 수동 및 로봇 거래 모두에 이상적이라는 점입니다. 사용자 매뉴얼: 설정, 입력 및 전략. Atomic Analyst는 가격의 강도와 모멘텀을 활용하여 시장에서 더 나은 이점을 찾는 PA Price Action Indicator입니다. 고급 필터를 장착하여 잡음과 거짓 신호를 제거하고 거래 잠재력을 높이는 데 도움이 됩니다. 복잡한 지표의 다중 레이어를 사용하여 Atomic Analyst는 차트를 스캔하고 복잡한 수학적 계산을 간단한 신호와 색상으로 변환하여 초보 트레이더가 이해하고 일관된 거래 결정을 내릴 수 있도록합니다. "Atomic Analyst"는 새로운 및 경험이 풍부한 트레이더를위한 종합적인 거래 솔루션입니다. 프리미엄 지표와 최고 수준의 기능을 하나의 거래 전략에 결합하여 모든 종류의 트레이더에 대한 다재다능한 선택지가되었습니다. 인트라데이 거래 및 스캘핑 전략 : 빠르고 정확한
Enigmera
Ivan Stefanov
5 (3)
에니메라: 시장의 핵심 https://www.enigmera.com 소개 이 지표 및 트레이딩 시스템은 금융 시장에 대한 놀라운 접근 방식입니다. 에니메라는 프랙탈 주기를 사용하여 지지선과 저항선을 정확하게 계산합니다. 진정한 축적 단계를 보여주고 방향과 목표를 제시합니다.  추세에 있든 조정에 있든 작동하는 시스템입니다.  어떻게 작동하나요? 에니메라는 지지선/저항선, 목표선, 편차선의 세 가지 라인으로 구성됩니다. 이 시스템은 과거 데이터를 현재와 미래로 추정하는 일반적인 시장 지표와 달리 현재에 대한 완전한 그림을 제공합니다. 지지선 위에 있으면 실제 지지를 의미하고 저항선 위에 있으면 실제 저항을 의미합니다. 레벨이 깨지면 추세의 변화를 나타냅니다. 다시 그리지 않습니다. 시장이 지속적으로 진화함에 따라 에니메라는 평가 도구를 조정하여 전략을 정기적으로 수정합니다.   이를 통해 모든 시나리오를 철저히 평가할 수 있습니다. 이 시장 지표의 고유성은 분명하며 그 기
현재 20% 할인 ! 초보자 또는 전문가 트레이더를 위한 최고의 솔루션! 이 대시보드 소프트웨어는 28개의 통화 쌍에서 작동합니다. 2가지 주요 지표(Advanced Currency Strength 28 및 Advanced Currency Impulse)를 기반으로 합니다. 전체 Forex 시장에 대한 훌륭한 개요를 제공합니다. 고급 통화 강도 값, 통화 이동 속도 및 모든(9) 시간대의 28 Forex 쌍에 대한 신호를 보여줍니다. 추세 및/또는 스캘핑 기회를 정확히 파악하기 위해 차트의 단일 지표를 사용하여 전체 시장을 볼 수 있을 때 거래가 어떻게 개선될지 상상해 보십시오! 잠재적인 거래를 식별하고 확인하면서 강력한 통화와 약한 통화를 더욱 쉽게 식별할 수 있도록 이 지표에 기능을 내장했습니다. 이 표시기는 통화의 강세 또는 약세가 증가 또는 감소하는지 여부와 모든 시간대에서 수행되는 방식을 그래픽으로 보여줍니다. 추가된 새로운 기능은 현재 시장 조건 변화에 적
TPSproTREND PrO
Roman Podpora
4.78 (18)
TPSpro TRENDPRO  - is a trend indicator that automatically analyzes the market and provides information about the trend and each of its changes, as well as giving signals for entering trades without redrawing! The indicator uses each candle, analyzing them separately. referring to different impulses - up or down impulse. Exact entry points into transactions for currencies, crypto, metals, stocks, indices!  -  Version MT5               DETAILED DESCRIPTION                R ecommended to use with
Advanced Supply Demand
Bernhard Schweigert
4.92 (313)
현재 33% 할인! 초보자나 전문 트레이더를 위한 최고의 솔루션! 이 보조지표는 우리가 다수의 독창적 기능과 새로운 공식을 통합한 독특하고 고품질이며 저렴한 거래 도구입니다. 이 업데이트를 통해 이중 시간대를 표시할 수 있습니다. 더 높은 TF를 표시할 수 있을 뿐만 아니라 차트 TF와 더 높은 TF 모두를 표시할 수 있습니다: 중첩 영역 표시. 모든 Supply Demand 트레이더들이 좋아할 것입니다. :) 중요한 정보 공개 Advanced Supply Demand의 잠재력을 극대화하려면 다음을 방문하십시오. https://www.mql5.com/ko/blogs/post/720245   진입 또는 목표의 명확한 트리거 포인트를 정확히 찾아냄으로 해서 거래가 어떻게 개선될지 상상해 보십시오. 새로운 알고리즘을 기반으로 매수자와 매도자 간의 잠재적인 불균형을 훨씬 더 쉽게 분간할 수 있습니다. 왜냐하면 가장 강한 공급영역과 가장 강한 수요 영역과 과거에 어떻게 진행 되었는지를(이
FX Power MT4 NG
Daniel Stein
5 (11)
모닝 브리핑 여기 mql5 와 텔레그램에서 FX Power MT4 NG 는 오랫동안 인기 있는 통화 강도 측정기인 FX Power의 차세대 버전입니다. 이 차세대 강도 측정기는 무엇을 제공합니까? 기존 FX Power에서 좋아했던 모든 것 PLUS GOLD/XAU 강도 분석 더욱 정밀한 계산 결과 개별 구성 가능한 분석 기간 더 나은 성능을 위한 사용자 정의 가능한 계산 한도 특별 멀티더 많은 것을보고 싶은 사람들을위한 특별한 다중 인스턴스 설정 모든 차트에서 좋아하는 색상을위한 끝없는 그래픽 설정 수많은 알림 옵션, 중요한 것을 다시는 놓치지 않도록 Windows 11 및 macOS 스타일의 둥근 모서리가 있는 새로운 디자인 마법처럼 움직이는 인디케이터 패널 FX 파워 키 특징 모든 주요 통화의 완전한 강세 이력 모든 시간대에 걸친 통화 강세 이력 모든 브로커 및 차트에서 고유 계산 결과 100% 신뢰할 수있는 실시간100 % 신뢰할 수있는 실시간 계산-> 다시 칠하지 않음
Quantum Trend Sniper Indicator MT4
Bogdan Ion Puscasu
4.6 (40)
소개       Quantum Trend Sniper Indicator는   추세 반전을 식별하고 거래하는 방식을 변화시키는 획기적인 MQL5 지표입니다! 13년 이상의 거래 경험을 가진 숙련된 트레이더 팀이 개발한       Quantum Trend Sniper 표시기       매우 높은 정확도로 추세 반전을 식별하는 혁신적인 방법으로 거래 여정을 새로운 차원으로 끌어올리도록 설계되었습니다. ***Quantum Trend Sniper Indicator를 구입하면 Quantum Breakout Indicator를 무료로 받을 수 있습니다!*** Quantum Trend Sniper Indicator는 추세 반전을 식별하고 세 가지 이익실현 수준을 제안할 때 경고, 신호 화살표를 제공합니다. 초보자 거래자와 전문 거래자 모두에게 적합합니다. Quantum EA 채널:       여기를 클릭하세요 MT5 버전:       여기를 클릭하세요
FX Volume
Daniel Stein
4.6 (35)
모닝 브리핑을 통해 세부 정보와 스크린샷으로 매일 시장 업데이트를 받으세요 여기 mql5 및 텔레그램에서 FX 거래량은 브로커의 관점에서 시장 심리에 대한 실제 통찰력을 제공하는 최초이자 유일한 거래량 지표입니다. 브로커와 같은 기관 시장 참여자가 외환 시장에서 어떤 포지션을 취하고 있는지에 대한 훌륭한 통찰력을 COT 보고서보다 훨씬 빠르게 제공합니다. 차트에서 이 정보를 직접 확인하는 것은 트레이딩의 진정한 판도를 바꾸고 획기적인 솔루션입니다. 다음과 같은 고유한 시장 데이터 인사이트의 이점 비율 는 통화의 매수/매도 포지션 비율을 백분율로 표시 비율 변화 는 선택한 기간 내 매수 비율과 비율 변화를 표시 총 거래량 는 해당 통화의 총 거래량(롱 및 숏)을 로트 단위로 보여줍니다 Volumes Long 는 해당 통화의 모든 롱 포지션의 거래량을 보여줍니다 Volumes Short 는 해당 통화의 모든 숏 포지션의 거래량을 보여줍니다 Net Long 는 순 롱 포지션의 거래량
PRO Renko System
Oleg Rodin
5 (25)
PRO Renko System 은 RENKO 차트 거래를 위해 특별히 고안된 매우 정확한 거래 시스템입니다. 이것은 다양한 거래 상품에 적용될 수있는 보편적 인 시스템입니다. 체계는 효과적으로 당신에게 정확한 반전 신호에 접근을 주는 소위 시장 소음을 중화합니다. 이 표시기는 사용하기가 매우 쉽고 신호 생성을 담당하는 매개 변수가 하나만 있습니다. 당신은 쉽게 당신의 선택의 어떤 무역 계기에 공구를 적응시킬 수 있고 renko 막대기의 크기. 나는 항상 당신이 내 소프트웨어로 수익성있게 거래 할 수 있도록 추가 지원을 제공 할 준비가되어 있습니다! 나는 당신에게 행복하고 수익성있는 거래를 기원합니다! 구매 후 저에게 연락하십시오! 내 렌코 차트 생성기를 보내드립니다. 또한 내 개인 권장 사항 및 시스템의 다른 모듈을 무료로 공유 할 것입니다!
Currency Strength Exotics
Bernhard Schweigert
4.88 (33)
현재 20% 할인! 초보자 또는 전문가 트레이더를 위한 최고의 솔루션! 이 표시기는 Exotic Pairs Commodities, Indexes 또는 Futures와 같은 기호에 대한 통화 강도를 표시하는 데 특화되어 있습니다. 금, 은, 석유, DAX, US30, MXN, TRY, CNH 등의 진정한 통화 강도를 보여주기 위해 9번째 줄에 모든 기호를 추가할 수 있습니다. 이것은 독특하고 고품질이며 저렴한 거래 도구입니다. 우리는 많은 독점 기능과 새로운 공식을 통합했습니다. 새로운 추세 또는 스캘핑 기회의 정확한 트리거 포인트를 정확히 찾아낼 수 있기 때문에 거래가 어떻게 개선될지 상상해 보십시오. 사용 설명서: 여기를 클릭 https://www.mql5.com/en/blogs/post/708876 모든 시간대에 작동합니다. TREND를 빠르게 확인할 수 있습니다! 새로운 기본 알고리즘을 기반으로 설계되어 잠재적인 거래를 더욱 쉽게 식별하고 확인할 수 있습니다.
Quantum Breakout Indicator PRO
Bogdan Ion Puscasu
4.96 (26)
소개       Quantum Breakout PRO   , 브레이크아웃 존 거래 방식을 변화시키는 획기적인 MQL5 지표! 13년 이상의 거래 경험을 가진 숙련된 트레이더 팀이 개발한   Quantum Breakout PRO는   혁신적이고 역동적인 브레이크아웃 영역 전략으로 거래 여정을 새로운 차원으로 끌어올리도록 설계되었습니다. Quantum Breakout Indicator는 5개의 이익 목표 영역이 있는 브레이크아웃 영역의 신호 화살표와 브레이크아웃 상자를 기반으로 한 손절 제안을 제공합니다. 초보자 거래자와 전문 거래자 모두에게 적합합니다. Quantum EA 채널:       여기를 클릭하세요 MT5 버전 :   여기를 클릭하세요 중요한! 구매 후 설치 매뉴얼을 받으려면 개인 메시지를 보내주십시오. 추천: 기간: M15 통화쌍: GBPJPY, EURJPY, USDJPY,NZDUSD, XAUUSD 계정 유형: 스프레드가 매우 낮은 ECN, Ra
Indicator : RealValueIndicator Description : RealValueIndicator is a powerful tool designed specifically for trading on the EURUSD pair. This indicator analyzes all EUR and USD pairs, calculates their real currency strength values, and displays them as a single realistic value to give you a head start on price. This indicator will tell you moves before they happen if you use it right. RealValueIndicator allows you to get a quick and accurate overview of the EURUSD currency pair tops and bottoms,
TakePropips Donchian Trend Pro
Eric John Pajarillaga Aldana
4.82 (17)
TakePropips Donchian Trend Pro   (MT4)는 Donchian 채널을 사용하여 추세의 방향을 자동으로 감지하고 진입 및 퇴장 거래 신호를 제공하는 강력하고 효과적인 도구입니다! 이 다기능 지표에는 추세 스캐너, 거래 신호, 통계 패널, 스크리너, 거래 세션 및 경고 내역 대시보드가 포함됩니다. 거래 신호를 제공하고 차트 분석 시간을 절약하도록 설계되었습니다! 다음 블로그 게시물에서 사용자 설명서 및 설치 가이드를 다운로드할 수 있습니다.   https://www.mql5.com/en/blogs/post/751368 오늘 50% 할인을 받으세요! 가격이 $98에서 $49로 인하되었습니다! 전략 테스터에서 이 지표를 테스트할 수 있습니다(비주얼 모드 활성화).  자세한 내용은 설명 아래에 비디오 자습서도 제공됩니다. 질문이 있거나 도움이 필요하면 저에게 연락하십시오. TakePropips Donchian Trend Pro 지표는 모든 Forex 쌍, 금속
Trend Screener
STE S.S.COMPANY
4.83 (88)
트렌드 표시기, 트렌드 트레이딩 및 필터링을 위한 획기적인 고유 솔루션, 하나의 도구 안에 내장된 모든 중요한 트렌드 기능! Forex, 상품, 암호 화폐, 지수 및 주식과 같은 모든 기호/도구에 사용할 수 있는 100% 다시 칠하지 않는 다중 시간 프레임 및 다중 통화 표시기입니다. Trend Screener는 차트에 점이 있는 화살표 추세 신호를 제공하는 효율적인 지표 추세 추종 지표입니다. 추세 분석기 표시기에서 사용할 수 있는 기능: 1. 트렌드 스캐너. 2. 최대 이익 분석이 있는 추세선. 3. 추세 통화 강도 측정기. 4. 경고가 있는 추세 반전 점. 5. 경고가 있는 강력한 추세 점. 6. 추세 화살표 Trend Screener Indicator가 있는 일일 분석 예, 일일 신호 성능...등은 여기에서 찾을 수 있습니다.   여기를 클릭하십시오. LIMITED TIME OFFER : Trend Screener Indicator는 50 $ 및 평생 동안만 사용할 수 있
Advanced Currency IMPULSE with ALERT
Bernhard Schweigert
4.91 (495)
현재 31% 할인!! 초보자 또는 전문가 트레이더를 위한 최고의 솔루션! 이 지표는 우리가 독점 기능과 비밀 공식을 통합했기 때문에 독특하고 고품질이며 저렴한 거래 도구입니다. 단 하나의 차트로 28개 통화 쌍 모두에 대한 경고를 제공합니다. 새로운 추세 또는 스캘핑 기회의 정확한 트리거 포인트를 정확히 찾아낼 수 있기 때문에 거래가 어떻게 개선될지 상상해 보십시오! 새로운 기본 알고리즘을 기반으로 구축되어 잠재적인 거래를 훨씬 더 쉽게 식별하고 확인할 수 있습니다. 이는 통화의 강세 또는 약세가 가속되는지 여부를 그래픽으로 표시하고 가속 속도를 측정하기 때문입니다. 자동차의 속도계처럼 생각하면 됩니다. 가속화할 때 Forex 시장에서 동일한 일이 분명히 더 빠르게 발생합니다. 즉, 반대 방향으로 가속화되는 통화를 페어링하면 잠재적으로 수익성 있는 거래를 식별한 것입니다. 통화 모멘텀의 수직선과 화살표가 거래를 안내합니다! 역동적인 Market Fibonacci 23
Up down v6T
Guner Koca
5 (1)
Thise indicator is up down v6  comes with tradingwiev pinescript. purchased people, after installed on terminal ,contact me on mql5  to get BONUS  TradingView pinescript. up-down indicator is no repaint and works all pairs and lower than weekly time frames charts. it is suitable also 1 m charts for all pairs. and hold long way to signal. dont gives too many signals. when red histogram cross trigger line that is up signal.and price probably will down when blue histogram cross trigger line that
Gold Channel XAUUSD
Paulo Rocha
5 (2)
Gold Channel is a volatility-based indicator, developed with a specific timing algorithm for the XAUUSD pair, which consists of finding possible corrections in the market. This indicator shows two outer lines, an inner line (retracement line) and an arrow sign, where the theory of the channel is to help identify overbought and oversold conditions in the market. The market price will generally fall between the boundaries of the channel. If prices touch or move outside the channel it is a tra
ECM Channel MT4
Paulo Rocha
5 (1)
ECM Elite Channel is a volatility-based indicator, developed with a specific time algorithm, which consists of finding possible corrections in the market. This indicator shows two outer lines, an inner line (retracement line) and an arrow sign, where the channel theory is to help identify overbought and oversold conditions in the market. The market price will generally fall between the boundaries of the channel. If prices touch or move outside the channel, it's a trading opportunity. The
Gann Signal
Kirill Borovskii
Gann Signal is a very simple indicator at first glance, but hidden inside is many years of experience in studying W.D.Ganna methods. The indicator gives accurate BUY/SELL signals, without redrawing. The indicator is very easy to use. All you need to do is attach it to your chart and follow its recommendations. The indicator constantly analyzes the market for entry opportunities. When such an opportunity appears, the indicator gives a signal in the form of an arrow. I repeat, all signals are NOT
Please send me Direct message on MQL5 CHAT after purchasing the Indicator for Training and Installation Support There are some additional files that is important to use with the Indicator . So be sure to contact me after purchasing the Indicator So that I can add you for training and support . If you find any difficulty with installation then send me Direct message here So that I can connect with you via Anydesk or Teamview for the product installation. " Smart Order Block Indicator " to find
TrendMaestro
Stefano Frisetti
5 (3)
note: this indicator is for METATRADER4, if you want the version for METATRADER5 this is the link:  https://www.mql5.com/it/market/product/108106 TRENDMAESTRO ver 2.4 TRENDMAESTRO recognizes a new TREND in the bud, he never makes mistakes. The certainty of identifying a new TREND is priceless. DESCRIPTION TRENDMAESTRO identifies a new TREND in the bud, this indicator examines the volatility, volumes and momentum to identify the moment in which there is an explosion of one or more of these data a
Basic Harmonic Patterns Dashboard
Mehran Sepah Mansoor
5 (2)
이 대시보드는 선택한 심볼에 대해 사용 가능한 최신 고조파 패턴을 표시하므로 시간을 절약하고 더 효율적으로 사용할 수 있습니다 / MT5 버전 . 무료 인디케이터: Basic Harmonic Pattern 인디케이터 열 Symbol : 선택한 심볼이 나타납니다 Trend : 강세 또는 약세 Pattern : 패턴 유형(가틀리, 나비, 박쥐, 게, 상어, 사이퍼 또는 ABCD) Entry : 진입 가격 SL: 스톱로스 가격 TP1: 1차 테이크프로핏 가격 TP2: 2차 테이크프로핏 가격 TP3: 3차 테이크프로핏 가격 Current price: 현재 가격 Age (in bars): 마지막으로 그려진 패턴의 나이 주요 입력 Symbols : "28개 주요 통화쌍" 또는 "선택한 심볼" 중에서 선택합니다. Selected Symbols : 쉼표로 구분하여 모니터링하려는 원하는 심볼("EURUSD,GBPUSD,XAUUSD")을 선택합니다. 브로커에 쌍에 접미사 또는 접두사가
norepaint buy sell indicator is norepaint indicator.and works all pairs and all timeframes. using is wery simple ,it puts arrow on price probably buy sell arrows. thise indicator is suitable for beginner and experienced traders. there is cnt numbers that show how many bars you see the signal back. increasing it possible but up to chart have the how many bars . minimum value of this 500.
GOLD Impulse with Alert
Bernhard Schweigert
4.56 (9)
이 지표는 Advanced Currency IMPULSE with ALERT  +   Currency Strength Exotics  의 2가지 제품의 슈퍼 조합입니다. 그것은 모든 시간 프레임에 대해 작동하며 8개의 주요 통화와 하나의 기호에 대한 강약의 충동을 그래픽으로 보여줍니다! 이 표시기는 금, 이국적인 쌍, 상품, 지수 또는 선물과 같은 기호에 대한 통화 강도 가속을 표시하는 데 특화되어 있습니다. 금, 은, 오일, DAX, US30, MXN, TRY, CNH 등의 진정한 통화 강도 가속(충동 또는 속도)을 표시하기 위해 9번째 줄에 모든 기호를 추가할 수 있습니다. 새로운 기본 알고리즘을 기반으로 구축되어 잠재적인 거래를 훨씬 더 쉽게 식별하고 확인할 수 있습니다. 이는 통화의 강세 또는 약세가 가속되는지 여부를 그래픽으로 표시하고 가속 속도를 측정하기 때문입니다. 자동차의 속도계처럼 생각하면 됩니다. 가속화할 때 Forex 시장에서 동일한 일이 분명히
NextCandlePredictor No Repaint
Martin Alejandro Bamonte
NextCandlePredictor 지표 NextCandlePredictor는 다시 그리지 않으며, 색상이 변경되지 않고, 이동하지 않으며, 사라지지 않으며, 지연이 없는 알림이 있는 신호 지표입니다. 모든 타임프레임에서 다음 또는 다가오는 캔들의 방향을 식별하는 데 도움이 됩니다. 뉴욕, 런던 또는 둘 다 겹치는 고변동성 시장에 매우 권장됩니다. 주요 기능: 타임프레임의 유연성: M1에서 H1 이상까지 모든 타임프레임에서 빠르고 정확한 신호를 제공합니다. 명확한 매수/매도 신호: ADX의 DI+ 및 DI- 라인을 사용하여 명확한 매수 및 매도 신호를 생성하여 최고의 거래 결정을 내릴 수 있도록 합니다. 직관적인 시각화: 신호는 차트에 직접 녹색(매수) 및 빨간색(매도) 화살표로 표시되어 빠르고 쉽게 읽을 수 있습니다. 사용자 정의 가능한 설정: 분석할 막대 수와 경고 옵션을 선호도 및 거래 전략에 따라 조정합니다. 사용하려는 TF에 따른 제안표를 아래에서 확인하세요. 캔들 종료 시
Automated Trendlines
Georgios Kalomoiropoulos
5 (17)
추세선은 외환 거래에서 기술적 분석의 가장 필수적인 도구입니다. 불행히도, 대부분의 거래자는 올바르게 그리지 않습니다. 자동 추세선 표시기는 시장의 추세 움직임을 시각화하는 데 도움이 되는 진지한 거래자를 위한 전문 도구입니다. 추세선 강세 추세선과 약세 추세선에는 두 가지 유형이 있습니다. 상승 추세에서 Forex 추세선은 가격 움직임의 가장 낮은 스윙 포인트를 통해 그려집니다. 최소 두 개의 "최저 저점"을 연결하면 추세선이 생성됩니다. 하락 추세에서 추세선은 가격 움직임의 가장 높은 스윙 포인트를 통해 그려집니다. 최소 두 개의 "최고 최고점"을 연결하면 추세선이 생성됩니다. 추세선이 깨질 때? 강세 추세선은 약세 양초가 강세 추세선 아래에서 닫히고 양초의 고점이 추세선 위에 있을 때 깨집니다. 약세 추세선은 강세 양초가 약세 추세선 위로 마감되고 양초 저점이 추세선 아래에 있을 때 깨집니다. 추세선이 삭제되면? 강세 추
The Supply and Demand with Swap zones MTF indicator is a powerful tool for technical analysis that has been modified and enhanced to provide traders with even more valuable information. This tool is based on the rule of supply and demand and allows traders to analyze a chart on three different timeframes at once, providing a more comprehensive view of the market. One of the key features of this indicator is the so-called swap zones, which are areas that have been broken through by the price but
제작자의 제품 더 보기
Belkhayate Gravity Center
Ahmed Alaoui Chrifi
4.2 (5)
The Belkhayate center of gravity indicator is best used to confirm major turning points, and distinguish price extremes. Generally if price reaches the upper or lower levels one should expect a turn around coming soon, or at least a pull back towards the centre line if there is a strong trend. The upper and lower levels are red and green lines. Our indicator use the same parameters as the well known trader M.Mostafa Belkhayate the inventor of the indicator, allow the use of buffers for your EA
Belkhayate Gravity Center MT4
Ahmed Alaoui Chrifi
5 (4)
The Belkhayate center of gravity indicator is best used to confirm major turning points, and distinguish price extremes. Generally if price reaches the upper or lower levels one should expect a turn around coming soon, or at least a pull back towards the centre line if there is a strong trend. The upper and lower levels are red and green lines. Our indicator use the same parameters as the well known trader M.Mostafa Belkhayate the inventor of the indicator, allow the use of buffers for your EA
Belkhayate Gravity Center MT4 The Belkhayate center of gravity indicator is best used to confirm major turning points, and distinguish price extremes. Generally if price reaches the upper or lower levels one should expect a turn around coming soon, or at least a pull back towards the centre line if there is a strong trend. The upper and lower levels are red and green lines. Our indicator use the same parameters as the well known trader M.Mostafa Belkhayate the inventor of the indicator, allow t
TheStrat
Ahmed Alaoui Chrifi
Rob Smith's is a trading method developed over a 30 year career in the market. TheSTRAT is a multi-timeframe strategy that has three major components: Inside Bars - Inside Bars occur when the current candle falls completely within the prior candle. Directional Bars - Directional Bars occur when the current candle takes out one side of the prior candle. Outside Bars - Outside Bars occur when the current candle takes out both sides of the prior candle. #thestrat
Partial Close MT4
Ahmed Alaoui Chrifi
This is a very simple, and easy-to-use Trade Manager with features like   Auto Partial Close, Auto Stop-loss, Breakeven. EA  closes a profitable position in partial closes when the price moves first in the direction of profits, and then comes back. EA monitors the position. If the price moves in the direction of profits, then ea establish the first level of rollback price at a distance. If the price continues to move in the direction of profits, this level of profit continues modifying this le
This trend following system was designed by   Dennis Gartman   and   Bill Eckhart , and relies on breakouts of historical highs and lows to take and close trades: it is the complete opposite to the "buy low and sell high" approach. This trend following system was taught to a group of average and normal individuals, and almost everyone turned into a profitable trader. The main rule is   "Trade an N-day breakout and take profits when an M-day high or low is breached (N must me above M)" . Example
IRB Scalper Pro
Ahmed Alaoui Chrifi
The strategy: EA strategy is inspired from a profitable strategy of Mr Rob Hoffman (One of the best traders in the world with multiple prizes on manual trading) . 1.Entry: The EA search for IRB bars (Inventory retracement bar), and place sell pending order or buy pending order according to the trend confirmed by the calculation of a 20 EMA slope degree. We believe that most of IRB Bar are caused by huge institutions (Hedge funds …), so the idea is to take benefits from their very profitable robo
IRB Scalper Original
Ahmed Alaoui Chrifi
IRB Scalper Original The Original version of IRB Scalper Pro (V3.0) The strategy: EA strategy is inspired from a profitable strategy of Mr Rob Hoffman (One of the best traders in the world with multiple prizes on manual trading) . 1.Entry: The EA search for IRB bars (Inventory retracement bar), and place sell pending order or buy pending order according to the trend confirmed by the calculation of a 20 EMA slope degree. We believe that most of IRB Bar are caused by huge institutions (Hedge funds
Belkhayate Gravity Center MT5 Custom The Belkhayate center of gravity indicator is best used to confirm major turning points, and distinguish price extremes. Generally if price reaches the upper or lower levels one should expect a turn around coming soon, or at least a pull back towards the centre line if there is a strong trend. The upper and lower levels are red and green lines. Our indicator use the same parameters as the well known trader M.Mostafa Belkhayate the inventor of the indi
필터:
리뷰 없음
리뷰 답변