SX Currency Strength MT4
- 지표
- Mojtaba Sarikhani
- 버전: 1.20
- 업데이트됨: 3 3월 2024
- 활성화: 7
SX Currency Strength indicator allows users to analyze currency strength through a selected period, with results resetting periodically and accumulating thereafter.
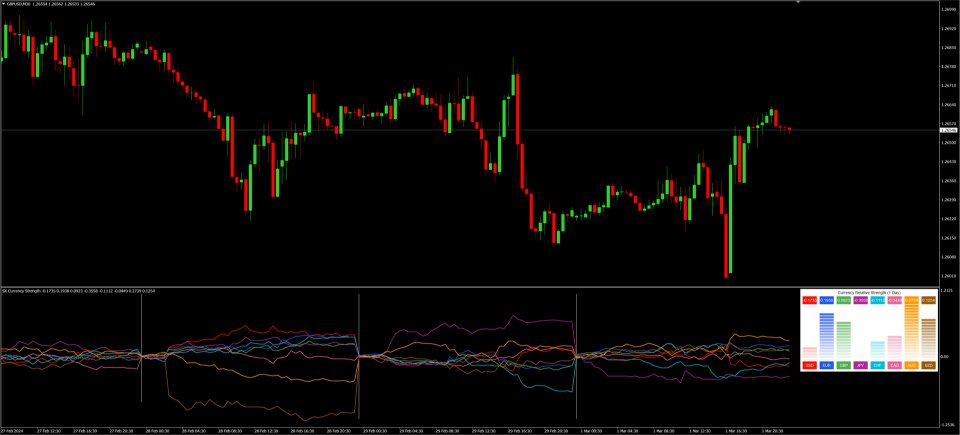
It displays the historical relative strength of eight major currencies (USD, EUR, GBP, JPY, AUD, CHF, CAD and NZD) across a selected timeframe. Assessing a currency's relative strength aids in evaluating its performance against a basket of other currencies.
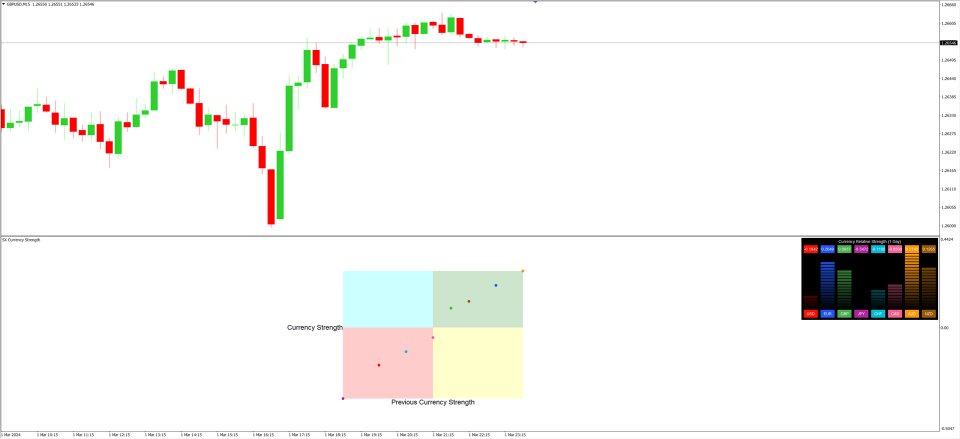
Users can select to visualize relative strength of the currencies in the shape of a scatter plot, offering deeper insights into currency performance evolution.
Modules:
The indicator consists of 3 modules:
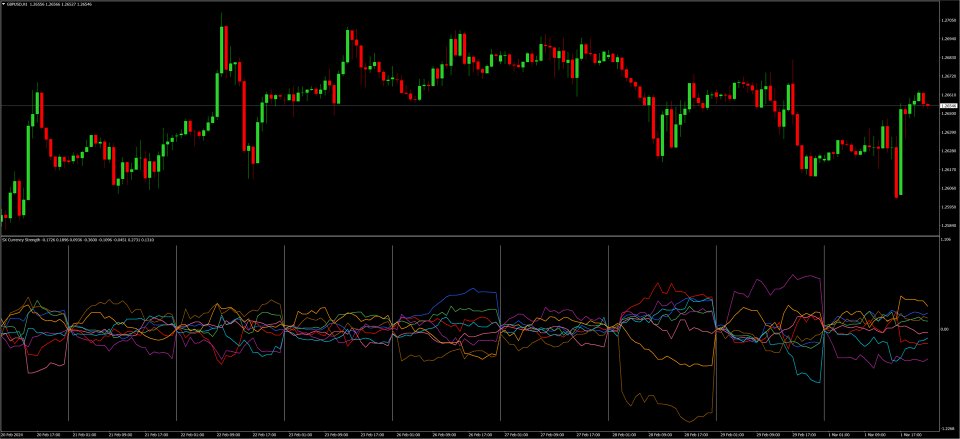
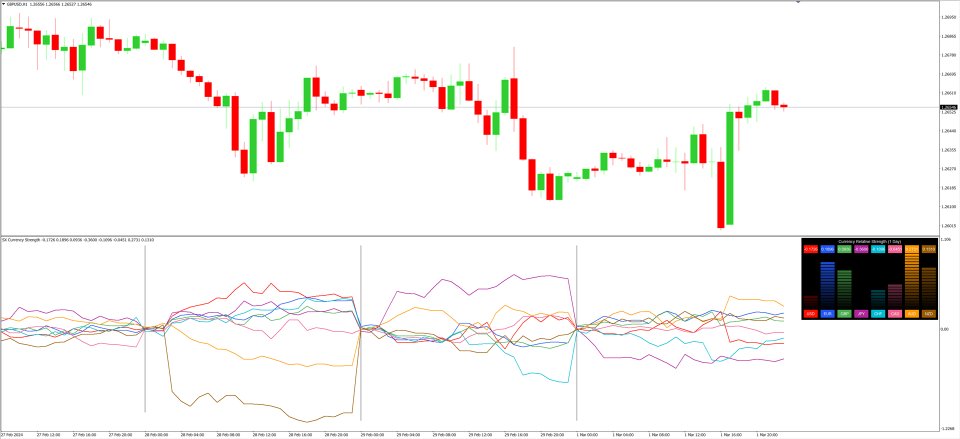
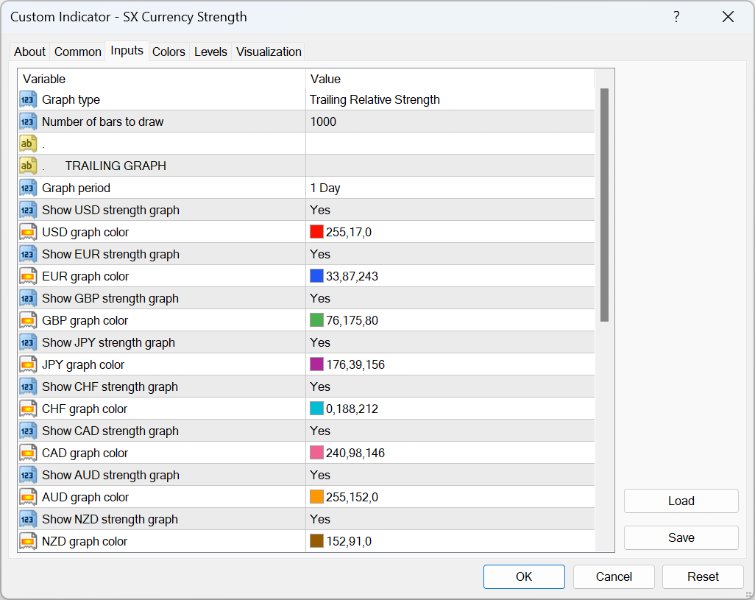
- Trailing Relative Strength graph
The Currency Strength indicator empowers users to analyze currency strength across a chosen period, with results resetting periodically and accumulating thereafter.
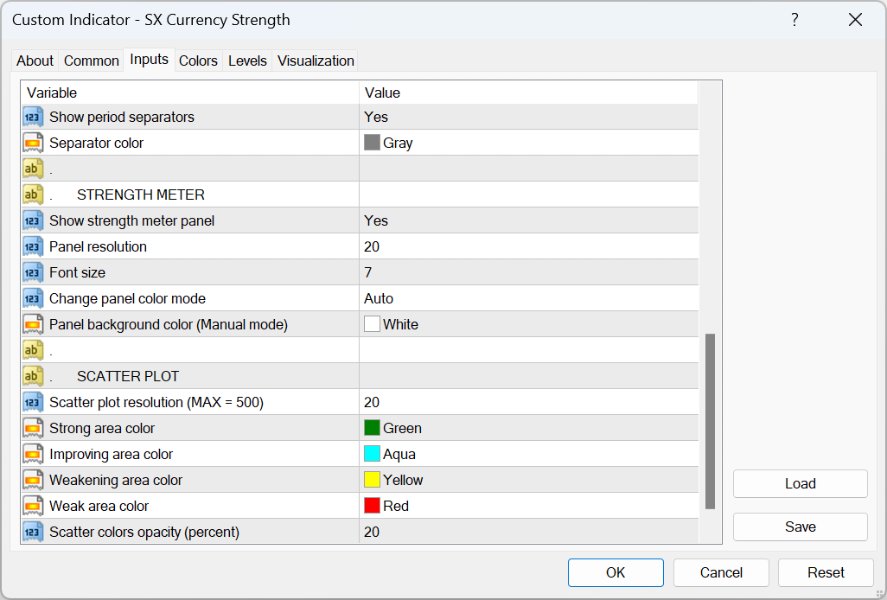
- Strength Meter Panel
Displays the currency strength meter on a panel.
- Relative Strength Scatter Plot
This graph illustrates a currency's relative strength compared to its previous value, providing insights into its strength evolution.
The graph is divided into four areas for quick interpretation:
Strong: Positive relative strength (bullish) greater than the previous period's value.
Improving: Negative relative strength (bearish) greater than the previous period's value.
Weakening: Positive relative strength (bullish) lower than the previous period's value.
Weak: Negative relative strength (bearish) lower than the previous period's value.
#Tags: Currency Strength, Currency Relative Strength, Advanced Currency Strength, Best Currency Strength, Strength Meter, Scatter Plot
DISCLAIMER: Please notice that we do not provide any financial advice. We only provide tools for anyone interested in improving their trading.











사용자가 평가에 대한 코멘트를 남기지 않았습니다
Thank you very much for your comment!
Adding more currencies is under process, will update the indicator asap!