• 미리보기
  • 리뷰 (3)
  • 코멘트
  • 새 소식

Big Player Range

5

"BigPlayerRange"의 힘을 발견하세요: 시장 분석의 강력한 동맹 📈🔍

BigPlayerRange는 금융 기관의 시장 관심 영역을 공개하기 위해 설계된 고급 기술 분석 도구입니다. 이를 통해 주요 플레이어들이 활발히 참여하고 있는 곳을 정확하게 식별하고, 그것이 거래 전략에 어떤 영향을 미칠 수 있는지 알 수 있습니다.

주요 기능:

  • 금융 기관의 관심 영역 맵핑 📊: BigPlayerRange는 금융 기관의 활발한 활동이 일어나는 구역을 강조하여, 시장 움직임에 대한 중요한 통찰을 제공합니다.

  • 출구 참조를 위한 예측 🎯: 이 지표는 가격의 향후 방향을 바탕으로 두 단계에 걸쳐 가능한 출구를 제안합니다.

  • 리트레이스 확률 🔄: 가격이 식별된 범위로 돌아갈 때 리트레이스 확률을 평가합니다. 이 기능은 리스크 관리와 전략 조정에 매우 중요합니다.

BigPlayerRange 사용법:

  • 관심 영역 식별 📍: 이 지표를 사용하여 시장에서 중요한 활동을 보이는 금융 기관의 관심 구역을 찾아내세요.

  • 출구 예측 🏁: 지표에서 제공하는 예측을 바탕으로 출구 결정을 내리고, 가격의 향후 방향에 맞춘 전략을 세웁니다.

  • 리트레이스 확률 평가 📉: 가격이 관심 영역으로 돌아갈 확률을 모니터링하고, 필요에 따라 전략을 조정합니다.

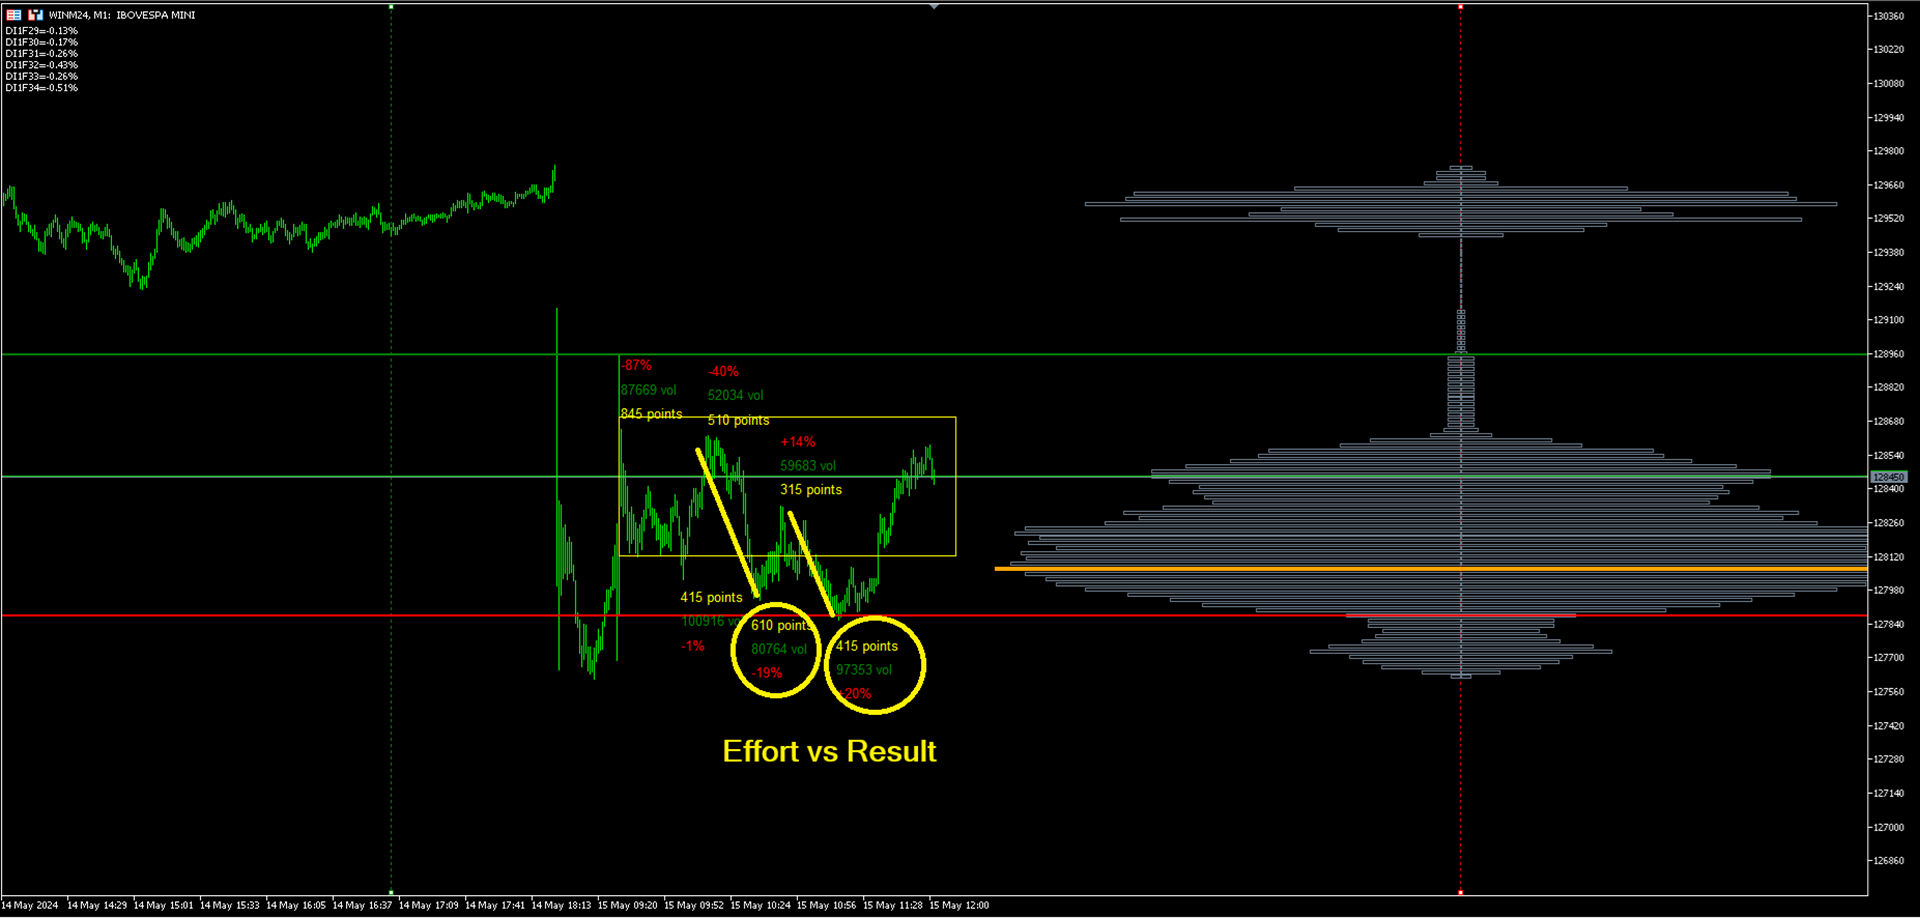
주요 트리거: 가격과 녹색 및 빨간색 라인의 관계 모니터링 🔍

BigPlayerRange의 중심 영역은 시장에서 금융 기관의 집중된 에너지를 보여줍니다. 가격이 녹색 및 빨간색 라인과 비교하여 어떻게 마감되는지를 모니터링하면 구매 및 판매의 주요 압력을 파악하여 전략적으로 의사 결정을 내릴 수 있습니다.

이 중요한 정보를 활용한 강력한 의사 결정 방법:

  • 녹색 라인 위에서 마감 — 강력한 구매 압력 📈: 가격이 녹색 라인 위에서 마감되면, 이는 우세한 구매 압력을 나타내며, 강력한 상승의 지속 가능성을 암시합니다.

  • 빨간색 라인 아래에서 마감 — 강력한 판매 압력 📉: 가격이 빨간색 라인 아래에서 마감되면, 이는 강력한 판매 압력을 의미하며, 하락 가능성을 시사합니다.

  • ⚡ 중요: 중앙 사각형으로 표시된 영역은 주요 플레이어들의 주문 흐름이 집중되는 영역입니다. 이 공간은 의사 결정의 중심 역할을 하며, 구매자와 판매자 간의 불균형이 다음 움직임을 결정합니다.

입출구 확인 🎯

입출구를 확인하려면 BigPlayerRange와 함께 Swing of Volume 및 Profile을 결합하세요:

  • 주요 플레이어들의 압력에 기반한 진입 기회를 활용하여 중요한 불균형을 포착합니다.
  • 목표 1과 2에서의 전략적인 출구를 통해 구조적인 접근 방식을 유지합니다.
  • 잠재적인 리트레이스 조정을 통해 리스크 관리 능력을 향상시킵니다.

분석 조정 및 개인화:

  • 시간 및 볼륨 유형 선택 ⏰📊: 시간을 선택하고, 볼륨 유형(틱 또는 실제 볼륨)을 설정하여 분석을 개인화하고 제공된 데이터의 정확성을 최적화합니다.

  • 심층 해석 🧠: 지표 정보를 활용하여 전략을 세밀하게 조정하고, 보다 정보에 기반한 결정을 내립니다.

BigPlayerRange와 함께라면 유연하고 강력한 접근 방식으로 언제나 한 발 앞서가는 정보에 기반한 결정을 내릴 수 있습니다! 🚀📈


리뷰 3
gustavonbeck
25
gustavonbeck 2025.01.24 11:01 
 

Excelente indicador! Um dos melhores que já adquiri! Parabéns!

fabioa333
19
fabioa333 2024.01.23 15:19 
 

Ótimo indicador, para quem já possui um operacional, desenvolvedor sempre disponível para esclarecimento de eventuais dúvidas.

guigbz
19
guigbz 2023.12.20 15:00 
 

Indicador com alto nível de acerto, ajuda muito na tomada de decisão. O desenvolvedor é muito atencioso e prestativo quanto ao uso do indicador.

추천 제품
Limitless MT5
Dmitriy Kashevich
Limitless MT5 is a universal indicator suitable for every beginner and experienced trader. works on all currency pairs, cryptocurrencies, raw stocks Limitless MT5 - already configured and does not require additional configuration And now the main thing Why Limitless MT5? 1 complete lack of redrawing 2 two years of testing by the best specialists in trading 3 the accuracy of correct signals exceeds 80% 4 performed well in trading during news releases Trading rules 1 buy signal - the ap
RAD Real Acummulation and Distribution
Jose Alejandro Jacome Jimenez
RAD CRITICAL LEVES RAD indicator tracks “Relevant Volume” in real time, identifying accumulation and distribution processes, projecting them in the chart as SUPPORT or RESISTANCE zones. Natural   support   and resistance levels are generated by Volume Accumulation and Distribution processes. As these processes evolve, levels at which the relevant volume in the market place is positioned, become difficult areas to cross upwards or downwards. By using this information, traders can identify very s
Visual Range Directional Force Indicator
AL MOOSAWI ABDULLAH JAFFER BAQER
Range Directional Force Indicator – Designed for You to Optimize! The Range Directional Force Indicator is a cutting-edge tool designed to empower traders by visualizing market dynamics and directional strength. Built to offer insights into market trends and reversals, this indicator is an invaluable asset for traders seeking precision in their strategies. However, it is important to note that this indicator is not optimized, leaving room for you to tailor it to your unique trading preferences.
Manyal trading system, CovEchoTrend Robot, focuses on reliability and flexibility. By employing statistical analysis methods to study the relationships between the base indicator and market patterns, the system enables a deeper understanding of market processes. Intelligent pattern analysis: The application of statistical data processing helps identify key trend reversal points more accurately, signaling significant market shifts. Informed decision-making is based on the intersection of indicato
HandleTrend
Kirill Subot
Trend indicator, a revolutionary unique solution for trend trading and filtering with all important trend features built into one tool! This is a 100% non-repainting multi-timeframe and multi-currency indicator that can be used on all currency pairs. HandleTrend is an effective trend following indicator that gives trend signals in the form of arrows on the chart.
To download MT4 version please click here . - This is the exact conversion from TradingView: "Trend Direction Force Index - TDFI [wm]" By "causecelebre". - The screenshot shows similar results from tradingview and Metatrader when tested on ICMarkets on both platforms. - This indicator uses multiple levels of averaging to detect trend strength. - You can optimize filter low and filter high levels to achieve best results. - You have access to buffers to use in EAs. - This is a light-load processin
Eazy Indicator
Isaac Agyei Poku
Forex BUY and SELL signals from the best Heiken Ashi Smoothed indicator. Draw bullish/bearish bars on the chart. Accurate trend detector. Heiken Ashi Smoothed is a simple MT5 indicator that draws bullish and bearish bars in the chart to reflect the direction of the trend. The indicator consists of orange bearish bars and green bullish bars. When the trend changes its direction, the indicator changes its color. The indicator is a modernization of the traditional Heiken Ashi indicator. Moving Aver
Trend On Close
David Ben Svaiter
TrendOnClose is a sophisticated indicator designed for Binary market investors, focusing on statistical analysis of trends and counter-trends within specific candle cycles. Each cycle is defined by the candle CLOSE price, establishing the trend direction (UP/DOWN - BULL/BEAR) for subsequent statistical analysis until the start of the next cycle. The statistical analysis operates with two configurations: ⦁ Statistical Goal as SUBSEQUENT CANDLE: The algorithm focuses on the subsequent candle withi
Advance Entry Levels
Kundan Kumar Srivastava
Introducing Your Ultimate Trading Edge: Dynamic Support & Resistance, Advance Entry Levels Indicator for MT5 platform Unlock the power of precision trading with our cutting-edge Dynamic Support & Resistance Indicator. Designed to give traders unparalleled clarity, this indicator is your roadmap to identifying exactly where to buy and sell, maximizing your potential for consistent, sustainable profits. Why Choose Our Indicator? Crystal Clear Entry and Exit Points : No more guesswork. Our indicat
HeXon FX
Arseny Potyekhin
5 (1)
HeXon FX – 외환 트레이더를 위한 프리미어 트레이딩 솔루션 HeXon FX는 외환 시장에서 정확하게 작동하도록 설계된 고급형 전문가 어드바이저(EA)입니다. 최첨단 거래 전략을 활용하여 HeXon FX는 주요 통화쌍인 EURUSD 거래에 유연하고 안정적인 솔루션을 제공합니다. 이 EA는 특히 변동성이 큰 시장 상황에서 탁월하며, 다양한 시장 상황에 효과적으로 적응하여 위험을 최소화하면서도 일관된 수익을 제공합니다. 신호: Live Signal 1 이 전략은 매우 독특하기 때문에 라이선스의 수를 제한하여 판매하고 싶습니다. 따라서 판매를 제한하기 위해 가격이 점차 상승할 것입니다. 다음 가격은   690 달러입니다. 브로커 모든 브로커, ECN/제로 스프레드 선호 레버리지 1:20부터 입금 최소 50$     심볼 EURUSD 타임프레임 H1 HeXon FX의 차별화된 전략들 HeXon FX는 개별적으로 또는 조합하여 최적의 성능을 발휘할 수 있는 여러 복잡한 거래 전략을
Supply and Demand Indicator + FREE Currency Strength Meter ADD-ON Looking for a powerful tool that can help you identify the most reactive zones in the forex market? Our supply and demand indicator for MetaTrader 4 and 5 is exactly what you need. With its advanced algorithms and real-time analysis, this indicator helps traders of all experience levels make informed trading decisions. The supply and demand indicator is a cutting-edge tool that helps traders identify areas where buyers and sellers
Perfect Sniper
Ignacio Agustin Mene Franco
Perfect Sniper! is a triple indicator with support resistance detection, downtrend channel, uptrend channel Bands included! where he hunts the rebounds in the red lines for sale, in the green lines mark purchase, in the lower bands that are the breaks gives another second entry either buy or sell, perfect to take advantage of the double entrance, It is used in any temporality, It is used to scalp and long on h1 or h4 to D1. It works for Forex markets, All pairs. It is used for the synthetic inde
Ugenesys AI MT5
Odaine Ramon Mcmillan
uGenesys AI - 90% Accurate Daytrading Indicator Introducing the ultimate forex trading indicator system, uGenesys AI, powered by cutting-edge AI technology and advanced analytical techniques, including Time-Series Analysis and Genetic Algorithms. Our AI-powered trading system leverages the power of time-series analysis to identify trends and patterns in historical price data, allowing traders to make informed predictions about future market movements. By analyzing vast amounts of data, our syst
표시기는 현재 시세를 작성하여 과거 시세와 비교할 수 있으며 이를 바탕으로 가격 변동을 예측합니다. 표시기에는 원하는 날짜로 빠르게 이동할 수 있는 텍스트 필드가 있습니다. 옵션: 기호 - 표시기가 표시할 기호 선택. SymbolPeriod - 지표가 데이터를 가져올 기간 선택. IndicatorColor - 표시기 색상. HorisontalShift - 지시자가 그린 따옴표를 지정된 막대 수만큼 이동합니다. Inverse - true는 인용 부호를 반대로, false - 원래 보기를 반전합니다. ChartVerticalShiftStep - 차트를 수직으로 이동합니다(키보드의 위/아래 화살표). 다음은 날짜를 입력할 수 있는 텍스트 필드의 설정으로, '엔터'를 누르면 즉시 이동할 수 있습니다.
Hello There, Today I want to show you my new researchable fore BUY SELL indicator, it work all asset, and also work Derive Volatility asset! it work all time frame, but i recommend start 5 minute to H1 when you receive a signal just take trade and stay wait for your take profit asset All Major Pair And minor IT WORK ALSO XAUUSD Fantastic results,  for more info,,, message us thank you   
CoioteChart
Alexandre Moraes De Souza Lima
O Indicador CoioteChart foi construído pra facilitar desde a leitura de contexto de mercado até a micro estrutura do candle, facilitando ajustes operacionais e tomadas e decisão com alta eficácia. Possui um controle para habilitar e desabilitar a visualização das pocs, vwap, zonas de máxima e mínima negociação, pode ser utilizado data sources de tempos gráficos para cálculos ou utilizado os ticks de agressão do time and trades, funciona com volume real e volume de ticks. As colorações são atrib
Based on the trading model/strategy/system of gold double-position hedging and arbitrage launched by Goodtrade Brokers, problems encountered in daily operations: 1. Account B immediately places an order immediately following account A. 2: After account A places an order, account B will automatically copy the stop loss and take profit. 3: Account A closes the position of Account B and closes the position at the same time. 4: When account B closes the position, account A also closes the position.
Trend Turn
Ivan Simonika
The implementation of the Trend Turn trend indicator is simple - in the form of lines of two colors. The indicator algorithm is based on standard indicators as well as its own mathematical calculations. The indicator will help users determine the direction of the trend. It will also become an indispensable advisor for entering the market or closing a position. This indicator is recommended for everyone, both beginners and professionals. How to interpret information from the indicator. We sell
Very easy to follow buy and sell indicator for Gold, Crypto and Forex. Just follow the signal with risk management. Good for both novice as well as expert traders. Once you get to use to using with this then you know how to use to for consistent winning. Make sure to combine proper risk management with proper position sizing. Green for buy and red for sell on the chart.
TPO Profile MT5
Kyra Nickaline Watson-gordon
Definition : TPO is a Time Price Opportunity. Instead of using bars or candles with an Open, High, Low, and Close price, each "bar" in a Market Profile is represented by horizontal bars against the price It is called Market Profile terminology. In other words time-price-opportunity (TPO) profiles are histograms of how much time was spent at each price within the span of the profile. By using a TPO chart, you are able to analyze the amount of trading activity, based on time, for each price level
Market Maestro
Andriy Sydoruk
Market Maestro: Your Ideal Partner for Automated Forex Trading If you're looking for a reliable assistant for trading in the currency market, Market Maestro is exactly what you need. This modern Forex bot is built using the latest technologies and algorithms, allowing it to effectively analyze market data and make informed trading decisions in real-time. Key Features of Market Maestro 1. Multicurrency Capability for Broad Opportunities Market Maestro can work with a wide range of currency pairs,
The key logic of SignalTech is generated by Artificial Intelligence. The machine learning module should continue optimizing the core logic on the server side to guarantee that SignalTech System can accurately track the market's movement.  SignalTech can generate AI based signals with Buy/Sell Arrows and Pop-Up/Sound Alerts. Each signal has clear Entry and stop Loss levels, which should be automatically flagged on the chart, as well as potential Targets 1, 2, and 3. SignalTech can work on EURU
Expert. Automatic and manual trading. Ready-made trading system based on Elliott waves and Fibonacci retracement levels . It is simple and affordable. Display of the marking of Elliott waves (main or alternative option) on the chart. Construction of horizontal levels, support and resistance lines, a channel. Superposition of Fibonacci levels on waves 1, 3, 5, A Alert system (on-screen, E-Mail, Push notifications).    visual panel for opening orders in manual trading. visual panel for setting up
Cyberosaur V5
Maryna Shulzhenko
5 (1)
The     Cyberosaurus  bot is an innovative next-generation bot that serves as a powerful tool for trading in the classic Forex market and with cryptocurrencies (for corresponding brokers). It operates with the majority of pairs, so it is advisable to test it before using it on a specific pair. It is specifically designed to work with these markets, without the ability to trade other assets such as stocks or indices. The main control parameters of the bot are presented in a convenient and conci
Классификатор силы тренда. Показания на истории не меняет. Изменяется классификация только незакрытого бара. По идее подобен полной системе ASCTrend, сигнальный модуль которой, точнее его аппроксимация в несколько "урезанном" виде, есть в свободном доступе, а также в терминале как сигнальный индикатор SilverTrend . Точной копией системы ASCTrend не является. Работает на всех инструментах и всех временных диапазонах. Индикатор использует несколько некоррелируемых между собой алгоритмов для класси
SMC Venom Model BPR 지표는 Smart Money(SMC) 개념 내에서 일하는 트레이더를 위한 전문 도구입니다. 가격 차트에서 두 가지 주요 패턴을 자동으로 식별합니다. FVG (공정 가치 갭)는 3개의 캔들의 조합으로, 첫 번째와 세 번째 캔들 사이에 갭이 있습니다. 이는 볼륨 지원이 없는 레벨 사이에 구역을 형성하여 종종 가격 수정으로 이어집니다. BPR (균형 가격 범위)은 두 개의 FVG 패턴의 조합으로, "브리지"를 형성합니다. 이는 가격이 낮은 볼륨 활동으로 움직일 때 브레이크아웃과 레벨로의 복귀 구역으로, 캔들 사이에 갭을 생성합니다. 이러한 패턴은 거래자가 차트에서 거래량과 가격 역학을 분석하여 주요 지지/저항 수준, 돌파 구역 및 진입 지점을 식별하는 데 도움이 되며, 여기서 대형 시장 참여자와 일반 참여자 간의 상호 작용이 발생합니다. 이 지표는 사각형과 화살표 형태로 패턴을 시각화하며 유연한 경고 설정도 지원합니다. 주요 특징: 패턴 표시 모드
Smart FVG indicator
Ahmad Kazbar
5 (2)
Smart FVG Indicator – Advanced Fair Value Gap Detection for MT5 Enhance Your Trading with the Smart FVG Indicator! Are you looking to identify Fair Value Gaps (FVGs) effectively and integrate them into your trading strategy? The Smart FVG Indicator for MetaTrader 5 (MT5) offers a comprehensive solution to detect and utilize FVGs, providing you with a trading edge. Key Features: Dynamic FVG Detection: Automatically scans and highlights FVGs on your charts, indicating potential institutional
FREE
BC Scalper Aroow
Tete Adate Adjete
This indicator is based on the crossing of two Moving Average with the RSI It is intended for scalpers Specially designed for Boom and Crash syhtetic indices from Binary.com/Deriv.com It is easy to use and intuitive. We recommend its use on M1 and is equipped with three types of notification Email alert Sound notification Push notification these parameters can be activated and deactivated.
Balance Aggression
Edson Cavalca Junior
The indicator measures the balance of aggression. The formula is as follows:   Aggression  = Purchase Volume - Sales Volume. Note : It is rec ommended to use the default configuration and VPS values. It does not work in Forex. Meet Our Products     Parameters : Numbers of days prior to the current one for calculation; Volume Divider e; Enables calculation of the current candle; Histogram Line style and; Size; Line Line style and; Size;  Follow us on our website to check the next news.
BBVectorDynamics_Robot is an innovative trading advisor specifically designed for volatile markets. Based on unique algorithms for analyzing market forces and identifying imbalances between buyers and sellers, this advisor helps you make precise and well-considered decisions in the trading process. Main features of the bb vector dynamics_robot advisor: Calculation of dynamic vectors. System determines the differences between the extreme price values and smoothed averages over a specified perio
이 제품의 구매자들이 또한 구매함
CBT Quantum Maverick 고효율 바이너리 옵션 거래 시스템 CBT Quantum Maverick는 정밀하고 간단하며 체계적인 거래를 원하는 트레이더를 위해 설계된 고성능 바이너리 옵션 거래 시스템입니다. 사용자 지정이 필요 없으며, 처음부터 최적화된 결과를 제공합니다. 약간의 연습만으로 신호를 쉽게 마스터할 수 있습니다. 주요 특징: 정확한 신호 제공: 현재 봉 데이터를 기반으로 다음 캔들에 대한 신호를 생성하며, 빈번한 재도색이 없습니다. 다양한 시장에 대한 적응성: 바이너리 옵션 거래에 특화되었으며, 여러 브로커 및 자산 클래스와 호환됩니다. 호환 가능: Deriv Synthetic Charts: 모든 시간 프레임에서 사용 가능. OTC 차트: Quotex, PocketOption, Binomo, Stockity, IQOption, Exnova, OlympTrade, Deriv, Binolla, Homebroker 등의 브로커와 호환(MT5로의 무료 데이터 임
This indicator is based on the mathematics of the great trader W.D. Ganna. With its help, you can easily find strong levels by analyzing swings to find the optimal entry point. The indicator works on all instruments and all timeframes. The indicator is fully manual and has control buttons. All you need to do is press the NEW button, a segment will appear, which you can place on any movement, swing or even 1 candle that you want to analyze. By placing the segment, press the OK button. A grid (th
Gann Zone Pro MT5
Kirill Borovskii
This indicator identifies and displays zones, as it were areas of strength, where the price will unfold. The indicator can work on any chart, any instrument, at any timeframe. The indicator has two modes. The indicator is equipped with a control panel with buttons for convenience and split into two modes. Manual mode: To work with manual mode, you need to press the NEW button, a segment will appear. This segment is stretched over the movement and the LVL button is pressed. The level is displayed
LIMITED! JUST 10 COPIES AVAILABLE!  BONUS AUX VIP Club 2024 : Include EA CAP, CEP, LDH, PSC307 & AO4C to enhance the performance of this tool to its maximum potential  Click Here to Download Files   ( for users only ) FREE Trading Education Available Daily via Zoom --- For More Info or Instant Message Click link ---  https://t.me/abcdwave Transform your trading with the "Five Magic Bullets" Indicator, tailored for traders who embrace the power of Elliott Wave Chaos Theory. Spec
Hello I Want to introduce The Forex Buy Sell Arrow Premium MT5 i recently release this premium indicator! its 1000% Non Repaint Indicator, It Work Perfectly Well,, i tested it day by day, Just mind blowing Result,  Including Powerful trend Algorithm! How It Work? well, it work market trend formula, when trend Bullish Or when trend Bearish,  Recommend Timeframe M30, H1 it work all timeframe, and all currency pair, 100% non repaint, How to take signal From Forex Buy Sell Arrow Premium Ind
VTrende Pro
Andrii Diachenko
5 (1)
VTrende Pro - MTF indicator for trend trading with a display panel for MT5 *** Videos can be translated into any language using subtitles (video language - Russian) Although the signals of the VTrende Pro indicator can be used as signals of a full-fledged trading system, it is recommended to use them in conjunction with the Bill Williams TS. VTrende Pro is an extended version of the VTrende indicator. Difference between Pro version and VTrende: - Time zones - Signal V - signal 1-2 waves -    S
AriBot
Arman Belassarov
AriMax   – AI-Powered Trading Robot AriMax is a cutting-edge AI-powered trading robot designed to help traders maximize profits while minimizing risk. Utilizing advanced machine learning algorithms and real-time market analysis, AriMax identifies high-probability trade opportunities with precision and speed. Key Features:     AI-Driven Market Analysis   – Analyzes market trends and patterns to make data-driven trading decisions.     Automated Execution   – Places trades seamlessly with optimiz
IVISTscalp5
Vadym Zhukovskyi
5 (6)
당신에게 소개하는 iVISTscalp5 지표는 독특하면서도 거래 작업에서 효과적입니다. 이 지표는 시간 데이터를 기반으로 하며 금융 시장의 많은 경험과 깊은 분석의 결과입니다. iVISTscalp5 지표는 수동 거래에 뛰어난 도구입니다. 편리성, 간단함 및 시각화 - 모든 복잡성은 숨겨져 있습니다. 우리는 iVISTscalp5 지표의 설정과 사용을 최대한 단순화했습니다. 이 지표는 MT5 터미널에서 가지고 있는 모든 금융 상품에 적합합니다. 시간 기준으로 작동하는 시간은 4am에서 8pm (UTC+3)입니다. iVISTscalp5 지표 메뉴 (스크린샷 1 참조): History - 표시할 주간 수 계산 dT_min - 시간 설정 간격 선택 (분) TFline - 수평 볼륨 생성 (타임프레임) BARSline - 수평 볼륨 생성 (바 수) TFtrend1 - 매일 채널 생성 (타임프레임) BARStrend1 - 매일 채널 생성 (바 수) TFtrend2 - 주간 채널 생성 (타임프레임
The   Gann Scalping Gold Indicator   is a robust technical analysis tool designed for precision trading in gold markets. It leverages Gann-based methodologies to identify key price levels, enabling traders to anticipate potential market reversals, breakouts, and areas of consolidation. Daily Reset Logic: Automatically resets touch statuses at the start of a new trading day, ensuring that the indicator aligns with fresh daily trends. How It Works: The indicator draws horizontal lines at predefine
The indicator is designed to close positions on the market in time. For example: to take profits ahead of schedule if the price has not reached TakeProfit, and the market is turning around. The indicator analyzes the momentum, not the trend. He does not give any information about the trend. The indicator is well suited for finding divergence. The Ershov 38 Parrots indicator dynamically adjusts to the market and detects price movement impulses of medium and high amplitude. It almost does not rea
WanaScalper
Isaac Wanasolo
1 (1)
A scalping indicator based on mathematical patterns, which on average gives signals with relatively small SL, and also occasionally helps to catch big moves in the markets (more information in the video) This indicator has three main types of notifications: The first type warns of a possible/upcoming signal on the next bar The second type indicates the presence of a ready signal to enter the market/open a position The third type is for SL and TP levels - you will be notified every time price re
Smooth price for Monarch
Konstantin Gruzdev
5 (1)
The Smooth Price technical indicator is used for plotting a smoothed line as close to the price of the financial instrument as possible, and serves to eliminate its noise components. The indicator is part of the Monarch trading system, but here it is presented as an independent technical analysis tool. The indicator is based on the cluster digital filter , which, unlike the ClusterSMA , is applied directly to the price time series. Smooth Price does not redraw (except the very last, zero bar) an
Pan PrizMA CD Phase
Aleksey Panfilov
The Expert Advisor and the video are attached in the Discussion tab . The robot applies only one order and strictly follows the signals to evaluate the indicator efficiency. Pan PrizMA CD Phase is an option based on the Pan PrizMA indicator. Details (in Russian). Averaging by a quadric-quartic polynomial increases the smoothness of lines, adds momentum and rhythm. Extrapolation by the sinusoid function near a constant allows adjusting the delay or lead of signals. The value of the phase - wave s
Premium level Pro
Dmitriy Kashevich
Premium level is a unique indicator with more than 80% accuracy of correct predictions! This indicator has been tested for more than two months by the best Trading Specialists! The author's indicator you will not find anywhere else! From the screenshots you can see for yourself the accuracy of this tool! 1 is great for trading binary options with an expiration time of 1 candle. 2 works on all currency pairs, stocks, commodities, cryptocurrencies Instructions: As soon as the red arrow app
Pendiente de Precio
Cesar Juan Flores Navarro
Indicador en base a la pendiente de la linea de precio, dibuja una línea de color cuando sube a base de los precios que previamente has sido procesados o linealizados, y cuando baja la pendiente la linea linealizada toma otro color. En este caso se a considerado 6 lineas de diferentes procesos desde pendientes largas hacia las cortas, observándose que cuando coincidan las pendientes se produce un máximo o mínimo, lo que a simple vista nos permitirá hacer una COMPRA O VENTA.
Индикатор Coefficient Of Determination (COD) представляет собой значение коэффициента детерминации или квадрат коэффициента корреляции между зависимой переменной — ценой и объясняющей переменной — тиковым объемом. Что это дает нам на практике? COD отлично распознает кульминацию трендовых движений, что позволяет подбирать оптимальные точки и ловить развороты рынка. Как использовать индикатор: Наиболее популярная торговая стратегия строится совместно с трендовым индикатором Moving Average (MA), пе
Fibonacci Multiple 12
Cesar Juan Flores Navarro
Fibonacci Múltiple 12, utiliza la serie fibonacci plasmado en el indicador fibonacci, aumentadolo 12 veces según su secuencia. El indicador fibonacci normalmente muestra una vez, el presente indicador se mostrara 12 veces empezando el numero que le indique siguiendo la secuencia. Se puede utilizar para ver la tendencia en periodos cortos y largos, de minutos a meses, solo aumentado el numero MULTIPLICA.
Recommended TimeFrame >= H1. 100% Non Repainted at any moment.  Use it carefully, only with Trend Direction. Trading Usage: 2 Variants: as Range System or as BreakOut System (Both Only With Trend Direction)::: (Always use StopLoss for minimise Risk); [1] as Range System: (Recommended) in UP TREND:  - BUY in Blue Line , then if price goes down by 50 points (on H1) open Second BUY.   Close in any Profit you wish: TrailingStop(45 points) or Close when Price touches upper Gold Line. in DOWN TREND
Linea Horizontal Inteligente
Cesar Juan Flores Navarro
En base a cálculos matemáticos de determino una linea Horizontal que cruza a todas las señales de trading, mostrando los máximos y mínimos. La linea horizontal parte en dos las subidas y bajadas de las señales de trading, de tan manera que es fácil identificar los máximos y mínimos, y es inteligente por que es sensible a las subidas y bajadas, afín de no quedarse en un solo lado por siempre, trabaja excelentemente con otros indicadores suavizadores ya que les garantiza que en un intervalo de tie
Spike Detector
Tete Adate Adjete
this indicator is a Spike detector indicator, it is specially designed to trade Boom 1000, Boom 500, Crash 1000 and Crash 500 We recommend using it on Deriv Boom and Crash indices only Its setting is intuitive, familiar, easy to use it has notification functions; audible notifications and push notifications. this tool is simple to use, easy to handle This update is based on different strategies for spikes
AutoSignals Trend Panel
Danilo Maia Siqueira
The indicator tracks the trend in 5 different chart times for the same asset, based on 6 signals for each chart time. The main objective of the indicator is to show us the majority trend of the financial asset in which it was placed. The system transmits the information of the trends in several graphical times, in this way the user is able to have a wide view of the movement of the asset, this type of tool makes the user have a higher hit rate by helping the operator to execute orders in favo
Panel Visao axetrend
Danilo Maia Siqueira
trend view panel; AutoSignals Trend The indicator tracks the trend in 5 different chart times for the same asset, based on 6 signals for each chart time. The main objective of the indicator is to show us the majority trend of the financial asset in which it was placed. The system transmits the information of the trends in different graphic times, in this way the user is able to have a wide view of the movement of the asset, this type of tool makes the user have a higher hit rate by helping
Escalera Inteligente
Cesar Juan Flores Navarro
Indicador en MQL5, recibe la información del precio SUAVIZADO, lo procesa anulando los picos inteligentemente, y el resultado lo envía al desarrollo de la escalera que iniciara y subirá o bajara según el peldaño o INTERVALO ingresado Ingreso PERIODO = 50 (variar segun uso) Ingreso MULTIPLICA AL PERIODO = 1 (variar segun uso) Segun la configuración la escalera puede pegarse o separarse de los precios,, Se aplica toda la linea de tiempo, y a todas las divisas, etc.  
Fibonacci Suavizado
Cesar Juan Flores Navarro
Indicador en MQL5, que obtiene el promedio de 10 EMAS, que son alineadas según Fibonacci, obteniendo un promedio, que sera suavizado.  Se puede ingresar un numero desde 2 a N, que multiplica a los EMA-Fibonacci. Funciona en cualquier criptomoneda, etc. etc... pudiendo calcular el futuro segun la tendencia de las EMAS. Funciona excelentemente en tramos largos, determinando exactamente el mejor inicio/salida. El precio inicial por apertura sera por un periodo de tiempo, luego aumentará.
QXS Market Scanner
Netlux Digital Kft.
QuantXMarketScanner is a multi assets indicator for MT5 - Mathematical model based on 7 custom moving averages indicators  - Adaptable on Currencies, Stocks and Crypto - Automatic setup, self optimized About QuantXsystem Products: –         Simple installation & integration into MT5   –         Unlimited License after purchase (for one user) –         Automatic pattern recognition to identify the best timing and price levels. –         Trading indicators are displayed directly and automaticall
QuantXSTocks Trading Range Indicator for MT5: INSTRUCTIONS TO USE OUR INDICATOR:- User needs to take trade on Arrow or after an Arrow CandleStick, You can achieve up-to 35-125 pips target by this Indicator. Best Timeframes for Stocks and Indices are M30 and H1: AMAZON M30 (50 pips) TESLA M30 (50 pips) APPLE M30 (50 pips) ADOBE M30 (50 pips) NASDAQ100 H1 (125 pips) The above are the approximate amount of pips you can achieve by this Indicator, Green arrow appears to be buy arrow while the Red ar
Super Suavizador
Cesar Juan Flores Navarro
Indicador en MQL5 que obtiene el promedio de 10 EMAS que son alineadas y procesadas según Fibonacci luego el promedio es suavizado"  Se ingresa un número de 2 a N que multiplica los EMA-Fibonacci y por consiguiente aumenta los fibonacci, resultando un promedio.   Se ingresa un número que suaviza los EMA-Fibonacci. Considerando los números 1/1 seria la suavización minima. Considerando los números 3/5 seria la suavización media. Considerando los números 10/30 seria la suavización alta.....etc
Trend and Signals MT5  indicator scans  30 trading Instruments (Forex, Metals and Indices).     It uses special algorithm on the  current market   based on   Pure Price Action   and display the overall trend and signal on the dashboard. When signals are produced the indicator sends alert and notification. Strategy for Signals This indicator uses the daily timeframe to determine the direction of the trend. The hourly timeframe is used to identify possible entries. Main trend and is determined by
Cycles Forecast
Pooriya Alirezaee
This indicator is based on a mathematical formula and an ANN combined, designed to make a model(using previous prices) of the most recent market condition (any chart*) in order to use the model as a forecasting tool. *This indicator can operate on any chart/timeframe, but it's suggested you use multiple timeframes for each trade because this method relies solely on the time factor, you can not use this indicator to predict price volatility, but if it's fit correctly it will show you when the nex
Use with JUMP 25. However it can can with the volatility indices as well because it is a modified version. It is advisable to use create a healthy account management. Measure your risk and happy trading. Other experts to be loaded soon. These are modified in order to optimise profits. Ideal candidates are high risk, high returns individuals who hold trades at a maximum of 1 - 2 hours
제작자의 제품 더 보기
AI Channel
Thalles Nascimento De Carvalho
4.2 (5)
Welcome to the presentation of the AI Channel indicator, a powerful tool that uses artificial intelligence for price channel analysis in the financial market. In this session, we will explore how this revolutionary indicator can assist investors and traders in making more informed and strategic decisions. Let's get started! I. What is the AI Channel indicator? AI Channel is an indicator developed based on advanced artificial intelligence algorithms. It utilizes historical price data of financial
FREE
Times and Sales Pro
Thalles Nascimento De Carvalho
Times and Sales Pro: 거래 흐름의 불균형으로 거래를 강화하세요 작은 가격 변동의 기회 Times and Sales Pro 는 Times and Trades 를 통해 주문 흐름을 운영하는 분석가들에게 필수적인 도구입니다. 스캘퍼에게 이상적이며, 높은 정확도로 작은 가격 변동을 활용하고자 하는 분들을 위해 설계되었습니다. 고급 계산을 통해 이 지표는 거래의 불균형을 식별하여 빠른 진입 및 퇴출을 위한 귀중한 신호를 제공합니다. 중요: MT5에서의 Times and Trades 이용 가능성 Times and Sales Pro 를 사용하기 전에 브로커가 MT5에서 Times and Trades 에 대한 접근을 제공하는지 확인하세요. 이 지표는 실시간으로 정확한 계산을 생성하기 위해 이 데이터에 의존하며, MT5는 거래 이력을 저장하지 않습니다. 따라서 이 지표는 실시간에서만 작동하며, 시장에서 실행된 거래에 대한 즉각적인 통찰을 제공합니다. Ti
VWAP FanMaster
Thalles Nascimento De Carvalho
VWAP FanMaster: 정확한 풀백 전략을 마스터하자! VWAP FanMaster 는 정확한 진입점 과 효율적인 풀백 을 찾는 트레이더를 위한 궁극적인 지표입니다. **VWAP(거래량 가중 평균 가격)**과 피보나치 팬 라인 을 결합하여 시장에서 중요한 가격 영역을 명확하게 표시합니다. 주요 기능 간단하고 강력함 : 수직선을 이동시키기만 하면 자동으로 VWAP 과 피보나치 팬 라인 이 그려집니다. 스마트한 거래 전략 : 가격이 그려진 영역으로 되돌아오는 것을 기다린 후, 완벽한 풀백 을 지원 및 저항 레벨에서 포착하세요. 고급 시각적 도구 : 가격의 융합 영역 을 즉시 찾아서 신속하고 정확한 거래 결정을 내리세요. VWAP FanMaster를 선택해야 하는 이유 초보자도 쉽게 사용할 수 있음 . 두 가지 강력한 분석 도구 를 결합하여 거래 정확도를 높입니다. 위험 관리 개선 을 위한 명확하고 일관된 가격 예측 제공. VWAP F
FREE
Imbalance DOM Pro
Thalles Nascimento De Carvalho
5 (1)
Imbalance DOM Pro: 주문서의 불균형으로 거래를 강화하세요 MT5에서 주문서에 접근할 수 있나요? 거래를 새로운 수준으로 끌어올리고 싶나요? 주문 흐름을 기반으로 결정을 내리는 트레이더라면, Imbalance DOM Pro가 분석을 혁신적으로 바꿔줄 것입니다. 스캘퍼와 단기 트레이더를 위해 설계된 이 도구는 주문서의 불균형을 식별하고, 빠르고 정확한 진입과 청산을 위한 귀중한 거래 기회를 제공합니다. 작은 가격 변동에서 기회를 잡으세요 Imbalance DOM Pro는 작은 가격 변동을 잡고자 하는 트레이더에게 이상적인 도구입니다. 고급 계산을 통해 이 지표는 주문서의 불균형을 해석하고, 빠른 진입과 청산을 위한 중요한 정보를 제공합니다. 중요: MT5에서 주문서의 사용 가능 여부를 확인하세요 Imbalance DOM Pro를 사용하기 전에, 브로커가 MT5에서 주문서에 접근할 수 있는지 확인하세요. 이 지표는 실시간 데이터에 의존하기 때문에, M
Box Weis Wave
Thalles Nascimento De Carvalho
5 (1)
Weis Wave Box로 분석을 한 단계 끌어올리세요! 정확성과 명확성을 추구하는 트레이더라면, Weis Wave Box 가 필요한 도구입니다. 이 고급 지표는 볼륨 파동과 스윙 포인트에 대한 상세한 시각적 분석을 제공하여 시장에서 노력과 결과 간의 관계를 더 잘 이해하는 데 도움을 줍니다. Weis Wave Box의 주요 기능: 사용자 맞춤형 볼륨 파동: 거래 전략에 맞게 티크 단위로 볼륨 파동을 조정할 수 있습니다. 조정 가능한 이력: 특정 시간 기간에 초점을 맞춰 더 정확하고 관련성 있는 분석을 수행할 수 있습니다. 티크 vs. 실제 볼륨: 티크와 실제 볼륨을 명확히 구분하여 시장에 대한 더 포괄적인 시각을 제공합니다. 상단 박스 시각화: 볼륨(에너지)이 가장 높은 곳과 가격 이동이 적었던 곳을 명확히 시각화합니다. 이 시각화는 노력과 결과 간의 관계를 파악하는 데 도움이 되며, 어떤 힘이 지배적인지 강조하고 잠재적인 가격 변동을 예측할 수 있습
Book Data Binance
Thalles Nascimento De Carvalho
Book Data Binance! 좋아하는 암호화폐의 오더북에 접근하여 가격, 거래량, 불균형 분석의 세부 정보를 확인할 수 있다고 상상해 보세요. 거래소에서 DOM에 대한 접근을 제공하지 않더라도 말이죠. Book Data Binance와 함께라면 이제 그 꿈이 현실이 됩니다! 이 MQL5 스크립트는 시장의 역학을 깊이 이해하고자 하는 암호화폐 트레이더를 위해 특별히 개발되었습니다. 주요 기능: 스크립트 메뉴에서 사용할 수 있는 모든 암호화폐의 오더북에 직접 접근. 세계 최고의 거래소 중 하나인 Binance에서 제공하는 실시간 데이터 업데이트. 오더북의 불균형을 정확하게 분석하여 가격 변동을 식별하고 예측할 수 있습니다. Imbalance DOM Crypto 지표 와 통합되어 시장 분석을 다음 단계로 끌어올립니다. 왜 Book Data Binance를 선택해야 할까요? 각 가격 수준에서 구매자와 판매자의 행동을 이해하고자 하는 모든 분들에
FREE
Cumulative Volume Bands
Thalles Nascimento De Carvalho
CVB Cumulative Volume Bands: 누적 거래량으로 트레이드를 강화하세요! CVB Cumulative Volume Bands 는 누적 거래량에 기반한 정확한 신호를 찾는 트레이더를 위해 설계된 고급 지표입니다. 이 지표는 누적 거래량 밴드를 사용하여 시장의 매수 및 매도 압력을 명확하게 읽고, 반전 및 강력한 가격 변동을 식별하는 데 도움을 줍니다. Cumulative Volume Bands for MT5 ! 주요 특징: 누적 거래량 분석 : 거래량을 기반으로 주요 압력 지점을 감지합니다. 명확한 진입/퇴출 신호 : 실시간으로 기회를 포착하세요. 쉬운 해석 : 사용자 친화적인 인터페이스와 간단한 시각적 표현. 모든 자산 및 시간 프레임에 적합 : 모든 시장에서 언제든지 사용 가능합니다. CVB Cumulative Volume Bands 로 한 발 앞서 나가며 자신감을 가지고 트레이딩 결정을 개선하세요! 피드백
FREE
Swing Point Volume
Thalles Nascimento De Carvalho
Swing Point Volume, the indicator that signals weakness and strength at the tops and bottoms. This indicador can be for used the Wyckoff Method. Information provided; - Swing on customized ticks. - Volume and points in each balance sheet. - Percentage of Displacement. - Sound alert option on top and bottom breaks. - Volume in ticks and Real Volume. - Volume HL (extreme) or (opening and closing) - Customized volume shapes.
Volume Flow Binance
Thalles Nascimento De Carvalho
Volume Flow Binance! 당신이 선호하는 암호화폐의 times and trades 데이터에 접근하고, 거래량 흐름과 가격 변동 분석에 대한 세부 정보를 얻을 수 있다고 상상해 본 적이 있나요? 심지어 브로커가 거래 기록에 대한 완전한 접근을 제공하지 않더라도 말이죠? Volume Flow Binance 로 이제 그것이 현실이 됩니다! 이 MQL5 스크립트는 실시간 시장 동향에 대한 상세한 뷰를 원하는 암호화폐 트레이더를 위해 설계되었습니다. 주요 특징: 스크립트 메뉴에서 사용 가능한 모든 암호화폐의 times and trades 데이터에 직접 접근. 세계적인 거래소인 Binance에서 실시간 데이터 업데이트. 가격 변동을 예측하고 거래량 흐름을 정확하게 분석. Times and Sales Crypto 인디케이터 와의 통합으로 시장 분석을 다음 수준으로 향상. 왜 Volume Flow Binance를 선택해야 할까요? 실시간으로 매
FREE
Atr Projection
Thalles Nascimento De Carvalho
ATR 프로젝션 지표는 금융 시장에서 가격 움직임의 잠재적 한계에 대한 정확한 통찰을 제공하도록 설계된 강력한 도구로, 기술적 분석에서 두드러지고 있습니다. 유연한 접근 방식으로 사용자는 각 거래 자산의 특정한 요구에 맞게 분석 메트릭스를 직관적으로 사용자 정의할 수 있습니다. 사용자 정의 가능한 운영: 기본 설정으로 ATR 프로젝션은 최근 100개의 캔들의 평균 중 30%를 고려하여 작동합니다. 이러한 유연성은 사용자가 각 자산의 특징과 선호도에 따라 메트릭스를 조정할 수 있도록 하여 더 개인화된 분석을 제공합니다. 30%와 100개 캔들의 선택에 대한 논리: 선택된 백분율과 캔들 수의 신중한 선택은 최근의 중요한 움직임을 포착하여 더 정확한 예측을 제공하려는 것입니다. 이 전략적 접근은 가격이 이동할 가능성이 높은 지역을 강조하여 트레이더에게 더 잘 통찰력을 제공합니다. ATR 프로젝션의 이점: 1. 사용자 정의 가능한 기술적 정확성: 사용자는 각 거래 자산의 특정 조
Long Short Pro
Thalles Nascimento De Carvalho
Long & Short 지표 - Pro 버전: 무한한 시장 분석 잠재력을 열어보세요! 모든 자산에 제한 없이 사용 Long & Short 지표의 Pro 버전은 모든 금융 자산에서 완전한 자유를 제공합니다. 이제 제한 없이 동일한 지표를 모든 선호 자산에 적용할 수 있습니다! 제한 없음 지표의 모든 기능을 제한 없이 사용하세요. Pro 버전은 완전하고 무제한의 경험을 제공하며, 모든 시장 기회를 최대한 활용할 수 있게 해줍니다. Pro 버전의 특징 무제한 접근 : 모든 금융 자산에서 지표를 사용하고 그 잠재력을 최대한 발휘하세요. 고급 정밀도 : 상세한 분석과 명확한 신호를 통해 정보에 기반한 안전한 결정을 내리세요. 완전한 유연성 : 자산이나 전략에 관계없이 거래 요구에 맞게 지표를 조정하세요. 중요한 기회에 대한 알림 받기 알림을 활성화하여 중요한 수준을 주의 깊게 모니터링하고 시장 기회에서 항상 앞서 나가세요. EA 구축을 위한 버퍼 파라미터
Didi Index Volume
Thalles Nascimento De Carvalho
디디 지수 볼륨(Didi Index Volume)을 소개합니다. 이는 브라질 트레이더 오디르 아기아르(Odir Aguiar)이 개발한 기술적 분석 지표로, 금융 시장에서 기회를 식별하는 고급이고 강력한 접근 방식으로 주목받고 있습니다. 다양한 플랫폼에서 이용 가능한 디디 지수 볼륨은 정확한 통찰력과 가치 있는 정보를 찾는 트레이더들에게 필수적인 도구가 되었습니다. 이 지표는 오디르 아기아르가 개발한 유명한 디디 지수(Didi Index)와 거래량의 지능적인 활용을 결합합니다. 이 조합은 가격 동작과 거래량의 상호작용을 더 깊게 분석하여 자산의 움직임에 대한 독특한 시각을 제공합니다. 정교한 알고리즘과 가중 평균 계산을 통해 디디 지수 볼륨은 거래량을 기반으로 가격 변동을 예측할 수 있습니다. 이 기능은 신흥 트렌드, 시장 반전 및 적시적인 진입 및 청산 시점을 파악하는 데 매우 중요합니다. 디디 지수 볼륨을 사용하면 정확한 시장 해석을 돕고 허무맹랑한 결정을 피할 수 있는 객관
TimeChannel
Thalles Nascimento De Carvalho
The "Timechannel" is a powerful technical analysis tool designed specifically for traders who want to gain deeper and more accurate insights into price movements across multiple timeframes (multi-timeframe). This indicator is an essential addition to the toolbox of any serious trader seeking to make informed and data-driven trading decisions. Key Features: Advanced Multi-Timeframe Analysis : Timechannel allows traders to analyze price movements on different timeframes simultaneously. This is cr
Master OBV
Thalles Nascimento De Carvalho
MasterOBV: 시장 트렌드를 정확하게 파악하세요! MasterOBV 는 거래량 , 긍정적 상관관계 및 **이동 평균선(MA)**을 결합한 기술 분석 지표 로, 금융 시장에서 트렌드를 식별하는 능력을 향상시킵니다. 주요 기능: 스마트 거래량: 거래량을 분석하여 트렌드 강도의 중요한 변화를 식별합니다. 긍정적 상관관계: 상관된 자산을 포함하여 보다 넓고 정확한 시각을 제공하며, 쌍의 거래량을 기반으로 가격 이동 잠재력을 강화합니다. 비주얼 채널: 비주얼 채널을 사용하여 트렌드의 지속성과 반전 가능성을 명확하고 정확하게 평가하며 직관적인 시각 분석을 제공합니다. 스무딩 이동 평균선: MA는 가격의 변동을 부드럽게 하여 기본 트렌드 방향을 더 쉽게 식별할 수 있게 합니다. 왜 MasterOBV를 선택해야 하는가? 결정에 대한 자신감: 여러 요소를 통합하여 신뢰를 가지고 진입 및 퇴출 결정을 내릴 수 있도록 도와줍니다. 종합 분석: 가격뿐만
VolaMetrics VSA
Thalles Nascimento De Carvalho
VolaMetrics VSA | 기술 분석의 강력한 동반자 VolaMetrics VSA 는 Volume Spread Analysis (VSA) 방법론과 자세한 거래량 분석 을 결합한 기술 분석 지표입니다. 중요한 가격 변동 을 식별 하고 추적 하기 위해 설계된 이 도구는 거래량 과 가격 스프레드 의 상호작용을 활용하여 트레이딩 결정에 도움이 되는 귀중한 통찰을 제공합니다. Volume Spread Analysis (VSA)의 기초 **Volume Spread Analysis (VSA)**는 기술 분석에서 존경받는 방법으로, 거래량 , 가격 스프레드 및 종가 간의 관계를 특정 기간 내에 이해하는 데 중점을 둡니다. 가장 정보가 풍부한 운영자 ( 스마트 머니 )가 가격 움직임에 영향을 미친다는 개념에 기반하여, VSA는 축적 또는 분배 신호 를 식별하고 가격의 중요한 변화를 예측합니다. VolaMetrics VSA의 작동 원리 ️ VolaMetrics VSA 는 전통적인 V
SwingVolumePro
Thalles Nascimento De Carvalho
개요 SwingVolumePro 는 다양한 금융 자산에 적용할 수 있도록 설계된 고급 다목적 지표입니다. 엄격한 거래량과 가격 분석을 기반으로 개발되었으며, 모든 수준의 트레이더가 고품질 데이터에 기반하여 정보에 입각한 결정을 내릴 수 있도록 명확하고 정확한 신호를 제공합니다. SwingVolumePro.PDF 주요 특징 다재다능성: SwingVolumePro는 주식, 외환, 암호화폐 등 다양한 자산에 적용할 수 있습니다. 스캘핑에서 장기 포지션까지 다양한 거래 전략에 적합합니다. 정확하고 신뢰할 수 있는 신호: SwingVolumePro는 가격 흡수 패턴과 시장 공격을 식별하기 위해 복잡한 기술을 사용하여 높은 정확도의 신호를 제공합니다. 이러한 신호는 명확하게 표시되어 신속하고 효과적인 의사 결정을 돕습니다. 고급 거래량 및 가격 분석: 이 지표는 거래량과 가격 간의 상호 작용을 상세히 분석하여 노력과 결과 간의 불일치를 감지하고, 잠재적인 시장 움
CVD SmoothFlow Pro
Thalles Nascimento De Carvalho
CVD SmoothFlow Pro - 모든 자산에 대한 무제한 볼륨 분석! CVD SmoothFlow Pro 는 정밀하고 무제한의 볼륨 분석을 원하는 트레이더를 위한 최적의 솔루션입니다. Cumulative Volume Delta (CVD) 계산과 고급 노이즈 필터링을 활용하여, Pro 버전은 모든 금융 자산 거래에 필요한 유연성과 정확성을 제공합니다. CVD SmoothFlow Pro가 제공하는 기능: 명확한 분석 : 시장 노이즈를 필터링하고 모든 금융 자산에서 중요한 볼륨 변동을 강조합니다. ️ 정확한 계산 : 매수와 매도 차이를 모니터링하여 외환, 지수, 암호화폐 등 자산의 볼륨 행동을 상세히 제공합니다. 직관적인 인터페이스 : 데이터가 명확하게 제시되어 분석이 쉽고 효율적입니다. 트렌드 식별 : 시장 트렌드를 자신 있게 식별하여 정보에 기반한 결정을 지원합니다. 실용적인 적용: 모든 자산의 실시간 매수자와 매도자 균형을 모니터링합니다. 볼륨을 기반
Cumulative Vol Bands
Thalles Nascimento De Carvalho
CVB Cumulative Volume Bands: 누적 거래량으로 트레이드를 강화하세요! CVB Cumulative Volume Bands 는 누적 거래량에 기반한 정확한 신호를 찾는 트레이더를 위해 설계된 고급 지표입니다. 이 지표는 누적 거래량 밴드를 사용하여 시장의 매수 및 매도 압력을 명확하게 읽고, 반전 및 강력한 가격 변동을 식별하는 데 도움을 줍니다. 주요 특징: 누적 거래량 분석 : 거래량을 기반으로 주요 압력 지점을 감지합니다. 명확한 진입/퇴출 신호 : 실시간으로 기회를 포착하세요. 쉬운 해석 : 사용자 친화적인 인터페이스와 간단한 시각적 표현. 모든 자산 및 시간 프레임에 적합 : 모든 시장에서 언제든지 사용 가능합니다. CVB Cumulative Volume Bands 로 한 발 앞서 나가며 자신감을 가지고 트레이딩 결정을 개선하세요! 피드백을 남기시고 개선에 도움을 주세요!
ZigWave Oscillator
Thalles Nascimento De Carvalho
ZigWave Oscillator: 오실레이터와 ZigZag로 거래를 강화하세요! ZigWave Oscillator는 금융 시장 분석에서 정확성과 명확성을 추구하는 트레이더를 위한 완벽한 도구입니다. 이 지표는 오실레이터의 강점과 ZigZag의 시각적 단순성을 결합하여 최고의 매수 및 매도 기회를 신속하고 효율적으로 식별할 수 있도록 도와줍니다. ZigWave Oscillator를 선택해야 하는 이유 정밀한 오실레이터 분석 : RSI, Williams %R 또는 CCI를 통합하여 시장의 주요 움직임을 포착합니다. 동적 ZigZag와 세밀한 조정 : ZigZag 스윙은 오실레이터의 과매수 및 과매도 영역에서 세밀하게 조정되어 반전 포인트를 명확히 강조합니다. 완전한 커스터마이즈 ️: 오실레이터와 ZigZag의 설정을 조정하여 자신의 전략에 맞게 최적화할 수 있습니다. 직관적이고 사용하기 쉬운 디자인 세련되고 사용자 정의 가능한 시각적 레이아웃으로 Zig
Imbalance DOM Crypto
Thalles Nascimento De Carvalho
Imbalance DOM Crypto: 암호화폐 주문서의 불균형으로 거래를 강화하세요 작은 가격 변동의 기회 Imbalance DOM Crypto는 암호화폐의 주문 흐름을 다루는 분석가에게 필수적인 도구입니다. 스캘퍼에게 완벽하게 적합하며, 작은 가격 변동을 높은 정확도로 활용하고자 하는 트레이더를 위해 개발되었습니다. 고급 계산을 통해 이 지표는 주문서의 불균형을 식별하고 빠른 진입 및 탈출을 위한 귀중한 신호를 제공합니다. 중요: Binance 데이터 수집 스크립트 및 설정 Imbalance DOM Crypto가 제대로 작동하려면 Book Data Binance 스크립트를 로드해야 합니다. 이 스크립트는 Binance에서 직접 주문서 데이터를 가져와 지표가 실시간으로 구매 및 판매 정보를 액세스하여 정확한 계산을 생성할 수 있도록 합니다. 스크립트가 활성화되어 있고 올바르게 구성되어 있는지 확인하여 지표가 실시간으로 주문서의 불균형을 캡처할 수 있도록 해야
Times and Sales Crypto
Thalles Nascimento De Carvalho
Times and Sales Crypto: Times and Sales로 암호화폐 거래를 강화하세요 작은 가격 변동을 정밀하게 활용 Times and Sales Crypto 는 암호화폐의 주문 흐름을 거래하는 데 필수적인 도구입니다. 스캘퍼에게 적합하며, 작은 가격 변동을 높은 정확도로 활용하고자 하는 트레이더를 위해 설계되었습니다. 고급 계산을 통해 이 지표는 times and sales 데이터를 활용하여 빠른 진입과 퇴장을 위한 귀중한 신호를 제공합니다. 중요: Binance 데이터 수집 스크립트 설정 Times and Sales Crypto 가 정상적으로 작동하려면 Volume Flow Binance 스크립트를 로드해야 합니다. 이 스크립트는 Binance에서 times and sales 데이터를 직접 수집하여 지표가 실시간 거래 데이터를 가져와 정확한 계산을 할 수 있도록 합니다. 스크립트가 활성화되어 있고 올바르게 설정되었는지 확인하여 지표가 실시간 거래
Mini Indice Composition
Thalles Nascimento De Carvalho
Mini Índice Composition: A Revolução na Análise do Mini Índice! O Mini Índice Composition é um indicador inovador que monitora em tempo real as principais ações que compõem o mini índice, trazendo uma visão quantitativa poderosa sobre o fluxo de ordens do mercado! Como Funciona? Diferente de outros indicadores que utilizam apenas dados históricos, o Mini Índice Composition faz uma leitura ao vivo das ordens que entram e saem das ações, pesando o impacto direto no mini índice. Com
필터:
gustavonbeck
25
gustavonbeck 2025.01.24 11:01 
 

Excelente indicador! Um dos melhores que já adquiri! Parabéns!

Thalles Nascimento De Carvalho
7540
개발자의 답변 Thalles Nascimento De Carvalho 2025.01.24 12:37
Obrigado pelo seu feedback! 🙌 É um indicador extraordinário, mas não o recomendo para iniciantes, pois é necessário ter um conhecimento básico de leitura de volume e preço. 📊
fabioa333
19
fabioa333 2024.01.23 15:19 
 

Ótimo indicador, para quem já possui um operacional, desenvolvedor sempre disponível para esclarecimento de eventuais dúvidas.

Thalles Nascimento De Carvalho
7540
개발자의 답변 Thalles Nascimento De Carvalho 2024.01.23 15:24
Obrigado! 🙏
guigbz
19
guigbz 2023.12.20 15:00 
 

Indicador com alto nível de acerto, ajuda muito na tomada de decisão. O desenvolvedor é muito atencioso e prestativo quanto ao uso do indicador.

Thalles Nascimento De Carvalho
7540
개발자의 답변 Thalles Nascimento De Carvalho 2024.01.05 16:43
Obrigado pelo feedback! 🙏
Algoritmo poderoso em indices ,principalmente no WIN e WDO.
리뷰 답변
버전 2.5 2024.05.16
atualização no menu input
버전 2.4 2024.05.14
Adicionado swing de volume (Esforço Vs Resultado)
버전 2.3 2024.04.22
Adicionado taxa de juros DI (correlação )
버전 2.2 2024.01.29
Adicionado volume profile!
버전 2.1 2024.01.17
Adicionado alerta email
버전 2.0 2024.01.12
added arrows for structure breach.
버전 1.6 2023.11.30
Update das marcações
버전 1.5 2023.11.29
Ajuste na contagem do volume.
버전 1.4 2023.11.21
Ajuste nas as targets
버전 1.3 2023.11.20
Otimização em objetos onchart
버전 1.2 2023.11.17
Melhorias no uso de hardware.