Black Horse indicator
- 지표
- Shengzu Zhong
- 버전: 1.21
- 업데이트됨: 18 11월 2023
- 활성화: 10
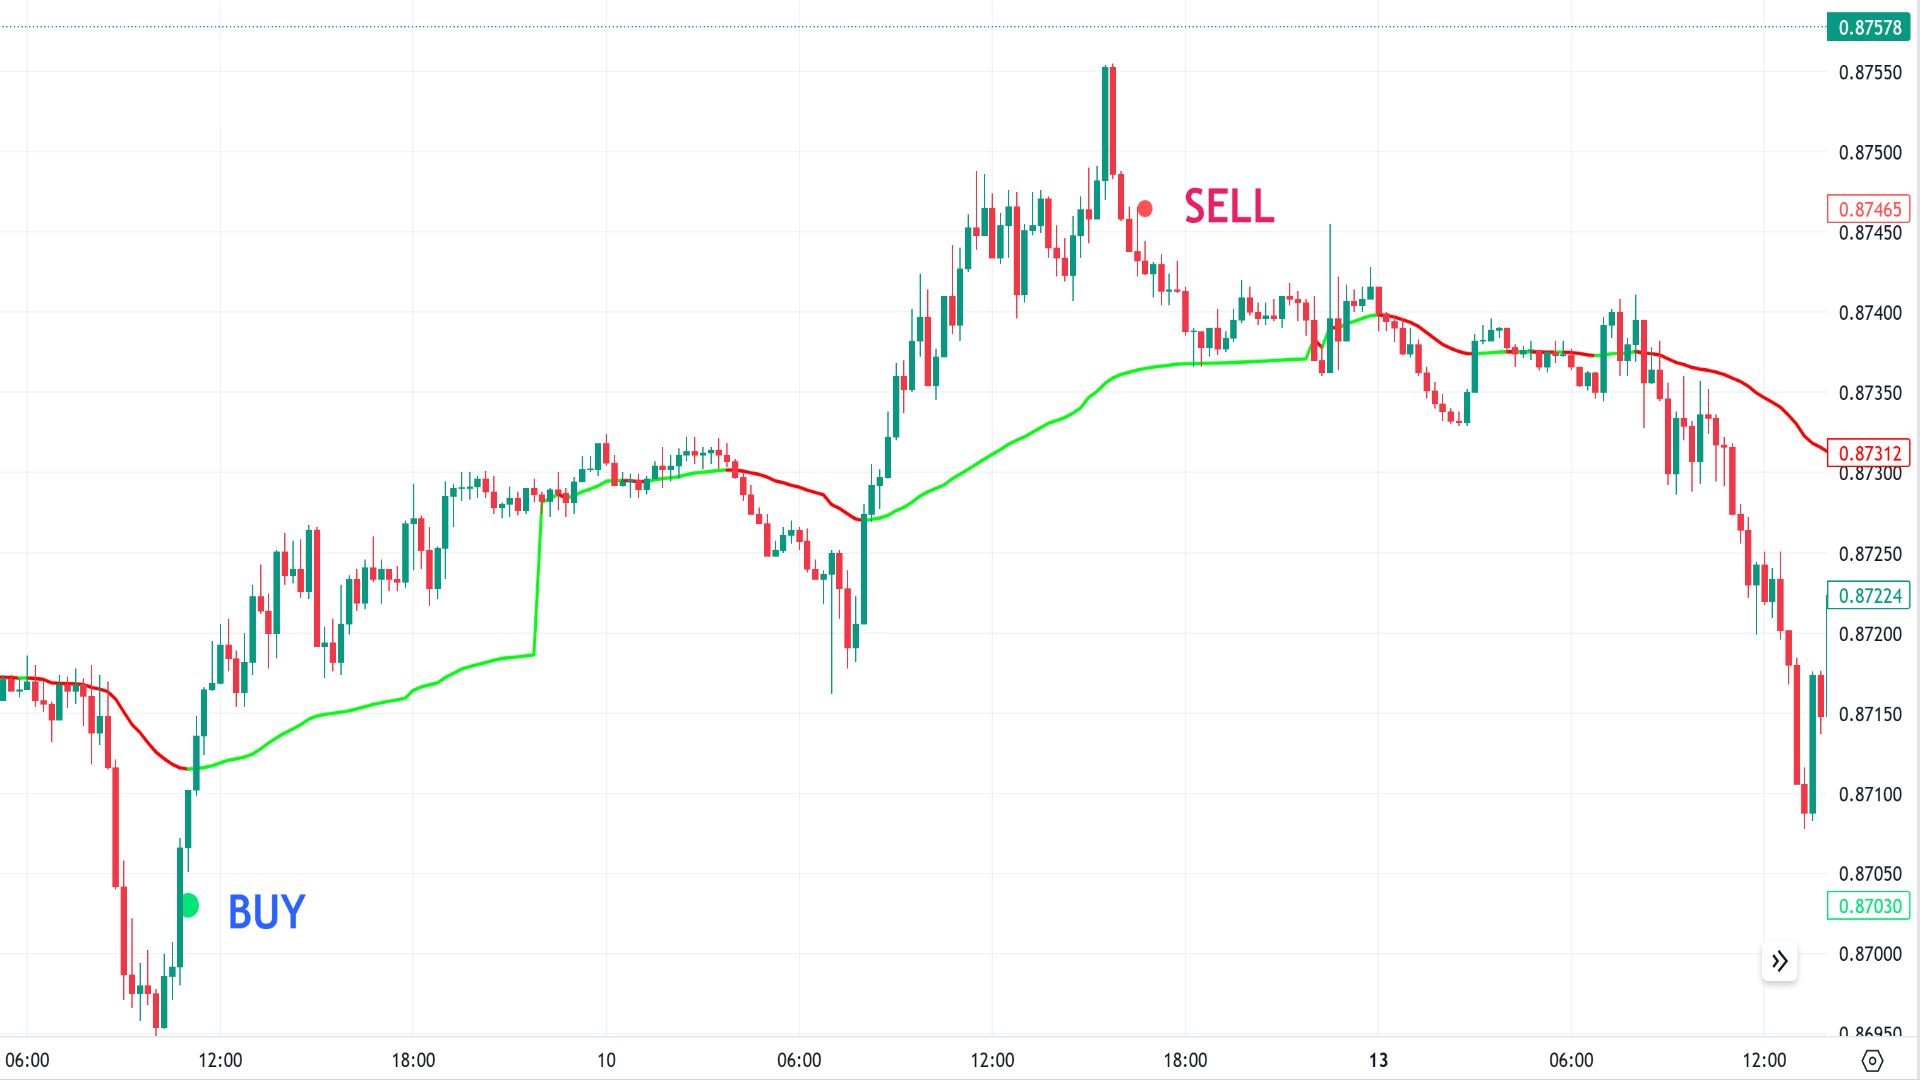
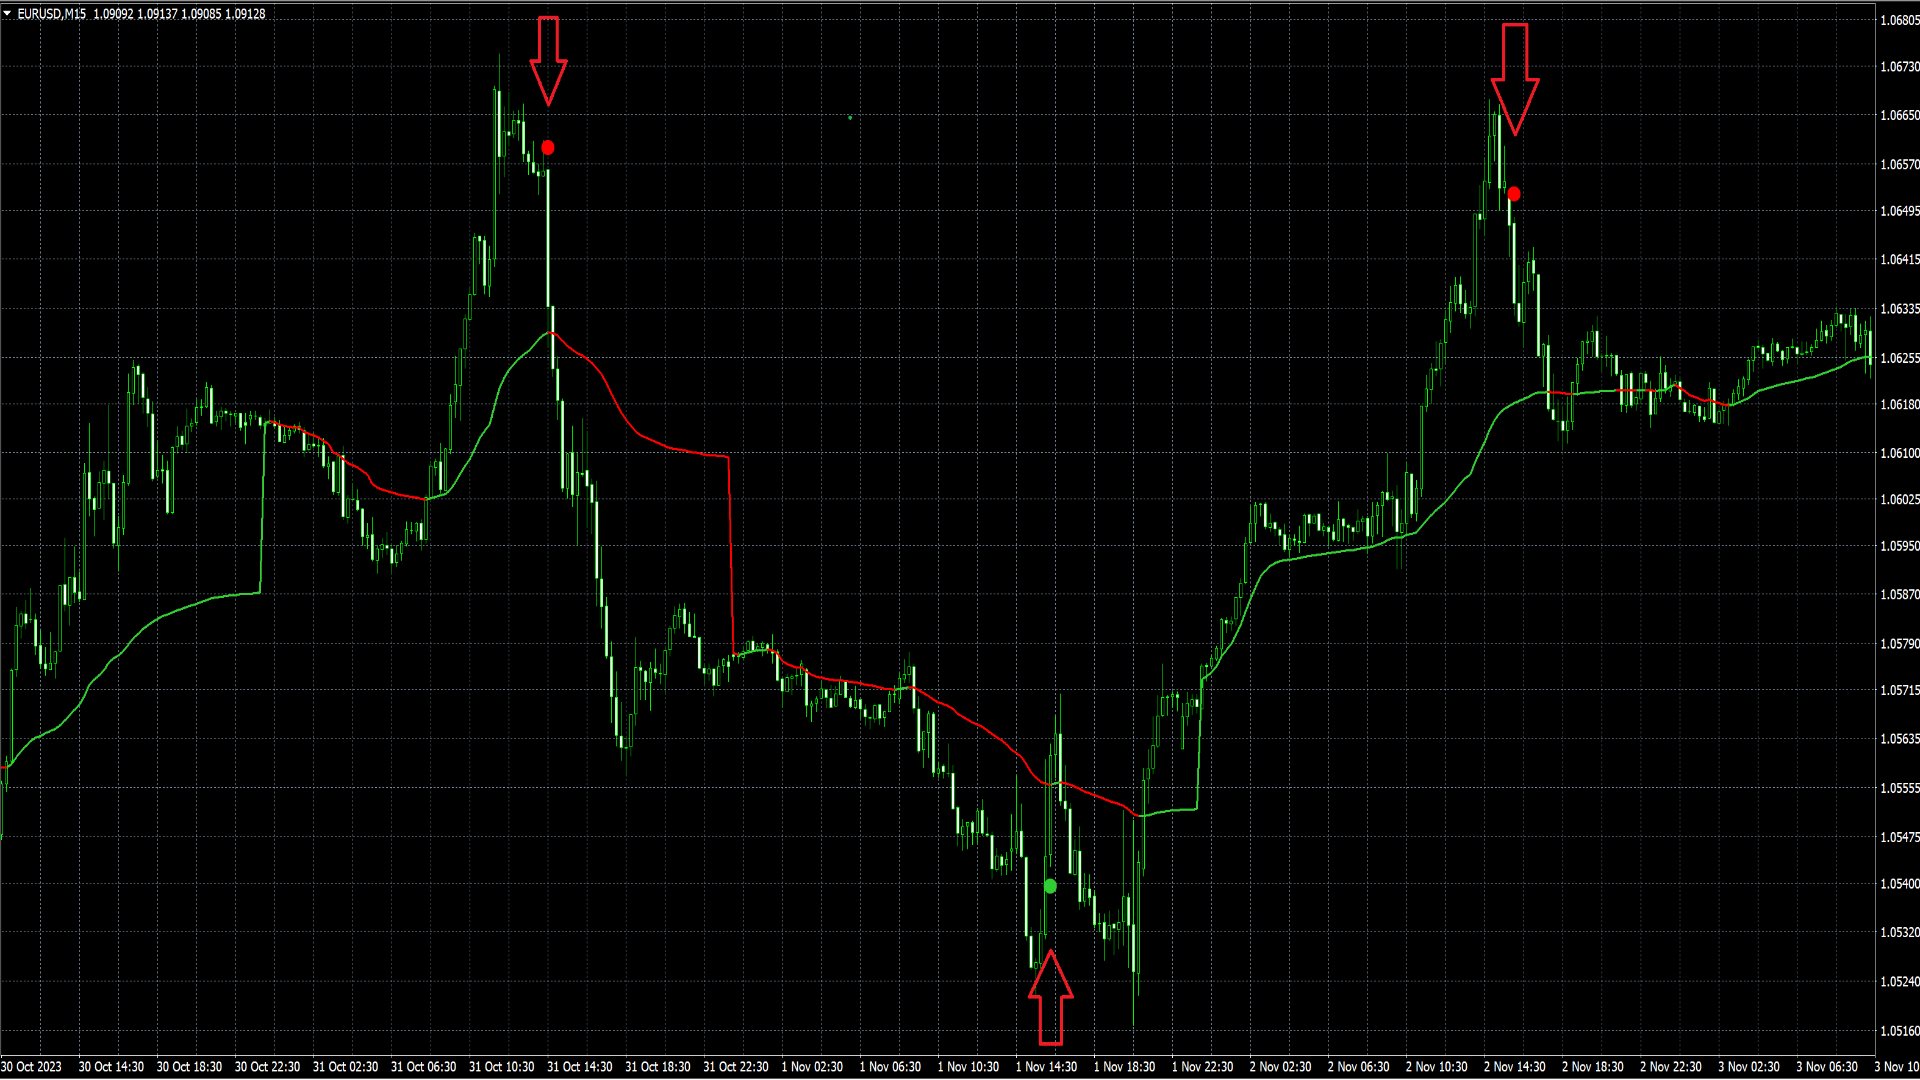
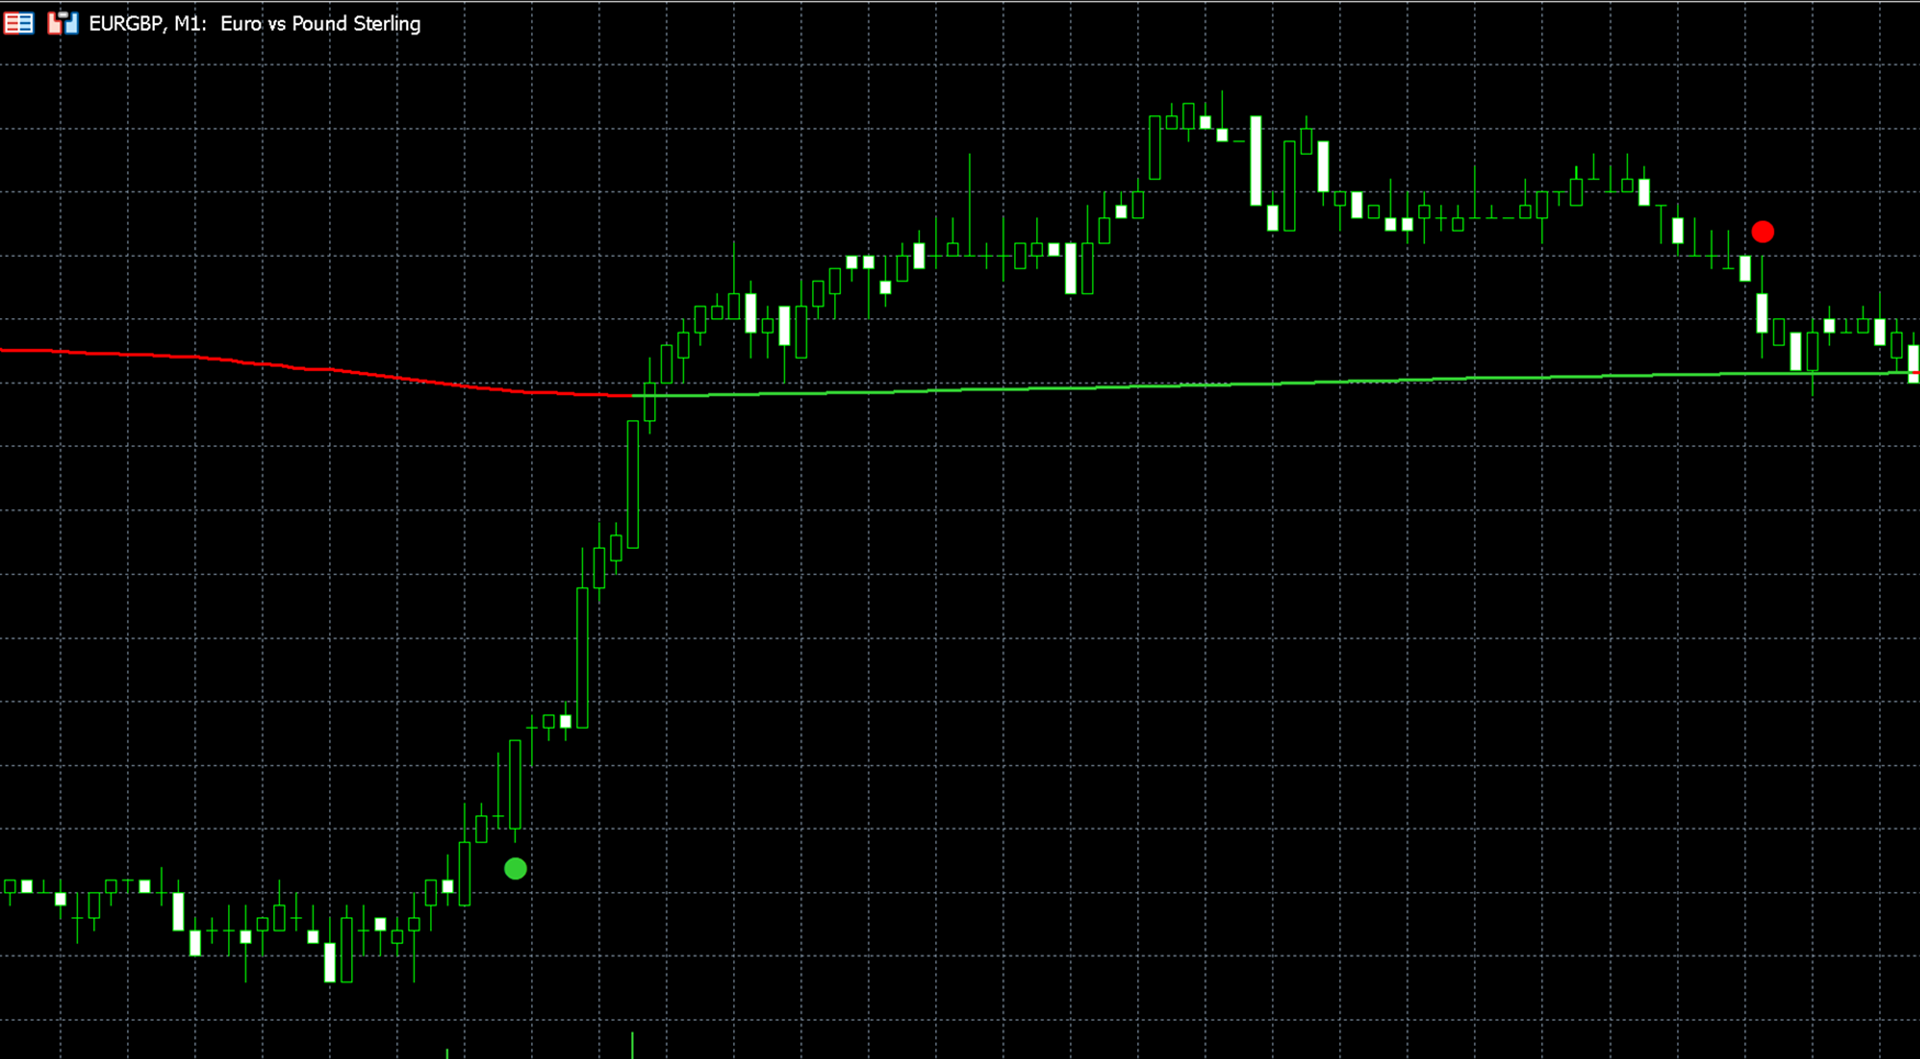
"Black Horse" 지표의 목표는 가격 행동과 VWAP 지표 간의 차이를 식별하는 것입니다. 이 지표는 잠재적으로 거짓된 차이를 걸러내고 고품질 및 정확한 경고를 생성하기 위해 필터를 사용합니다.
하락 차이는 양봉 위에 표시되는 빨간 점으로, 상승 차이는 양봉 아래에 있는 초록 점으로 나타납니다.
주된 차이 필터는 ATR(평균 실제 범위)와 되돌아보는 기간 내 이전 양봉의 가격 움직임을 중심으로 합니다. 가격 움직임이 ATR 곱하기 ATR 배수를 초과하는 충분한 강도로 나타날 때 차이가 확인됩니다.
계산 특성 상, 더 높은 시간 프레임에서 작업할 때 ATR 배수 및 되돌아보는 기간에 더 낮은 값을 설정하는 것이 좋습니다. 더 높은 시간 프레임에서는 가격 움직임이 보다 부드러워지므로 예를 들어 15분 차트에서처럼 급격한 가격 변동이 덜 발생하고 일반적으로 낮은 시간 프레임보다 더 적은 양봉 내에서 발생합니다. HSBC, 또는 BAC와 같이 변동성이 낮은 주식은 낮은 ATR 배수 및 짧은 되돌아보는 기간을 사용해야 합니다.
"시각적 설정" 섹션에서는 VWAP 선의 색상을 변경하고, 교대로 나타나는 VWAP 색상을 표시하며, 차이 신호의 크기를 조절하고, VWAP 선을 표시하거나 숨길 수 있는 옵션이 있습니다.
사용자가 평가에 대한 코멘트를 남기지 않았습니다