• 미리보기
  • 리뷰
  • 코멘트

MACD ZigZag AI Divergence Alert

이 지표는 클래식 MACD와 지그재그 지표를 결합하여 가격과 지표 간의 차이를 감지합니다. 또한 첨단 인공지능(AI) 기술을 사용해 발산의 타당성을 탐지한다.

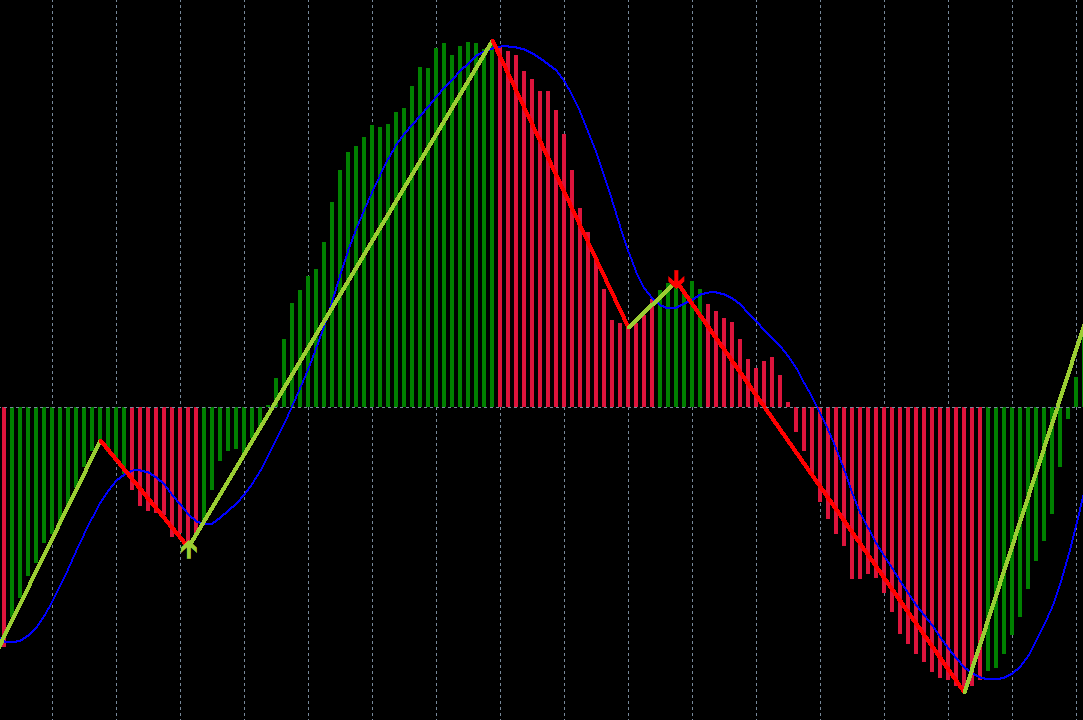
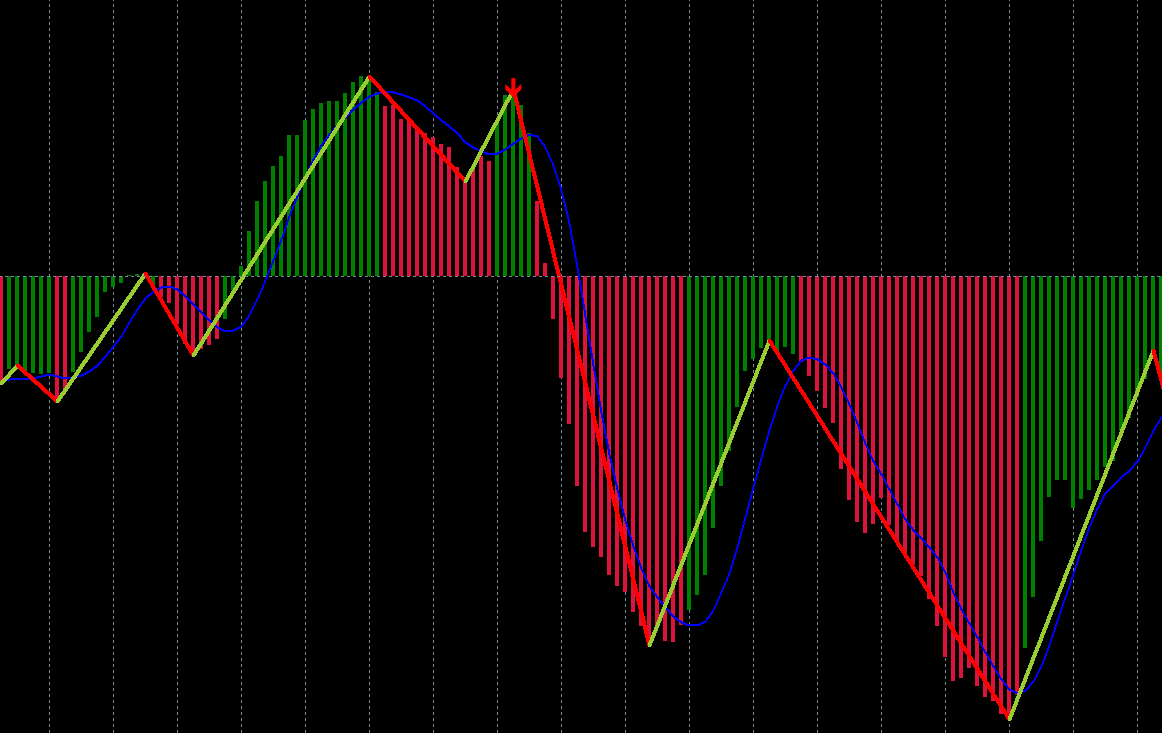
MACD는 '지표의 왕'으로 알려져 있으며 지그재그도 매우 유용한 지표입니다. 이 두 지표를 결합함으로써 이 지표는 두 지표의 장점을 모두 활용합니다.

발산의 탐지는 확률론적 문제이다. 종종 차이가 발생하고 이어서 같은 방향으로 가격이 추가로 이동하는 경우가 있습니다. 따라서 우리는 고급 AI 기술을 사용하여 발산의 유효성을 판단하고 유효하지 않은 발산을 필터링한 다음 다양한 방법으로 사용자에게 경고하려고 합니다.
할인 가격:59$
특징
* MACD 형식의 지그재그 표시기
* 가격과 MACD 지표 간의 차이를 감지합니다.
* AI 기술을 사용하여 발산의 타당성을 감지합니다.
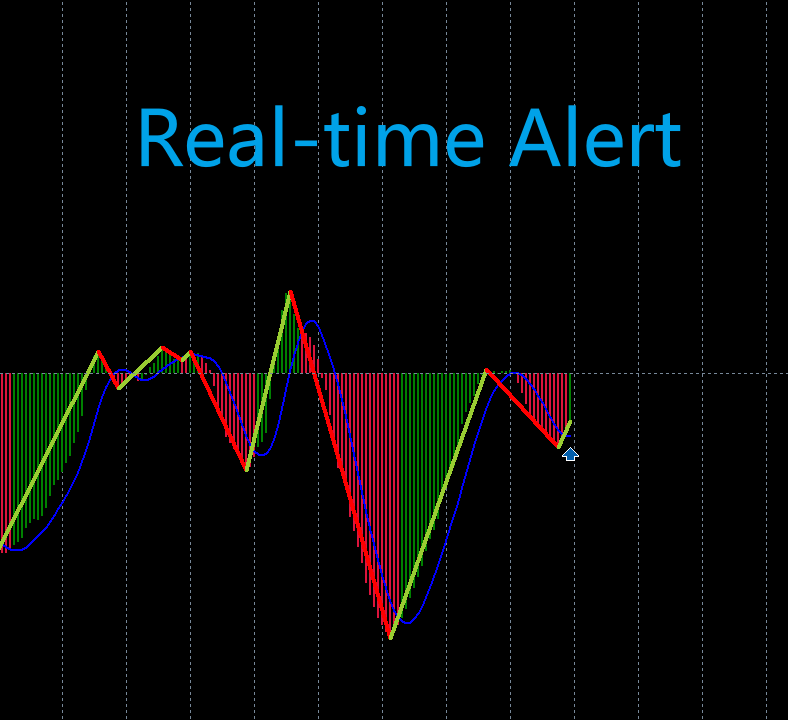
* 사용자에게 발산 신호를 경고합니다.
* 휴대폰을 통해 사용자에게 발산 신호를 경고합니다.
* 이메일을 통해 사용자에게 발산 신호를 경고합니다.
* 여러 시간대 지원
* 강력한 ONNX(Open Neural Network Exchange) 모델 형식을 사용합니다.

용법
바닥 발산:
단일 MACD가 아래를 교차할 때 지표는 그것이 바닥 다이버전스인지 여부를 감지합니다. 그렇다면 표시기는 위쪽 화살표를 그려 사용자에게 경고합니다.

최고 차이:
단일 MACD가 위를 교차하면 표시기는 그것이 상단 다이버전스인지 여부를 감지합니다. 그렇다면 표시기는 아래쪽 화살표를 그려 사용자에게 경고합니다.

입력 매개변수
빠른 EMA 기간 = 12;
느린 EMA 기간 = 26;
신호 SMA 기간 = 9;
적용가격 = PRICE_CLOSE;
MaxCalculateBars = 2000;
UseAlertNotify = true;
UseMetaQuotesIDNotify = true;
UseMailNotify = true;
NofityPreMessage = "MACD 지그지그 ";
하위 창 = 1;

태그:상위 다이버전스,하위 다이버전스,가격 조치,스캘핑 전략,다중 지표,스마트 지표,발산 인식,스윙 트레이딩,ONNX
추천 제품
MACD Divergence on MT5
KEENBASE SOFTWARE SOLUTIONS
KT MACD Divergence shows the regular and hidden divergences build between the price and oscillator. If your trading strategy anticipates the trend reversal, you can include the MACD regular divergence to speculate the potential turning points. And if your trading strategy based on the trend continuation, MACD hidden divergence would be a good fit. Limitations of KT MACD Divergence Using the macd divergence as a standalone entry signal can be a risky affair. Every divergence can't be interpr
Paula Bollinger Bands Strategy
Francisco Gomes Da Silva
4 (2)
Bollinger bands out/in strategy A strategy created by Joe Ross, and very useful for finding trades when the market is overloaded. Indicator You don't need to find where there are entries on the chart, this indicator shows them for you. The entrance The trade is confirmed when the price closes outside the bollinger bands on a candle and the candle after the price closes inside the bands. comment I want to improve this indicator, so you can help me sending me your reviews and comments, thanks :).
FREE
Wolfe Wave Scanner MT5
Reza Aghajanpour
5 (5)
**  All Symbols  x  All Timeframes  scan just by pressing scanner button ** *** Contact me  to send you instruction and add you in "Wolfe Wave Scanner group" for sharing or seeing experiences with other users. Introduction: A Wolfe Wave is created with five-wave patterns in price. It shows supply and demand and a fight towards a balance price. T hese waves of price actions can help traders identify the boundaries of   the trend . Also  It helps forecast how the price will move in the near futu
Introducing the Consecutive Green/Red Candle Alert Indicator for MT5 - Your Trend Spotting Companion! Are you ready to take your trading to the next level? We present the Consecutive Green/Red Candle Alert Indicator, a powerful tool designed to help you spot trends and potential reversals with ease. Whether you're a new trader looking for clarity in the market or an experienced pro seeking additional confirmation, this indicator is your trusted companion. Key Features of the Consecutive Gre
Divergence ONE
Enrico Schmidke
The indicator identifies divergences between chart and RSI, with the possibility of confirmation by stochastics or MACD. A divergence line with an arrow appears on the chart when divergence is detected after the current candle has expired. There are various filter parameters that increase the accuracy of the signals. To identify a divergence, point A must be set in the RSI, then point B Value must be edited, which sets the difference between point A and point B. The indicator can be used for tim
MACD Intraday Trend PRO는 1960년대 Gerald Appel이 만든 원본 MACD를 개조하여 개발한 지표입니다. 수년간의 거래를 통해 MACD의 매개변수를 피보나치 비율로 변경함으로써 추세 움직임의 연속성을 더 잘 표현함으로써 가격 추세의 시작과 끝을 보다 효율적으로 감지할 수 있다는 것이 관찰되었습니다. 가격 추세를 감지하는 효율성으로 인해 상단과 하단의 차이를 매우 명확하게 식별하여 거래 기회를 더 잘 활용할 수도 있습니다. 특징 표시기 MACD Intraday Trend PRO는 모든 통화 쌍, 모든 시간대 및 Renko 차트에서 작동합니다. 5가지 모드를 선택하여 추세 감지 속도를 설정할 수 있습니다. 가장 빠른 빠른 정상 느린 가장 느림 자원 6개의 구성 가능한 경고가 있습니다. MACD는 신호 라인에서 후퇴 MACD가 신호선을 넘다 MACD는 레벨 0을 교차 신호선이 레벨 0을 넘습니다. MACD 변경 트렌드 색상 신호선 변경 TRE
This indicator combines double bottom and double top reversal chart patterns together with detection of divergences between the price chart and the Momentum oscillator. Features Easily detect strong reversal signals Allows to use double top/bottom and Momentum divergence signals combined or independently Get email and/or push notification alerts when a signal is detected Custom colors can be used The indicator is not repainting Can easily be used in an EA (see below) Inputs ENABLE Double Top
MACD (short for Moving Average Convergence/Divergence) is one of the most famous and oldest indicators ever created and is widely used among   beginners . However, there is a newer version of the MACD that is named   Impulse MACD   which have less false signals than the standard MACD. Classic MACD helps us to identify potential   trends   by displaying   crossovers   between two lines. If MACD line crosses above the Signal line it shows us that the market is potentially   up   trending and that
This indicator combines double bottom and double top reversal chart patterns together with detection of divergences between the price chart and the MACD oscillator. Features Easily detect strong reversal signals Allows to use double top/bottom and MACD divergence signals combined or independently Get email and/or push notification alerts when a signal is detected Custom colors can be used The indicator is not repainting Can easily be used in an EA (see below) Inputs ENABLE Double Top - Botto
MACDivergence MTF MT5
Pavel Zamoshnikov
4 (5)
Advanced ideas of the popular MACD indicator: It detects and displays classic and reverse divergences (two methods of detecting divergences). It uses different color to highlight an uptrend and a downtrend. Two methods of determining a trend: а) MACD crosses the 0 level (classic signal); б) MACD crosses its own average (early signal). This is a multi-timeframe indicator: it can display MACD data from other timeframes. Two methods of drawing: classic histogram and line. It generates sound and vis
Larry Williams
Danrlei Hornke
Created by trader and journalist Larry Williams, Setup 9.1 is a simple strategy that is easy to understand and execute, which is why it is so well known and popular in the world of traders and technical analysis. It is a REVERSION setup, where operations are sought when the moving average changes direction. Setup Logic With the open candlestick chart, at any time chart, it is only necessary to add the 9-period Exponential Moving Average (MME9). That done, we look for assets in which the MME
Binary MACD
Bogdan Kupinsky
Индикатор, показывающий момент преодоления нулевой отметки индикатора MACD.  Подходит для бинарной торговли, т.к. имеется возможность посчитать точность сигналов, в зависимости от времени экспирации. Входные параметры Period of SMA1  - Период 1 скользящей средней Period of SMA2 -  Период 2 скользящей средней Period of SMA3 -  Период 3 скользящей средней Price Type - Тип цены, используемый индикатором MACD Invert signals  - Возможность давать инвертированные сигналы (для работы по тренду) Infor
"Hunttern harmonic pattern finder" base on the dynamic zigzag with the notification and prediction mode This version of the indicator identifies 11 harmonic patterns and predicts them in real-time before they are completely formed. It offers the ability to calculate the error rate of Zigzag patterns depending on a risk threshold. It moreover sends out a notification once the pattern is complete. The supported patterns: ABCD BAT ALT BAT BUTTERFLY GARTLEY CRAB DEEP CRAB CYPHER SHARK THREE
DYJ 슈퍼 트렌드파는 매우 정확한 봉우리와 파도 밸리 거래 시스템이다. 이 지표는 시장에 진출할 때 촛불선의 최고점과 최저점을 찾는다. 신호의 알림 유형이 dyj supertrend 에 추가되었습니다. 다중 공간 신호를 생성할 때, Alert mailSend, MobilePush 등의 유형의 알림 신호를 사용할 수 있습니다. Input InpSignalPeriod = 10 BarDistance = 24 InpIsAlert = true ============================= DYJ Super Trend Wave ist ein hochpräzises Handelssystem. Dieser Indikator sucht nach den höchsten und niedrigsten Punkten der Kerzenlinien, wenn sie in den Markt gehen. Der Benachrichtigungstyp für das
Macd Neptuno
Ignacio Agustin Mene Franco
Macd Neptune! It is a modified macd oscillator where it better captures sales and purchases the indicator clearly marks the crossing of moving averages, In addition to that, it marks the purchase and sale with each color, for sale marks the salmon line in the purchase mark the blue line where it gives you the signal changing color is giving you the entrance! It is used in any temporality, used for forex markets and synthetic indices good profit World Investor
Golden Swings
Arnold Byarufu
"GoldenSwing" is a comprehensive MetaTrader 5 indicator meticulously crafted by Southern Star Trading, designed to enhance your trading strategies with precision swing high and swing low identification. Harnessing the power of swing analysis, this indicator provides traders with invaluable insights into market reversals and trend continuations, enabling them to make informed trading decisions. With its advanced algorithm, GoldenSwing detects significant swing highs and swing lows in real-time
TPM cross indicator
Ekaterina Saltykova
TPM Cross (trend power moving cross) - is a trend following strategy based on custom signal points. Indicator consists from main custom moving chart line and trend power line. Indicator defines up and down movements by it's trend power and custom moving direction. When current market's trend looses it's power and opposite trend starts - power trend line  crosses moving and indicator plots an arrow.  Main indicator's adjustable inputs : movingPeriod - period of moving line  trendPeriod  - period
Buy CTS scalping indicator, provide buying and selling signals, automatic channeling and sending signals to mobile phones Using technical analysis and price action methods and modern methods, CTS indicator can draw price channels and recognize price trends with high accuracy and issue entry and exit signals according to them. Traders can easily fluctuate using this indicator in different time frames and in different markets. With the CTS indicator, you can signal in different ways. This indicat
Modified Bollinger Bands
Gennadiy Stanilevych
The standard Bollinger Bands indicator has been improved by integrating additional indications from the Standard Deviation indicator (StdDev), which gives an additional filter for confirming trading signals. In addition, the color of the indicator's lines shows the beginning of a trend, its development and exhaustion. This indicator has a signal block that notifies the trader of the beginning of the trend on any time frame to which it is attached. Settings Type of messages - select the type of
Two Lines MT5
Andrey Kaunov
5 (1)
Индикатор показывает две линии динамики движения двух инструментов. Если один из коррелирующих инструментов убегает, другой будет его догонять. Этот принцип даёт точки входа в сделку по их кроссу или для синхронной покупки и продажи в парном трейдинге. Гистограмма индикатора показывает значение дистанции между   линиями инструментов. При уменьшении и увеличении дистанции гистограмма принимает разные цвета. Треугольный значок показывает текущее состояние линий: расхождение ( Divergence ) или схо
This indicator can automatically scan the RSI values of all varieties on the mt5 and set an alarm. Note that it is fully automatic scanning, you do not need to enter which varieties, do not need to open the variety chart, as long as there are some varieties in the market quotation column, will be automatically scanned to reach the set rsi alarm value, will pop up the alarm, and cycle with the market changes to scan the latest RSI values of all varieties, and alarm. This is very helpful t
ATrend
Zaha Feiz
4.83 (6)
ATREND: 작동 방식 및 사용 방법 ### 작동 방식 MT5 플랫폼을 위한 "ATREND" 지표는 기술 분석 방법론의 조합을 활용하여 트레이더에게 강력한 매수 및 매도 신호를 제공하도록 설계되었습니다. 이 지표는 주로 변동성 측정을 위해 평균 진폭 범위(ATR)를 활용하며, 잠재적인 시장 움직임을 식별하기 위한 트렌드 탐지 알고리즘과 함께 사용됩니다. 구매 후 메시지를 남기면 특별 보너스 선물을 받게 됩니다. ### 주요 특징: - 동적 트렌드 탐지: 이 지표는 시장 트렌드를 평가하고 신호를 조정하여 트레이더가 현재 시장 상황에 맞춰 전략을 조정할 수 있도록 돕습니다. - 변동성 측정: ATR을 사용하여 시장의 변동성을 측정하며, 이는 최적의 손절매(SL) 및 이익 실현(TP) 수준을 결정하는 데 중요합니다. - 신호 시각화: 이 지표는 차트에 매수 및 매도 신호를 시각적으로 표시하여 트레이더의 의사 결정을 향상시킵니다. ### 운영 단계 #### 입력 및 설정 - TimeFr
HLC bar MT5 Wyckoff
Eduardo Da Costa Custodio Santos
MT5에 대한 표시기 "HLC_bar_MT5 Wyckoff"는 거래 시 분석을 용이하게 하기 위해 생성되었습니다. HLC Bar는 Richard Wyckoff가 사용했으며 현재 "VSA" 작업에서 널리 사용됩니다. Wyckoff는 High, Low 및 Close를 사용하면 그래프가 훨씬 더 명확하고 분석하기 쉽다는 것을 발견했습니다. 표시기 "HLC_bar_MT5 Wyckoff"는 다음을 허용합니다. # 막대 너비를 변경합니다. # 막대를 같은 색으로 둡니다. # 그리고 같은 가격으로 열리고 닫힌 바를 강조 표시합니다. 색상과 너비는 설정에서 쉽게 수정할 수 있습니다. 지표를 사용하려면 차트로 끌어다 놓기만 하면 됩니다. Wyckoff는 볼륨과 함께 사용할 때 HLC 차트를 막대 그래프라고 불렀습니다.
Stochastic R
Antony Augustine
Stochastic  Reversal  allows you to recognize reversals professionally. Stochastic Indicator: This technical indicator was developed by George Lane more than 50 years ago. The reason why this indicator survived for so many years is because it continues to show consistent signals even in these current times. The Stochastic indicator is a momentum indicator that shows you how strong or weak the current trend is. It helps you identify overbought and oversold market conditions within a trend.  Rules
MACD Color Histogram
German David Nino Cifuentes
5 (1)
MACD 히스토그램 지표는 트레이더가 시장 동향과 모멘텀 변화를 이해하기 쉽게 하기 위해 설계된 MACD 지표의 업데이트 버전입니다. 원래의 MACD와 달리 이 버전에는 히스토그램이 포함되어 있으며, 이는 MACD 라인과 신호 라인 간의 차이를 보여주는 막대 그래프입니다. 작동 방식은 다음과 같습니다. MACD 라인이 신호 라인 위에 있을 때 강세 시장을 나타내며 히스토그램 막대는 녹색으로 표시됩니다. 반면에 MACD 라인이 신호 라인 아래에 있을 때 약세 시장을 나타내며 히스토그램 막대는 빨간색으로 변합니다. MACD 히스토그램 지표의 흥미로운 점은 시장 모멘텀이 변화함에 따라 막대의 색이 변한다는 것입니다. 따라서 모멘텀이 강세에서 약세로 전환될 때 막대가 녹색에서 빨간색으로 변하고 그 반대의 경우도 마찬가지입니다. 또한 가격 움직임과 MACD 지표 간의 차이를 감지하는 것을 용이하게 하여, 잠재적인 시장 반전을 나타낼 수 있는 쌍의 가능한 다이버전스를 강조하는 데 도움이 되는
A top-quality implementation of the famous Super Trend indicator, which needs no introduction. It is completely loyal to the original algorithm, and implements many other useful features such as a multi-timeframe dashboard.  [ Installation Guide | Update Guide | Troubleshooting | FAQ | All Products ] Easy to trade It implements alerts of all kinds It implements a multi-timeframe dashboard It is non-repainting and non-backpainting Input Parameters ATR Period - This is the average true range per
Your Trend Friend
Luigi Nunes Labigalini
5 (1)
The trend is your friend! Look at the color of the indicator and trade on that direction. It does not  repaint. After each candle is closed, that's the color of the trend. You can focus on shorter faster trends or major trends, just test what's most suitable for the symbol and timeframe you trade. Simply change the "Length" parameter and the indicator will automatically adapt. You can also change the color, thickness and style of the lines. Download and give it a try! There are big movements
This indicator combines double bottom and double top reversal chart patterns together with RSI divergence detection. Features Easily detect strong reversal signals. Allows to use double top/bottom and RSI divergence signals combined or independently. Get email and/or push notification alerts when a signal is detected. Custom colors can be used. The indicator is not repainting. Can easily be used in an EA. (see below) Inputs ENABLE Double Top - Bottom: Enable the double top - bottom indicator
TCandleClose
Wasin Thonkaew
A simple indicator to help showing the remaining time until the candle closes for all pre-defined chart periods with the following formats depending on which timeframe the chart is on. DD:HH:MM:SS - in case of W1, and MN period HH:MM:SS - in case of other periods Included with some of configurations as follows (please see attached inputs screenshot) X/Y distance to the upper right corner of the chart window Text size Text color Show/hide
우선적으로, 이 거래 도구는 전문적인 거래에 이상적인 비-다시 그리기 및 지연되지 않는 지표입니다.  온라인 강좌, 사용자 매뉴얼 및 데모. 스마트 가격 액션 컨셉트 인디케이터는 신규 및 경험 많은 트레이더 모두에게 매우 강력한 도구입니다. Inner Circle Trader Analysis 및 Smart Money Concepts Trading Strategies와 같은 고급 거래 아이디어를 결합하여 20가지 이상의 유용한 지표를 하나로 결합합니다. 이 인디케이터는 스마트 머니 컨셉트에 중점을 두어 대형 기관의 거래 방식을 제공하고 이동을 예측하는 데 도움을 줍니다.  특히 유동성 분석에 뛰어나 기관이 어떻게 거래하는지 이해하는 데 도움을 줍니다. 시장 트렌드를 예측하고 가격 변동을 신중하게 분석하는 데 탁월합니다. 귀하의 거래를 기관 전략에 맞추어 시장의 동향에 대해 더 정확한 예측을 할 수 있습니다. 이 인디케이터는 시장 구조를 분석하고 중요한 주문 블록을 식별하
이 제품의 구매자들이 또한 구매함
TPSpro RFI Levels MT5
Roman Podpora
4.75 (12)
지침         러시아   -        영어       표시기와 함께 사용하는 것이 좋습니다   .       -       TPSpro   트렌드 프로 -   MT4 버전         거래에서 핵심 요소는 거래 상품을 매수 또는 매도하기로 결정하는 구역 또는 수준입니다. 주요 업체가 시장에서 자신의 존재를 숨기려는 시도에도 불구하고, 그들은 필연적으로 흔적을 남깁니다. 우리의 과제는 이러한 흔적을 식별하고 올바르게 해석하는 방법을 배우는 것이었습니다. 주요 기능:: 판매자와 구매자를 위한 활성 영역을 표시합니다! 이 지표는 매수 및 매도를 위한 모든 올바른 초기 임펄스 레벨/존을 보여줍니다. 진입점 검색이 시작되는 이러한 레벨/존이 활성화되면 레벨의 색상이 바뀌고 특정 음영으로 채워집니다. 또한 상황을 보다 직관적으로 이해하기 위해 화살표가 나타납니다. 더 높은 시간대의 레벨/존 표시(MTF 모드) 더 높은 시간 간격을 사용하여 레벨/존을 표시하는 기능을 추가했습니다.
TPSproTREND PrO MT5
Roman Podpora
4.89 (9)
TPSpro TREND PRO  - is a trend indicator that automatically analyzes the market and provides information about the trend and each of its changes, as well as giving signals for entering trades without redrawing! The indicator uses each candle, analyzing them separately. referring to different impulses - up or down impulse. Exact entry points into transactions for currencies, crypto, metals, stocks, indices!  Version MT4               DETAILED DESCRIPTION               R ecommended to use with an
우선 이 거래 시스템이 리페인팅, 리드로잉 및 레이그 인디케이터가 아니라는 점을 강조하는 것이 중요합니다. 이는 수동 및 로봇 거래 모두에 이상적인 것으로 만듭니다. 온라인 강좌, 설명서 및 프리셋 다운로드. "스마트 트렌드 트레이딩 시스템 MT5"은 새로운 및 경험이 풍부한 트레이더를 위해 맞춤형으로 제작된 종합적인 거래 솔루션입니다. 10개 이상의 프리미엄 인디케이터를 결합하고 7개 이상의 견고한 거래 전략을 특징으로 하여 다양한 시장 조건에 대한 다목적 선택이 가능합니다. 트렌드 추종 전략: 효과적인 트렌드 추이를 타기 위한 정확한 진입 및 손절 관리를 제공합니다. 반전 전략: 잠재적인 트렌드 반전을 식별하여 트레이더가 범위 시장을 활용할 수 있게 합니다. 스캘핑 전략: 빠르고 정확한 데이 트레이딩 및 단기 거래를 위해 설계되었습니다. 안정성: 모든 인디케이터가 리페인팅, 리드로잉 및 레이그가 아니므로 신뢰할 수 있는 신호를 보장합니다. 맞춤화: 개별 거래 선호도를 고려한 맞춤
Atomic Analyst MT5
Issam Kassas
4.32 (19)
우선적으로 언급할 점은이 거래 지표가 다시 그리지 않고 지연되지 않으며 이를 통해 수동 및 로봇 거래 모두에 이상적이라는 점입니다. 사용자 매뉴얼: 설정, 입력 및 전략. Atomic Analyst는 가격의 강도와 모멘텀을 활용하여 시장에서 더 나은 이점을 찾는 PA Price Action Indicator입니다. 고급 필터를 장착하여 잡음과 거짓 신호를 제거하고 거래 잠재력을 높이는 데 도움이 됩니다. 복잡한 지표의 다중 레이어를 사용하여 Atomic Analyst는 차트를 스캔하고 복잡한 수학적 계산을 간단한 신호와 색상으로 변환하여 초보 트레이더가 이해하고 일관된 거래 결정을 내릴 수 있도록합니다. "Atomic Analyst"는 새로운 및 경험이 풍부한 트레이더를위한 종합적인 거래 솔루션입니다. 프리미엄 지표와 최고 수준의 기능을 하나의 거래 전략에 결합하여 모든 종류의 트레이더에 대한 다재다능한 선택지가되었습니다. 인트라데이 거래 및 스캘핑 전략 : 빠르고 정확한
Quantum TrendPulse
Bogdan Ion Puscasu
SuperTrend   ,   RSI   ,   Stochastic   의 힘을 하나의 포괄적인 지표로 결합하여 트레이딩 잠재력을 극대화하는 궁극의 트레이딩 도구   인 Quantum TrendPulse를   소개합니다. 정밀성과 효율성을 추구하는 트레이더를 위해 설계된 이 지표는 시장 추세, 모멘텀 변화, 최적의 진입 및 종료 지점을 자신 있게 식별하는 데 도움이 됩니다. 주요 특징: SuperTrend 통합:   주요 시장 추세를 쉽게 따라가고 수익성의 물결을 타세요. RSI 정밀도:   매수 과다 및 매도 과다 수준을 감지하여 시장 반전 시점을 파악하는 데 적합하며 SuperTrend 필터로 사용 가능 확률적 정확도:   변동성이 큰 시장에서 숨겨진 기회를 찾기 위해 확률적 진동   을 활용하고 SuperTrend의 필터로 사용 다중 시간대 분석:   M5부터 H1 또는 H4까지 다양한 시간대에 걸쳐 시장을 최신 상태로 유지하세요. 맞춤형 알림:   맞춤형 거래 조건이 충족되면
FX Volume MT5
Daniel Stein
4.93 (14)
모닝 브리핑을 통해 세부 정보와 스크린샷으로 매일 시장 업데이트를 받으세요 여기 mql5 및 텔레그램에서 FX 거래량은 브로커의 관점에서 시장 심리에 대한 실제 통찰력을 제공하는 최초이자 유일한 거래량 지표입니다. 브로커와 같은 기관 시장 참여자가 외환 시장에서 어떤 포지션을 취하고 있는지에 대한 훌륭한 통찰력을 COT 보고서보다 훨씬 빠르게 제공합니다. 차트에서 이 정보를 직접 확인하는 것은 트레이딩의 진정한 판도를 바꾸고 획기적인 솔루션입니다. 다음과 같은 고유한 시장 데이터 인사이트의 이점 비율 는 통화의 매수/매도 포지션 비율을 백분율로 표시 비율 변화 는 선택한 기간 내 매수 비율과 비율 변화를 표시 총 거래량 는 해당 통화의 총 거래량(롱 및 숏)을 로트 단위로 보여줍니다 Volumes Long 는 해당 통화의 모든 롱 포지션의 거래량을 보여줍니다 Volumes Short 는 해당 통화의 모든 숏 포지션의 거래량을 보여줍니다 Net Long 는 순 롱 포지션의 거래량
FX Power MT5 NG
Daniel Stein
5 (6)
모닝 브리핑 여기 mql5 와 텔레그램에서 FX Power MT5 NG 는 오랫동안 인기 있는 통화 강도 측정기인 FX Power의 차세대 버전입니다. 이 차세대 강도 측정기는 무엇을 제공합니까? 기존 FX Power에서 좋아했던 모든 것 PLUS GOLD/XAU 강도 분석 더욱 정밀한 계산 결과 개별 구성 가능한 분석 기간 더 나은 성능을 위한 사용자 정의 가능한 계산 한도 특별 멀티더 많은 것을보고 싶은 사람들을위한 특별한 다중 인스턴스 설정 모든 차트에서 좋아하는 색상을위한 끝없는 그래픽 설정 수많은 알림 옵션, 중요한 것을 다시는 놓치지 않도록 Windows 11 및 macOS 스타일의 둥근 모서리가 있는 새로운 디자인 마법처럼 움직이는 인디케이터 패널 FX 파워 키 특징 모든 주요 통화의 완전한 강세 이력 모든 시간대에 걸친 통화 강세 이력 모든 브로커 및 차트에서 고유 계산 결과 100% 신뢰할 수있는 실시간100 % 신뢰할 수있는 실시간 계산-> 다시 칠하지 않음
이 대시보드는 선택한 심볼에 대해 사용 가능한 최신 고조파 패턴을 표시하므로 시간을 절약하고 더 효율적으로 사용할 수 있습니다 /   MT4 버전 . 무료 인디케이터:   Basic Harmonic Pattern 인디케이터 열 Symbol :   선택한 심볼이 나타납니다 Trend :   강세 또는 약세 Pattern :   패턴 유형(가틀리, 나비, 박쥐, 게, 상어, 사이퍼 또는 ABCD) Entry :   진입 가격 SL:   스톱로스 가격 TP1:   1차 테이크프로핏 가격 TP2:   2차 테이크프로핏 가격 TP3:   3차 테이크프로핏 가격 Current price:   현재 가격 Age (in bars):   마지막으로 그려진 패턴의 나이 주요 입력 Symbols :   "28개 주요 통화쌍" 또는 "선택한 심볼" 중에서 선택합니다. Selected Symbols :   쉼표로 구분하여 모니터링하려는 원하는 심볼("EURUSD,GBPUSD,XAUUSD")
소개       Quantum Breakout PRO   , 브레이크아웃 존 거래 방식을 변화시키는 획기적인 MQL5 지표! 13년 이상의 거래 경험을 가진 숙련된 트레이더 팀이 개발한       퀀텀 브레이크아웃 PRO       혁신적이고 역동적인 브레이크아웃 존 전략으로 거래 여정을 새로운 차원으로 끌어올리도록 설계되었습니다. Quantum Breakout Indicator는 5개의 이익 목표 영역이 있는 브레이크아웃 영역의 신호 화살표와 브레이크아웃 상자를 기반으로 한 손절 제안을 제공합니다. 초보자 거래자와 전문 거래자 모두에게 적합합니다. Quantum EA 채널:       여기를 클릭하세요 중요한! 구매 후 설치 매뉴얼을 받으려면 개인 메시지를 보내주십시오. 추천: 기간: M15 통화쌍: GBPJPY, EURJPY, USDJPY,NZDUSD, XAUUSD 계정 유형: 스프레드가 매우 낮은 ECN, Raw 또는 Razor 브로커 시간: GM
Entry Points Pro for MT5
Yury Orlov
4.46 (124)
다시 색을 칠하지 않고 거래에 진입할 수 있는 정확한 신호를 제공하는 MT5용 지표입니다. 외환, 암호화폐, 금속, 주식, 지수 등 모든 금융 자산에 적용할 수 있습니다. 매우 정확한 추정값을 제공하고 매수와 매도의 가장 좋은 시점을 알려줍니다. 하나의 시그널로 수익을 내는 지표의 예와 함께 비디오 (6:22)시청하십시오! 대부분의 거래자는 Entry Points Pro 지표의 도움으로 첫 거래 주 동안 트레이딩 결과를 개선합니다. 저희의   Telegram Group 을 구독하세요! Entry Points Pro 지표의 좋은점. 재도색이 없는 진입 신호 신호가 나타나고 확인되면(시그널 캔들이 완성된 경우) 신호는 더 이상 사라지지 않습니다. 여타 보조지표의 경우 신호를 표시한 다음 제거되기 때문에 큰 재정적 손실로 이어집니다. 오류 없는 거래 게시 알고리즘을 통해 트레이드(진입 또는 청산)를 할 이상적인 순간을 찾을 수 있으며, 이를 통해 이를 사용하는 모든 거래자의
Blahtech Supply Demand MT5
Blahtech Limited
4.54 (13)
Was: $299  Now: $99   Supply Demand uses previous price action to identify potential imbalances between buyers and sellers. The key is to identify the better odds zones, not just the untouched ones. Blahtech Supply Demand indicator delivers functionality previously unavailable on any trading platform. This 4-in-1 indicator not only highlights the higher probability zones using a multi-criteria strength engine, but also combines it with multi-timeframe trend analysis, previously confirmed swings
ON Trade Gann Squares MT5
Abdullah Alrai
5 (1)
간 스퀘어 지표는 W.D. 간이 쓴 "시장 예측을 위한 수학적 공식" 기사에 기반한 강력한 시장 분석 도구입니다. 이 도구는 수학적 개념과 간 이론을 사용하여 정확한 시장 분석을 수행합니다. 144, 90, 52의 제곱과 9의 제곱을 사용합니다. 또한 의 9의 제곱근 및 해당 제곱의 채널 및 스타 패턴과의 관련성을 통합합니다. 사용자 메뉴얼 및 적용: 이 지표를 사용하기 전에 사용자 메뉴얼을 읽고 질문이 있을 경우 문의하시기 바랍니다. 전체 메뉴얼은 웹사이트에서 제공됩니다. MT5의 전체 버전을 구매하거나 MT4의 무료 버전을 테스트할 수 있습니다. 두 버전 모두 링크에서 확인하실 수 있습니다. 주요 기능 및 기능: 간 스퀘어 지표는 정확한 결정을 위해 기하학적 개념과 간 이론을 활용하는 시장 분석을 위한 포괄적인 도구 집합을 제공합니다. 주요 기능은 다음과 같습니다. 9의 제곱 분석:   이 지표는 9의 제곱에 대한 수평 선, 스타 패턴, 그리드 및 간 팬을 그릴 수 있습니다. 간
TPA True Price Action indicator reveals the true price action of the market makers through 100% non-repainting signals strictly at the close of a candle! TPA shows entries and re-entries, every time the bulls are definitely stronger than the bears and vice versa. Not to confuse with red/green candles. The shift of power gets confirmed at the earliest stage and is ONE exit strategy of several. There are available now two free parts of the TPA User Guide for our customers. The first "The Basics"
Matrix Arrow Indicator MT5
Juvenille Emperor Limited
5 (13)
매트릭스 화살표 표시기 MT5 는 외환, 상품, 암호 화폐, 지수, 주식과 같은 모든 기호/도구에 사용할 수 있는 100% 다시 칠하지 않는 다중 기간 표시기를 따르는 고유한 10 in 1 추세입니다.  Matrix Arrow Indicator MT5 는 다음과 같은 최대 10개의 표준 지표에서 정보와 데이터를 수집하여 초기 단계에서 현재 추세를 결정합니다. 평균 방향 이동 지수(ADX) 상품 채널 지수(CCI) 클래식 하이켄 아시 캔들 이동 평균 이동 평균 수렴 발산(MACD) 상대 활력 지수(RVI) 상대 강도 지수(RSI) 포물선 SAR 스토캐스틱 오실레이터 윌리엄스의 백분율 범위 모든 지표가 유효한 매수 또는 매도 신호를 제공하면 강력한 상승/하락 추세를 나타내는 다음 캔들/막대가 시작될 때 해당 화살표가 차트에 인쇄됩니다. 사용자는 사용할 표시기를 선택하고 각 표시기의 매개변수를 개별적으로 조정할 수 있습니다. 매트릭스 화살표 표시기 MT5는 선택한 표시기에서만 정보를 수
Quantum Trend Sniper
Bogdan Ion Puscasu
4.8 (49)
소개       Quantum Trend Sniper Indicator는   추세 반전을 식별하고 거래하는 방식을 변화시키는 획기적인 MQL5 지표입니다! 13년 이상의 거래 경험을 가진 숙련된 트레이더 팀이 개발한       Quantum Trend Sniper 표시기       매우 높은 정확도로 추세 반전을 식별하는 혁신적인 방법으로 거래 여정을 새로운 차원으로 끌어올리도록 설계되었습니다. ***Quantum Trend Sniper Indicator를 구입하면 Quantum Breakout Indicator를 무료로 받을 수 있습니다!*** Quantum Trend Sniper Indicator는 추세 반전을 식별하고 세 가지 이익실현 수준을 제안할 때 경고, 신호 화살표를 제공합니다. 초보자 거래자와 전문 거래자 모두에게 적합합니다. Quantum EA 채널:       여기를 클릭하세요 MT4 버전:       여기를 클릭하세요
RelicusRoad Pro MT5
Relicus LLC
5 (17)
이제 $ 147 (몇 가지 업데이트 후 $ 499 증가) - 무제한 계정 (PCS 또는 MACS) RelicusRoad 사용 설명서 + 교육 비디오 + 비공개 Discord 그룹 액세스 + VIP 상태 시장을 보는 새로운 방법 RelicusRoad는 외환, 선물, 암호화폐, 주식 및 지수에 대한 세계에서 가장 강력한 거래 지표로서 거래자에게 수익성을 유지하는 데 필요한 모든 정보와 도구를 제공합니다. 우리는 초보자부터 고급까지 모든 거래자가 성공할 수 있도록 기술적 분석 및 거래 계획을 제공합니다. 미래 시장을 예측할 수 있는 충분한 정보를 제공하는 핵심 거래 지표입니다. 우리는 차트에서 말이 안 되는 여러 지표 대신 완전한 솔루션을 믿습니다. 타의 추종을 불허하는 매우 정확한 신호, 화살표 + 가격 조치 정보를 표시하는 올인원 표시기입니다. 강력한 AI를 기반으로 하는 RelicusRoad는 누락된 정보와 도구를 제공하여 교육하고 성공적인 트레이더인 트레이딩 전문
PTS Divergence Buy Finder MT5
PrecisionTradingSystems
PTS - Precision Trading Systems의 Divergence Buy Finder Precision Divergence Finder는 시장 바닥을 핀포인트 정확도로 찾아내도록 설계되었으며 이를 자주 수행합니다. 기술적 분석에서 바닥을 고르는 기술은 일반적으로 정상을 선택하는 것보다 훨씬 쉽습니다. 이 항목은 정확히 이 작업을 위해 설계되었습니다. 상승 Divergence가 식별되면 구매하기 전에 트렌드가 반등할 때 기다리는 것이 현명합니다. 10 또는 20 바 높음을 사용하거나 이전 바의 이동 평균 15-30이 상승하는 것을 식별하기 위해 사용할 수 있습니다. 복잡한 알고리즘은 실시간 바 단위로 활성 Demand Index(DI) Divergence 수를 찾아내고 계산합니다. 모델은 시장 가격이 새로운 최저점을 기록하고 Demand Index가 새로운 최저점을 기록하지 않을 때 Divergence를 발생시키는 것을 관찰합니다. 이 지표는 두 가지
GannRS Trend Scalper   GannRS is an advanced trading tool based on Gann Law and Supports and Resistances. designed to have an   active trading at any time not lagging Indications are given at the beginning of a new candle Please watch the full tutorial video. How to use GannRS Very easy to set up... Put it on your chart Adjust inputs Inputs Show Resistance and support : [bool]  true = Shows R/S on chart false = does not show Show Levels :[bool]  true = Shows levels on the chart false = doe
Advanced Supply Demand MT5
Bernhard Schweigert
4.5 (14)
현재 33% 할인! 초보자나 전문 트레이더를 위한 최고의 솔루션! 이 보조지표는 우리가 다수의 독창적 기능과 새로운 공식을 통합한 독특하고 고품질이며 저렴한 거래 도구입니다. 이 업데이트를 통해 이중 시간대를 표시할 수 있습니다. 더 높은 TF를 표시할 수 있을 뿐만 아니라 차트 TF와 더 높은 TF 모두를 표시할 수 있습니다: 중첩 영역 표시. 모든 Supply Demand 트레이더들이 좋아할 것입니다. :) 중요한 정보 공개 Advanced Supply Demand의 잠재력을 극대화하려면 다음을 방문하십시오. https://www.mql5.com/ko/blogs/post/720245   진입 또는 목표의 명확한 트리거 포인트를 정확히 찾아냄으로 해서 거래가 어떻게 개선될지 상상해 보십시오. 새로운 알고리즘을 기반으로 매수자와 매도자 간의 잠재적인 불균형을 훨씬 더 쉽게 분간할 수 있습니다. 왜냐하면 가장 강한 공급영역과 가장 강한 수요 영역과 과거에 어떻게 진행 되었는지를(이
Contact me for instruction, any questions! Related Product:  Gold Trade Expert MT5 Introduction The breakout and retest strategy is traded support and resistance levels. it involves price breaking through a previous level.  The break and retest strategy is designed to help traders do two main things, the first is to avoid false breakouts. Many false breakouts start with a candlestick that breaks out of a level but ends with an immediate candlestick that brings the price back into the level. T
Beast Super Signal MT5
Dustin Vlok
2.71 (7)
수익성 있는 거래 기회를 쉽게 식별하는 데 도움이 되는 강력한 외환 거래 지표를 찾고 계십니까? Beast Super Signal보다 더 이상 보지 마십시오. 사용하기 쉬운 이 추세 기반 지표는 시장 상황을 지속적으로 모니터링하여 새로운 개발 추세를 찾거나 기존 추세에 뛰어들 수 있습니다. Beast Super Signal은 모든 내부 전략이 정렬되고 서로 100% 합류할 때 매수 또는 매도 신호를 제공하므로 추가 확인이 필요하지 않습니다. 신호 화살표 알림을 받으면 구매 또는 판매하기만 하면 됩니다. 구매 후 비공개 VIP 그룹에 추가되도록 저에게 메시지를 보내주세요! (전체 제품 구매만 해당). 최신 최적화된 세트 파일을 구입한 후 저에게 메시지를 보내주세요. MT4 버전은   여기에서 사용할 수 있습니다. 여기에서   Beast Super Signal EA를 받으세요. 최신 결과를 보려면 댓글 섹션을 확인하세요! Beast Super Signal은
Blahtech Market Profile MT5
Blahtech Limited
5 (9)
Was: $249  Now: $99   Market Profile defines a number of day types that can help the trader to determine market behaviour. A key feature is the Value Area, representing the range of price action where 70% of trading took place. Understanding the Value Area can give traders valuable insight into market direction and establish the higher odds trade. It is an excellent addition to any system you may be using. Inspired by Jim Dalton’s book “Mind Over Markets”, this indicator is designed to suit the
FxaccurateLS
Shiv Raj Kumawat
WHY IS OUR FXACCCURATE LS MT5 THE PROFITABLE ? PROTECT YOUR CAPITAL WITH RISK MANAGEMENT Gives entry, stop and target levels from time to time. It finds Trading opportunities by analyzing what the price is doing during established trends. POWERFUL INDICATOR FOR A RELIABLE STRATEGIES We have made these indicators with a lot of years of hard work. It is made at a very advanced level. Established trends provide dozens of trading opportunities, but most trend indicators completely ignore them!
[ MT4 Version ] Only the next 10 units at current price! Final price: $299 Are you tired of spending months on demo or live accounts to test your trading strategies? The Backtesting Simulator is the ultimate tool designed to elevate your backtesting experience to new heights. Utilizing Metatrader historical symbol information, it offers an unparalleled simulation of real market conditions. Take control of your testing speed, test ideas quickly or at a slower pace, and witness remarkable improve
Introducing the POWER TRADE indicator created by a small group of traders with a few years trading trading the financial market profitably . This is a plug and play indicator that provides you with  POWERFUL Entry signals with Profit Taking and rebound zones. The indicator Works with all MT5 trading instruments. The indicator uses previous  chart data as receipt to speculate on future market moves.
Trend Forecaster
Alexey Minkov
5 (6)
The Trend Forecaster indicator utilizes a unique proprietary algorithm to determine entry points for a breakout trading strategy. The indicator identifies price clusters, analyzes price movement near levels, and provides a signal when the price breaks through a level. The Trend Forecaster indicator is suitable for all financial assets, including currencies (Forex), metals, stocks, indices, and cryptocurrencies. You can also adjust the indicator to work on any time frames, although it is recommen
First of all Its worth emphasizing here that this Trading indicator is   Non-Repainting   , Non Redrawing and Non Lagging Indicator   Which makes it ideal from both manual and robot trading .  Viking Strategy Signal Indicator  - is a trend indicator that automatically analyzes the market and provides information about the trend and each of its changes, as well as giving signals for entering trades without redrawing! . Exact entry points into transactions for currencies, crypto, metals, stock
PZ Swing Trading MT5
PZ TRADING SLU
5 (4)
Protect against whipsaws: revolutionize your swing trading approach Special Offer: Purchase now to receive free bonuses worth $135! (Read more for details) Swing Trading is the first indicator designed to detect swings in the direction of the trend and possible reversal swings. It uses the baseline swing trading approach, widely described in trading literature. The indicator studies several price and time vectors to track the aggregate trend direction and detects situations in which the market i
Trend Hunter MT5
Andrey Tatarinov
5 (2)
Trend Hunter 는 Forex, 암호화폐 및 CFD 시장에서 작업하기 위한 추세 지표입니다. 이 지표의 특별한 특징은 가격이 추세선을 약간 돌파할 때 신호를 변경하지 않고 자신있게 추세를 따른다는 것입니다. 표시기는 다시 그려지지 않으며 막대가 닫힌 후에 시장 진입 신호가 나타납니다. 추세를 따라 이동할 때 표시기는 추세 방향에 대한 추가 진입점을 표시합니다. 이러한 신호를 바탕으로 작은 StopLoss로 거래할 수 있습니다. Trend Hunter 는 정직한 지표입니다. 표시 신호 위로 마우스를 가져가면 신호의 잠재적 이익과 가능한 중지가 표시됩니다. 새로운 신호가 나타나면 다음 알림을 받을 수 있습니다. 알리다 푸시 알림 이메일로 알림 텔레그램 알림 차트 스크린샷도 텔레그램으로 전송되므로 거래 결정을 내리기 위해 단말기를 열 필요가 없습니다. 표시 신호는 텔레그램 채널 https://www.mql5.com/ko/market/product/11085#!tab
Gartley Hunter Multi
Siarhei Vashchylka
5 (8)
Gartley Hunter Multi - An indicator for searching for harmonic patterns simultaneously on dozens of trading instruments and on all possible timeframes. Manual (Be sure to read before purchasing) | Version for MT4 Advantages 1. Patterns: Gartley, Butterfly, Shark, Crab. Bat, Alternate Bat, Deep Crab, Cypher 2. Simultaneous search for patterns on dozens of trading instruments and on all possible timeframes 3. Search for patterns of all possible sizes. From the smallest to the largest 4. A
제작자의 제품 더 보기
WuKong EA
Xiaoyu Huang
이것은 매우 적은 위험으로 장기적으로 안정적이고 수익성 있는 거래 EA입니다. 적응형 EA에 전통적인 기술 지표를 사용합니다. 이 EA는 매개변수 최적화보다는 주로 알고리즘 최적화입니다. 우리가 추구하는 것은 장기적으로 안정적인 수익입니다. 안정적인 돈 버는 것이 가장 중요한 것입니다. 새로운 EA 프로모션 가격: $199   → $299 특징 한 번에 한 주문, 마팅게일 없음, 그리드 장기 검증 후 수익성 고정 손절매 적응형 슬리피지 감소를 위해 제한 주문 사용 통합 ONNX, AI Boost 소액 자금 지원 OneChartSetup 통합 MT5 뉴스 필터링, 뉴스 테스트 가능 ICMarets, FTMO, Darwinex Zero에 적용 가능 다른 EA와 함께 사용 가능 객체 지향 프로그래밍, 프로그램 프레임워크는 5년간 테스트됨 Signal https://www.mql5.com/ko/signals/2024466 사용 기간: M1 다양성: GBPCAD, EURCAD
소개 이것은 "Zhan Zhong Shuo Chan" 이론의 첫 번째 유형의 구매 및 판매 지점에 해당하는 추세 차이를 감지하도록 설계된 풀백 EA입니다. 매우 높은 이익률을 갖춘 이 EA는 일관된 장기 수익성을 제공합니다. 역동적인 그리드 거래를 사용하여 다양한 시장 상황에 원활하게 적응할 수 있습니다. 새로운 EA 프로모션 가격: $99 → $149 라이브 신호 https://www.mql5.com/ko/signals/2196313 파일 설정 https://c.mql5.com/6/954/Profit.set https://c.mql5.com/6/954/Low_Risk.set 특징 자동화된 조정을 위해 가상 주문을 활용합니다. 변화하는 시장 상황에 적응 스프레드 및 플랫폼 사양에 대한 낮은 민감도 마틴게일을 사용하지 않고 동적 그리드 사용(프로그래밍 가능) 다른 EA와 호환 가능 5년간 최적화된 프레임워크를 갖춘 객체지향 프로그래밍 용법 기간: M15 기본 쌍: GBPU
King of Dragon 채널, King of Dragon 표시기, King of Dragon 시스템, King of Dragon MT5, King of Dragon 클래식 표시기, King of Dragon 스와이프 시스템, 킹 오브 드래곤 올인원 클래식 채널 거래 시스템인 King of Dragon 채널 거래 시스템은 많은 사용자가 MT5 버전을 강력하게 요청합니다. 이 프로그램은 여러 버전에서 성능을 위해 최적화되었으며 이미 비교적 원활한 시스템입니다. 49$ → 59$ 빨간색 영역, 긴 추세, 짧지 않고 길기만 함 녹색 영역, 짧은 추세, 짧고 길지 않음 회색 영역, 통합 추세, 충격 지표의 길고 짧은 작동 참조 https://www.mql5.com/ko/market/product/96760 매개변수 "===== 메인 =====" int CalcalueBars = 1000;//계산된 막대 수 color BeltColor = clrGray;//트렌드 벨트의 색상 bo
Smart Peak Bottom
Xiaoyu Huang
5 (2)
이것은 고점과 저점을 판단하기 위한 명확한 지표이며 진동 시장에 적합합니다. 프로모션 가격 49$ → 59$ 특징 상의와 하의를 잘 판단한다 다시 그리기 없음, 드리프트 없음 빠른 계산, 지연 없음 풍부한 알림 모드 여러 매개 변수 및 색상을 조정할 수 있습니다. 매개변수 "======== 메인 ========" HighLowPeriod1 = 9 HighLowPeriod2 = 60 HighLowPeriod3 = 34 HighLowEMAPeriod = 4 MASignalPeriod = 5 "======== 알림 ========" UseAlertNotify = 참; UseMetaQuotesIDNotify = 참; UseMailNotify = 참; NotifySignalMode = 색상 변경 및 레벨 확인; 하이레벨 = 80; 저수준 = 20; NofityPreMessage = "스마트 피크 바닥"; EA 통화의 경우 0. 높은 버퍼 1.낮은 버퍼 2. 방향 버퍼 1 up
통화 강도 지표 통화 강도 지표는 추세를 식별하는 강력한 도구입니다. 다양한 통화의 강점과 약점을 비교하고 추세적인 통화 쌍을 쉽게 찾을 수 있습니다. 판매 가격: $49 특징 강한 통화와 약한 통화를 효과적으로 구별합니다. 추세 통화를 자동으로 식별합니다. 다중 시간대 28개의 통화쌍을 로드합니다. 성능 최적화 지표 사용법 강한 통화: 80을 넘는 통화는 강한 것으로 간주됩니다. 약한 통화: 20 미만의 통화는 약한 것으로 간주됩니다. 예 EUR가 80을 초과하고 상승 추세에 있고 USD가 20 미만에서 하락 추세라면 EURUSD는 상승 추세에 있습니다. JPY가 80을 초과하고 상승 추세에 있고 GBP가 20 미만에서 하락 추세라면 GBPJPY는 하락 추세에 있습니다. 지표에 표시된 통화가 높을수록 강세를 나타냅니다. 표시되는 통화가 낮을수록 약세입니다. 지표의 반대편에 있는 통화로 구성된 통화쌍은 일반적으로 강한 추세이며 한동안 지속됩니다.
ChzhshchMACD
Xiaoyu Huang
Zen MACD 지표에 대해 이야기하기 4색 2선 MACD 열 면적의 합을 표시하십시오. InpFastMA=12; // 빠른 EMA 기간 InpSlowMA=26; // 느린 EMA 기간 InpSignalMA=9; // 신호 SMA 주기 InpAppliedPrice=PRICE_CLOSE;// 적용 가격 InpMaMethod=MODE_EMA; //Ma_Method 입력 bool ChArea = false; //chzhshch 영역 빠른 EMA 기간 빠른 라인 매개변수 느린 EMA 기간 느린 라인 매개변수 신호 SMA 주기 신호 라인 매개변수 신청 가격 선택 사항 비틀림 이론에 정의된 추세 강도를 대조하고 두 추세를 비교하고 열 면적의 합을 비교합니다. 이 표시기는 해당 면적을 계산하고 비교를 용이하게 합니다.
소개하다 21:00-22:00 사이에 거래되는 야간 거래용 EA입니다. 장기 회사 제안은 수익성이 있습니다. 한 번에 하나의 주문만 거래하고 큰 손실을 일으키지 않습니다. 각 주문에 대해 손절매를 설정하고 이익을 얻으며 그리드, 마틴 또는 기타 고위험 자금 관리를 사용하지 마십시오. 동시에 여러 통화에 사용할 수 있습니다. 기본적으로 시간대를 자동으로 설정 특성 거래 차트: M15 거래 가능한 통화: EURUSD,GBPSUD,USDCAD,USDCHF,AUDCHF,EURGBP,EURCHF,USDJPY,EURCAD,EURAUD,GBPAUD,AUDJPY,EURJPY,GBPJPY,AUDUSD 최소 보증금: 100USD 추천 브로커: IC Markets, Peperstone, Darwinex, Exness 및 기타 저확산 플랫폼 신호 MQL5 라이브: https://www.mql5.com/en/signals/1021524 매개변수 매직넘버 UseMM이 자금 관리를 사용하
EEVCC Hedge 프로모션 가격: $59 활성화: 10 소개 양방향(매수와 동시에 매도) 그리드 헤지 거래 EA입니다. 장기 회사 제안은 수익성이 있습니다. 동시에 여러 통화로 사용 가능 안전한 수익 계산 방법 특성 거래 차트: H1 권장 통화: EURGBP, EURUSD 최소 보증금: 3000USD, 센트 계정의 경우 10000USD 권장, 100USD 추천 브로커: RofoForex, Exness 및 레버리지 및 센트 계정이 높은 기타 플랫폼 링크:   https://www.mql5.com/ko/users/maxlake/seller 매개변수 UseAutoMagic = true, 자동 매직 넘버 사용 여부 MagicNumber = 2, UseAutoMagic = false 매직 넘버 설정 랏 = 0.01, 초기 거래량 LotFactor = 1.8, 그리드 곱셈의 배수 NetGap = 300, 그리드 거리 이익실현 = 450, 이익실현 StableDeep = 3; 안전 그리드 레
1 day Promotional price: $49 Activation: 30 10 days promotional price: $59 activation: 20 Introduction Quick View Quickly check the profitability for a period of time and display the statistics Quickly filter historical transactions and make statistics based on time, magic number, currency, and comments Statistics include Net Profit, LotTotal, Profit Factor, Short Trades (win %), Long Trades (win %), Average Profit Trade, etc. Refresh statistical data in real time Calculation time is
Introduction This is an indicator of daily profitability Characteristic Statistics can be based on currency, magic number, and notes Statistics can be based on time Available for all currencies, all periods There are white and black themes Reverse sort The refresh rate can be adjusted You can set the refresh time to the latest Parameter nD                     =  30;                                     // Number of days StartTime          =  D'2021.06.01 00:00:00';       //  StartTime EndTi
반자동 마틴 시스템 소개하다 이 도구는 반자동 Martin 거래에 사용되며 패널을 클릭하여 주문하면 EA가 위치를 관리합니다. 거래의 방향만 정하고 나머지는 EA 경영진에 맡김 자동 마틴, 설정된 그리드에 따라 창고 추가, 이 기능을 비활성화할 수도 있습니다. 원클릭 청산 하나의 키 잠금 기능 시간 제어 경고음 안내 특성 거래 차트: 아무거나 거래 가능한 통화: 아무거나 자동 이익실현 마감 백테스트에 사용할 수 있습니다. 클리어 패널 디스플레이 매개변수 주요 설정 매개변수 로그 레벨 = LOG_LEVEL_INFO; //로그 작성 레벨 UseAutoMagic = true; //매직넘버 사용 여부 매직넘버 = 6; //매직 넘버 0-2000 설정 로트 = 0.01; //초기 거래량 UseMartin = 참; //마틴 함수 사용 여부 부스터 = 1.7; //증가의 배수 넷갭 = 10; //그리드의 거리(포인트) 테이크프로핏 = 13; //이익을 얻다(포인트) M
EEVCC Info
Xiaoyu Huang
소개하다 이것은 거래 보조, 정보 패널 표시기, 집계 통화 통계, 계정 통계, 위치 정보, 서버 및 현지 시간, 통화 강도, K 라인 남은 시간, 지지선 및 저항선, 서버 시간 오프셋, 통화 변동 비율 및 기타 기능입니다. 모든 유형의 계정 및 통화에 사용할 수 있습니다. 우수한 성능, 매우 적은 리소스 위치, 색상, 글꼴 크기를 사용자 정의할 수 있습니다. 모든 모듈을 개별적으로 표시하거나 비활성화할 수 있습니다. 특성 1. 통화 통계 일일 시가, 고가, 저가, 종가 데일리 라인의 당일 하이-로우 어제의 일간 고가-저가 5일 평균 변동 10일 평균 변동 20일 평균 변동 50일 평균 변동 하루의 상승과 하락 오늘의 상승점과 하락점 현재 스프레드 통화 및 현재 가격 UseSidebar = true; SideFontSize = 10; XLocation = 90, 수평 방향의 위치 YLocation = 20, 수직 위치 SideXGap = 90, 가로 방향의 간격 S
Zen Fractal
Xiaoyu Huang
CZSC 프랙탈 유형 색인 특징: 포함 관계에 대한 철저한 처리 수행 EA 호출을 사용하여 상하 분류인지, "Teaching You to Stock 93: The Relationship between the Two Tables and the Inside of the Trend Structure 2"의 상태를 판단하는 것이 편리합니다. 화살표로 상하 분류 표시 다양한 색상으로 가능한 펜 표시 두 개의 인접한 K-라인의 포함 관계는 정의를 제공합니다. K-라인의 높은 지점과 낮은 지점은 모두 인접한 K-라인의 범위 내에 있으며, 이 K-라인과 인접한 K-라인은 포함 관계입니다. K-라인 차트에서 관계가 있는 K-라인을 자주 볼 수 있는데 소위 포함 처리는 포함 관계가 있는 두 개의 K-라인을 하나의 K-라인으로 결합하는 것입니다. 정의: 3개의 연속된 K-라인을 포함하여 가공한 것으로 중간 K-라인의 높은 지점이 가장 높은 경우 이 조합을 탑 타입이라고 합
이 라이브러리는 키 및 값 배열을 정렬하는 데 사용되며 종종 값을 정렬해야 합니다. 파이썬 언어처럼 sorted(key_value.items(), key = lambda kv:(kv[ 1 ], kv[ 0 ])) 가져오기 기능 사용 시나리오의 예 1. 그리드 EA 주문은 시가에 따라 정렬됩니다. void SortedByOpenPride()   {    long     OrderTicketBuffer[];    double   OpenPriceBuffer[];    for ( int i = PositionsTotal ()- 1 ; i>= 0 ; i--)      {        if (m_position.SelectByIndex(i))         {          OrderTicketBuffer[i] = long (m_position.Ticket());          OpenPriceBuffer[i] = m_position.PriceOpen();         }
Gold Digger AI
Xiaoyu Huang
5 (4)
이것은 전통적인 기술 지표를 사용하고 적응형 EA에 AI를 사용하는 장기적으로 안정적이고 수익성 있는 금 거래 EA입니다. 새로운 EA 프로모션 가격:  $199   →   $ 249 특성 한 번에 하나의 주문 고정 손절매 적응 야간 거래 미끄러짐 최적화 뉴스 필터 FTMO, DARWINEX Zero 통과에 적합 다른 EA와 함께 사용 가능 객체 지향 프로그래밍, 프로그램 프레임워크는 5년 동안 테스트되었습니다. 신호 https://www.mql5.com/ko/signals/2211776 https://www.mql5.com/ko/users/maxlake/seller 사용 기간: M15 품종: XAUUSD, XAUEUR ,XAUCHF , XAUJPY, 금 최소 보증금: $50 계정: 스프레드가 낮고 정지가 없는 ECN 계정 헤징. 추천 브로커: 낮은 스프레드의 IC Markets, Pepperstone , Tickmill, Darwinex 플랫폼 VPS를 권장합니다 모수 Use
Chart Compare 소개 - 궁극의 다중 차트 동기화 도구 지금 $39에 판매 중(정상가 $59) 즉각적인 통찰력을 위해 여러 차트를 원활하게 동기화합니다. 주요 기능: 초고속 동기화: 이벤트 기반 기술은 모든 차트에서 원활하고 즉각적인 업데이트를 보장합니다. 가볍고 효율적: 최적의 성능을 위한 최소한의 시스템 리소스 사용. 빠른 비교: 유사한 도구를 나란히 쉽게 비교합니다. 수년간의 개선: 입증된 안정성과 지속적인 최적화. 사용자 정의 가능한 매개변수: SyncPos: 모든 차트에서 시작 시간을 동기화합니다. 작동 방식: 각 차트에 Chart Compare를 로드합니다. 첫 번째 차트는 "Main"으로 레이블이 지정됩니다. "Main" 차트와 상호 작용하기만 하면 다른 모든 차트가 자동으로 동기화되어 일치합니다. 모범 사례: 창을 타일링하여 명확하고 체계적인 보기를 제공합니다. 모든 차트에 일관된 템플릿을 사용합니다. Chart Compare는 다음을
필터:
리뷰 없음
리뷰 답변