PipTick Currency Index MT5
- 지표
- Michal Jurnik
- 버전: 1.1
- 업데이트됨: 3 12월 2021
- 활성화: 5
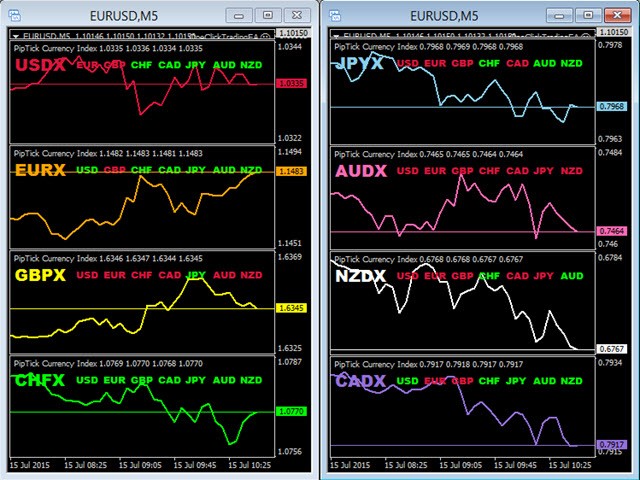
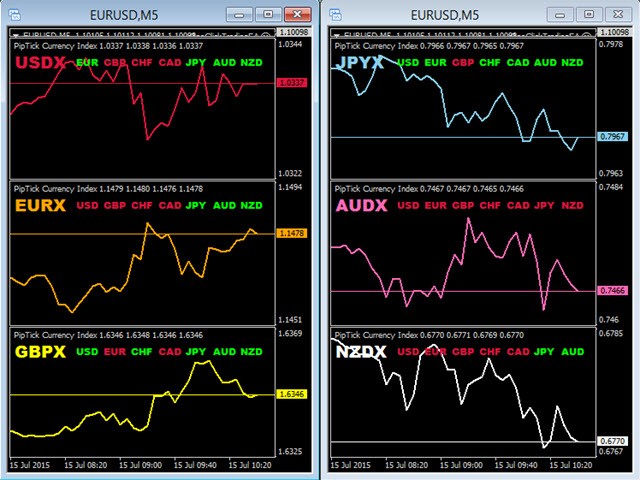
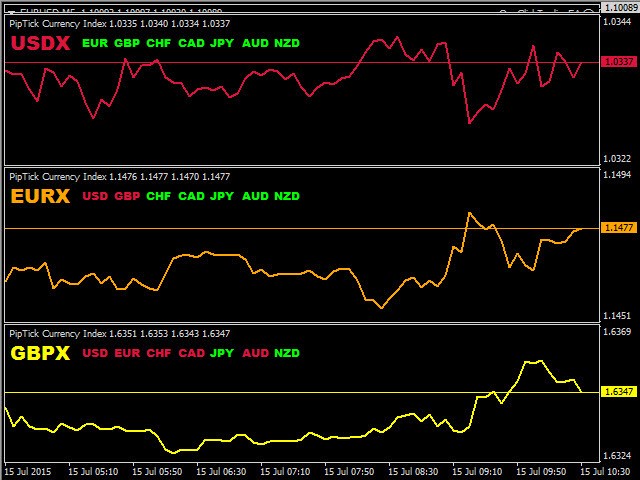
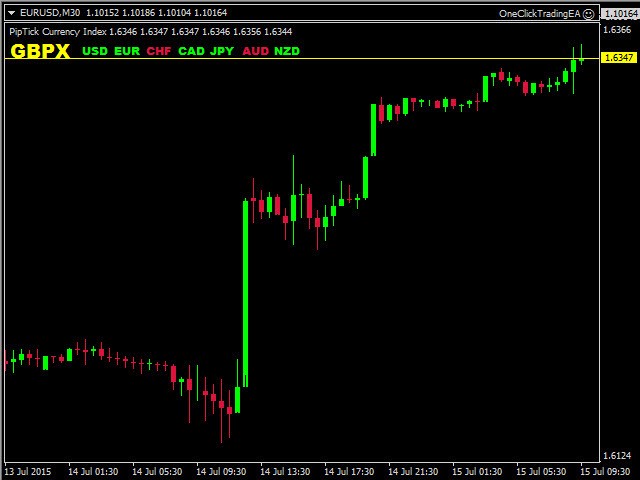
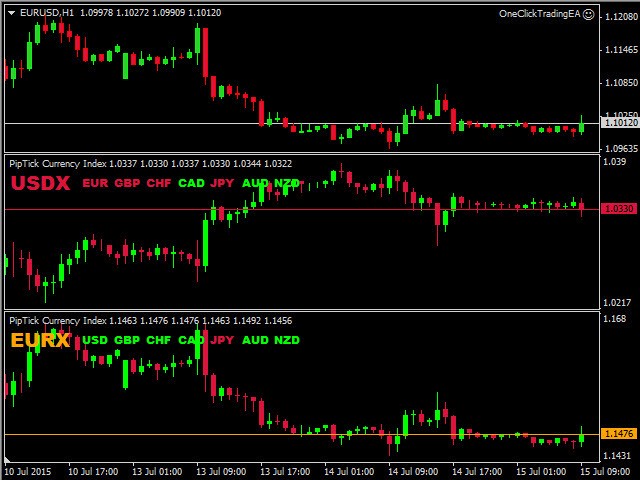
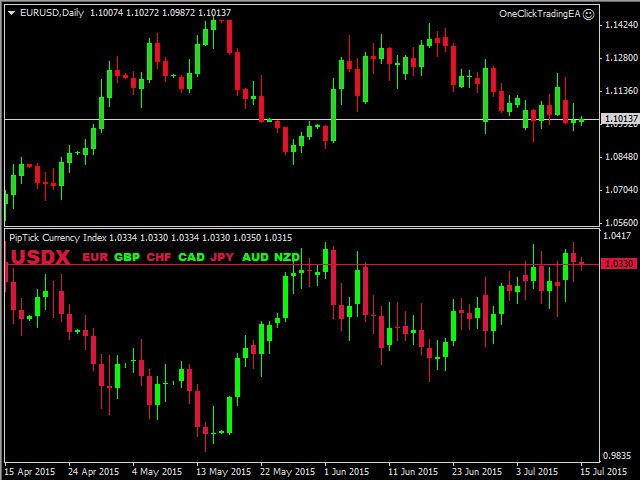
The Currency Index indicator enables traders to display any index of eight major currencies. It uses a special calculation that considers specific currency pairs and their weights.
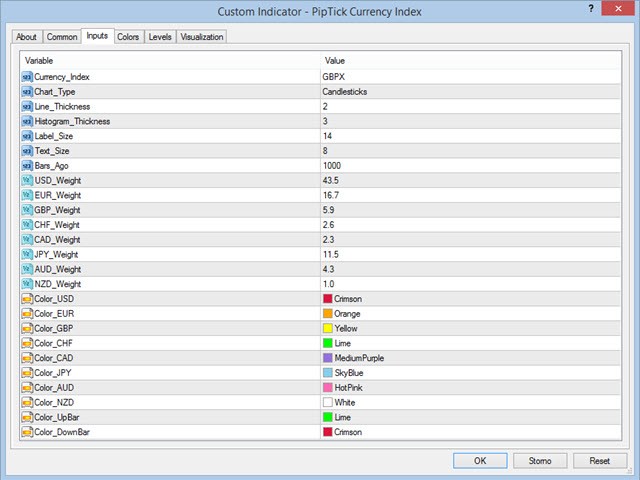
The default weights are based on the BIS Triennial Central Bank Survey results. Because of this advantage, the trader can see each currency's true strength and weakness.
Note: If the indicator is used in Strategy Tester (demo version), please keep in mind that all currency pairs' data must be downloaded in History Center before the simulation starts (How-to). If the indicator is added to the chart in the usual way, no downloads are needed.
Currency Indexes
- USDX - US Dollar Currency Index.
- EURX - Euro Currency Index.
- GBPX - British Pound Currency Index.
- CHFX - Swiss Franc Currency Index.
- CADX - Canadian Dollar Currency Index.
- JPYX - Japanese Yen Currency Index.
- AUDX - Australian Dollar Currency Index.
- NZDX - New Zealand Dollar Currency Index.
Main Features
- The indicator shows the index of eight major currencies (USD, EUR, GBP, CHF, JPY, CAD, AUD, NZD).
- A simple comparison of the strength and weakness of one currency.
- Works on every timeframe (M1, M5, M15, M30, H1, H4, D1, W1, MN).
- The indicator is non-repainting.
- Ready for backtesting.
- Customizable parameters (Colors, Line thickness, Weights).
- High-speed calculation.
- The indicator works with prefixes and suffixes of symbols as well (EURUSD.m, EURUSD-pro...).
- Available for MT4 and MT5.


Worthless. Doesn't work and no response from seller. Save your money