• 미리보기
  • 리뷰 (1)
  • 코멘트
  • 새 소식

Market Structures Pro MT4

5
The Market Structures Pro indicator finds and displays 5 (five) patterns of the Smart Money Concepts (SMC) system on the chart, namely:
  • Break Of Structures (BoS)     
  • Change of character (CHoCH)
  • Equal Highs & Lows
  • Premium, Equilibrium and Discount zones with Fibo grid
  • High-high, Low-low, High-low and Low-high extremes

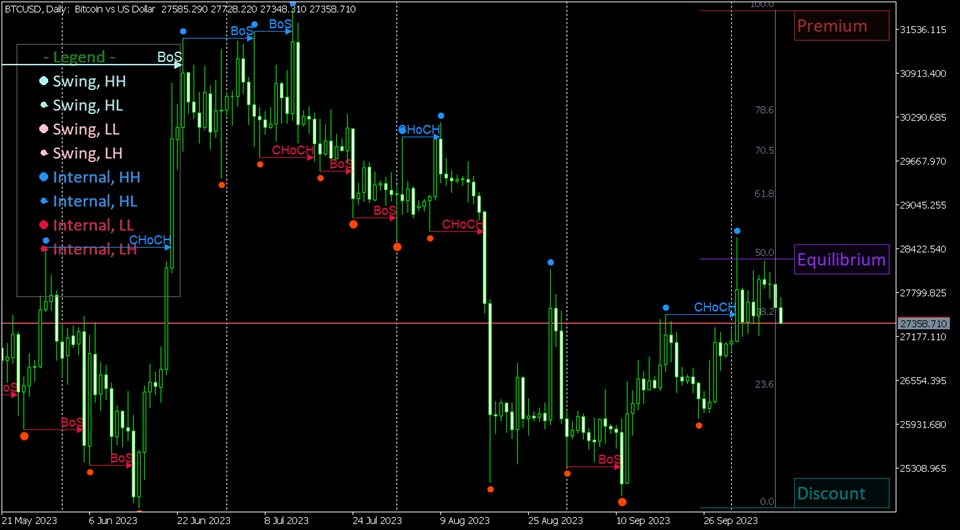
Patterns are displayed for two modes - Swing and Internal and are easily distinguished by color on the chart. Internal mode features higher contrast colors, finer lines, and smaller character sizes. For Swing mode, colors are less vibrant, lines are thicker, and symbols are larger. In the indicator you can enable/disable the display of each mode.

In addition, the indicator separately turns on/off the display of High-high, Low-low, High-low and Low-high extremes, Premium, Equilibrium and Discount zones and “Legends” - tables with hints to the user.

For Premium, Equilibrium and Discount zones, it is possible to display Fibo with customizable levels.

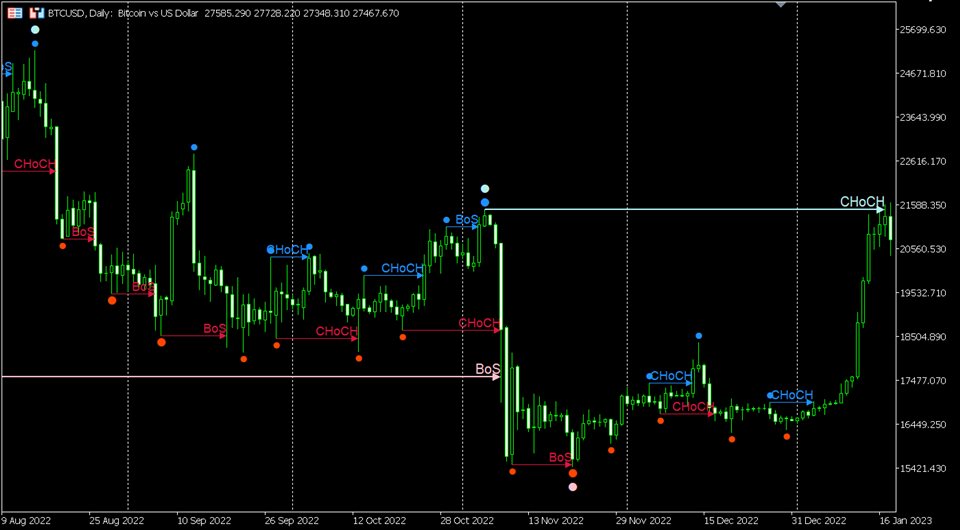
Two screenshots demonstrate two options (out of several) for displaying the indicator:

  1. Full output of all available options
  2. "Zones" and "Legends" are not output
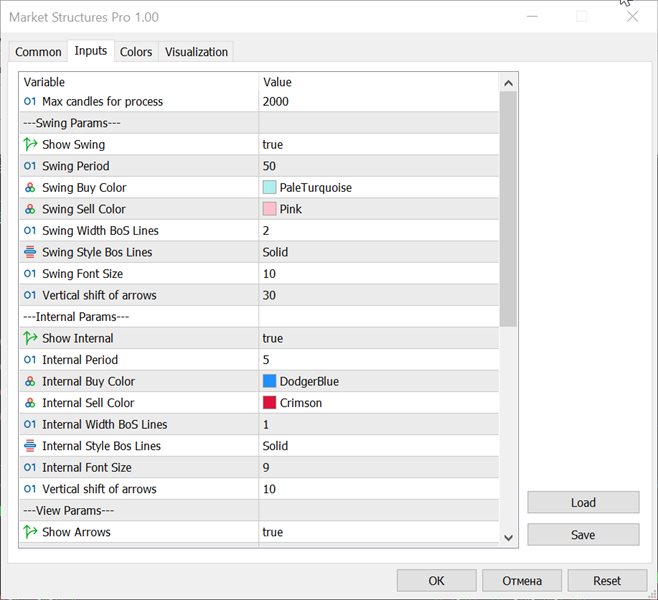
The input parameters are simple. The main ones are two Period parameters for the Swing and Internal modes. Leave them as default, or change them to suit your work strategy. Configure other parameters as you wish and the indicator will help you in trading.

There is a completely free “demo” version for this indicator here. Work with it, read the reviews and make the right decision about the need to purchase this indicator.

I wish everyone successful trading and big profits)
리뷰 1
wuzzy66
921
wuzzy66 2023.12.09 23:08 
 

This is a must have indicator if you want to boost your trading profit this indicator was exactly want I having been looking for it finds the swing points so you can catch as much as 100 pips on reversal and also developer has been very helpful and it’s worth renting for $60 for a year you can easily make your money back in a day if you go for H4 time frame very reversal pulls back as much as over 100 pips

추천 제품
EA Atom
Renat Garaev
5 (2)
EA Atom은 고유한 거래 알고리즘을 갖춘 Expert Advisor입니다. EA는 전날의 높거나 낮은 수준의 분석에서 작동합니다. 성공적이고 입증된 전략이 고문의 알고리즘에 통합되어 있어 기술 및 컴퓨터 분석의 모든 미묘함과 함께 자산 가격 책정에서 이익을 얻을 수 있습니다. 구매 후 즉시 저에게 연락하여 지침을 받고 개인 전보 채팅에 액세스하십시오! 설정은 링크의 고문의 토론에서 사용할 수 있습니다. EURUSD, GBPUSD, AUDUSD, USDCAD, NZDUSD, DE40, USTECHCash (100) 거래를 위한 권장 쌍 타임프레임 모두 최소 계정 잔고 1000 $(1쌍) EA는 좋은 중개 조건이 필요합니다. 롤오버 기간 동안 낮은 스프레드와 슬리피지가 가장 좋은 계정 유형은 ECN입니다. 상담은 비밀댓글로 해주시면 됩니다. EA는 VPS에서 계속 실행되어야 하며 VPS 대기 시간은 150ms를 초과하지 않아야 합니다. 불필요한 오류를 피하기 위해 다
FIBOChannels
Hafis Mohamed Yacine
Fibonacci Channel What is a Fibonacci Channel? The Fibonacci channel is a technical analysis tool that is used to estimate support and resistance levels based on the Fibonacci numbers. It is a variation of the Fibonacci retracement tool, except with the channel the lines run diagonally rather than horizontally. It can be applied to both short-term and long-term trends, as well as to uptrend and downtrends. Lines are drawn at 23.6, 38.2, 50, 61.8, 78.6, 100, 161.8, 200, 261.8, 361.8 and 423.6
MFI Speed mq
DMITRII GRIDASOV
MT4용 외환 지표 "MFI 속도" 이 지표의 계산은 물리학의 방정식을 기반으로 합니다. MFI 속도는 MFI 자체의 첫 번째 파생물입니다. MFI(자금 흐름 지수)는 과매도 및 과매수 영역을 식별하기 위해 가격 및 거래량 데이터를 사용하는 기술 오실레이터입니다. MFI 속도는 모멘텀 진입을 주요 추세 방향으로 끌어들이는 데 좋습니다. 표준 EMA(그림 참조)와 같은 적합한 추세 표시기와 함께 사용하십시오. MFI 속도 표시기는 MFI 자체가 방향을 얼마나 빨리 바꾸는지 보여줍니다. 이는 매우 민감합니다. MFI 속도 표시기의 값이 < 0인 경우: 속도는 음수입니다. MFI 속도 표시기의 값이 > 0인 경우: 속도는 양수입니다. 표시기에는 모바일 및 PC 알림이 내장되어 있습니다. // 더 훌륭한 전문가 자문 및 지표는 여기에서 확인할 수 있습니다: https://www.mql5.com/en/users/def1380/seller 본 MQL5 홈페이지에서만 제공되는 오리지널
Only EA developed over 1 year ago, which remains consistent in the market and in the #10 Top of the MQL Store   >>> You can use this EA with a balance starting at $30 in a cent account. Doubts about which broker and how much balance you need to trade, send me a message <<< Summary: Samurai Scaper Pro Series EUR/USD is an EA developed to run the EUR/USD on 5 MINUTE   timeframe. This EA uses statistical analysis applied to the EUR/USD over 20 years to determine the best points o
Indicador dom cs
Julio Cesar Daniel E Silva
O indicador DonForex é uma das ferramentas mais utilizadas para traçar suporte e resistência automaticamente.  Ele traça os melhores níveis de suporte e resistência do gráfico em qualquer tempo. Isso ajuda você a ter uma visão mais amplas para fazer suas operações As linhas pontilhadas são os pontos mais tocados pelo preço formando assim uma região de suporte ou resistência. Ele também traça automaticamente linhas de tendências de alta (LTA) ou de baixa (LTB) nos dando oportunidade de compra e
Fibonacci calculator is used with Elliot Waves, it can generate remarkable results. A trader could use these levels or ratios to find high probability trades with very small stop loss. You may also use these ratios to find Elliott Waves extensions and to book profit near those levels. For Elliot Wave experts, Fibonacci calculator is a highly useful tool that can assist them in calculating Fibonacci extension and retracement levels for the market price. The indicator proves itself as a useful one
The indicator shows the regression channel, in the calculation of which the gold Fibonacci section is used Levels are not built as graphical objects, but use indicator buffers - this allows using this indicator in Expert Advisors Near the channel borders price corrections and reversals are most probable Allows trend and counter trend trading within the channel The slope of the channel shows the direction of the market, and its width - the current volatility. Works on all timeframes, all currency
Horizontal tick volumes (HTV) Horizontal tick volumes - an easy and convenient indicator of a horizontal market profile in a user-selected time. Produces a visual image of strong trading levels by maximum peaks past volumes and trading direction by color (sell or buy), and also allows you to detect smaller trading levels by differentiating past volumes. In the "Optimal" mode, when displayed on chart periods up to and including "M30", the data of one-minute bars are used, on H1 and H4 - five-minu
The Expert Advisor works on sharp price movements; it can apply open position locking and pyramiding. Virtual stops are used (take profit, trailing stop), to limit losses, order locking and stop loss are used in% of balance. At the same time, several dozens of orders can be opened and the advisor will need free funds to exit the locks and close all positions for total profit, this should be taken into account when choosing the number of instruments for trading. The work of the adviser does not
The Arrow Scalper
Fawwaz Abdulmantaser Salim Albaker
1 (2)
Dear Friend..  I share with you this simple Expert Adviser .. it is full automatic  this Expert Adviser following the trend of the pair you install on or any stocks or indices , it is works like that: - when the trend on H4 chart show a start of up trend the expert will wait till the 15M & 1H charts show an up trend the EA will open a buy order directly , and do the same for down trend and open a sell order the buy or sell  order lot size and take profit and stop loss will measured manually  by
FREE
T Dog
Chi Hi Wu
1 (1)
T Dog is a fully automatic trading robot which is the result of more than 10 years of the market study and programming expert advisors. You could run on all Forex, Indexes and Commodities. It uses a multiple indicators to determine the market entry with an advanced exit-algorithms. T Dog build-in News filter which able to stop trading during the news releases. It also possible to enable the trailing stop to secure your profits. No Grid No Martingale No Hedging No Arbitrage It is advised to use a
Awesome Oscillator by Bill Williams with the ability to fine-tune and replace the averaging algorithms of the indicator, which significantly expands the possibilities of using this oscillator in algorithmic trading and brings it closer in its properties to such an indicator as the MACD. To reduce price noise, the final indicator is processed with an additional Smooth averaging. The indicator has the ability to give alerts, send mail messages and push signals when the direction of movement of th
StatsBar
Maksim Kalachev
StatBar 1.6 Indicator showing balance, earnings for today, yesterday and the day before yesterday. The indicator also shows: - Server; - GMT; - Server time; - Shoulder; - Spread. Description of variables: extern int Magic = "-1"; // Magic for statistics -1 = all 0 = manual extern string Symboll = "-1"; // Symbol for statistics -1 = all 0 = current EURUSD = for EURUSD
FREE
FiboMagic Auto
Ivan Zapuskalov
This Expert Advisor is used in tandem with the FiboMagic Pro indicator https://www.mql5.com/ru/market/product/64978?source=Site +Profile The FiboMagic Pro indicator shows you: 1) Which way to trade 2) Clear entry point criteria for breaking the counter-trend line in the Fibonacci structure 3) Clear exit criteria based on levels The FiboMagic Auto Expert Advisor provides you with automatic trading based on the signals of the FiboMagic Pro indicator, namely: - analyzes the breakout of the
Forex 표시기는 가격 움직임의 방향을 차트에 선 형태로 상인을 보여주는 거래 시스템입니다. 빨간색 선은 하락 추세 움직임을 나타내고 파란색 선은 상승 추세 움직임을 나타냅니다. 이 지표는 스캘핑 시스템으로 거래하기에 적합합니다. 선이 파란색이고 가격이 선 아래에 있으면 매수합니다. 가격이 선 위로 상승하면 주문을 닫습니다. 선이 빨간색이고 가격이 선 위에 있을 때 매도합니다. 가격이 선 아래에 있을 때 거래를 종료합니다. 이것은 초보 트레이더도 거래할 수 있는 매우 간단한 거래 전략입니다. 표시 매개변수: 기간 - 추세를 계산하는 기간을 변경합니다. 매개변수 값이 낮을수록 차트에 더 많은 신호가 표시됩니다. 매개변수 값이 높을수록 차트에 표시되는 신호가 줄어듭니다. 권장 사항: 기간 M5, M30, H1 통화 쌍: GBPUSD, EURUSD, XAUUSD, AUDUSD, EURJPY. 우리는 한 번에 하나의 거래만 엽니다. 우리는 이전 거래를 마감할 때만 새로운 거래를 엽니
Indicator LTS for MT4(Level + Trends + Speed)   The LTS indicator was specially created for quick analysis of   consolidations on the chart , which greatly facilitates decision-making when trading. LTS marks resistance and gives information about the forces affecting it, as well as the current speed and average travel. The indicator is easily customizable and can analyze any timeframe.    LTS uses a   unique trend analysis algorithm based on 4 parameters   from global to local.
Smart indicator  Adaptive Smart Trend Indicator  determines the sectors of the Trend and the Flat and also in the form of a histogram shows the breakdown points of the levels (1 - 5).    The indicator performs many mathematical calculations to display more optimal Trend movements on the chart. The program contains two indicators in one: 1 - draws the Trend and Flat sectors, 2 - the histogram indicator shows the best signals for opening an order. The indicator autonomously calculates the m
The Visual Volatility Clustering indicator clusters the market based on volatility. The indicator does not redraw and gives accurate data, does not use closing prices. Uses the opening prices or the highs or lows of the previous completed bar. Therefore, all information will be clear and unambiguous. The essence of the indicator is to divide the price market into certain areas according to a similar type of volatility. This can be done in any way. In this example, the indicator is configured fo
This indicator is stand alone version from  MP Pivot Levels  (All in one) containing Woodie Pivots. Woodie’s pivot points are made up of multiple key levels, calculated from past price points, in order to frame trades in a simplistic manner. The key levels include the ‘pivot’ itself, and multiple support and resistance levels (usually up to three each). Traders use these levels as a guide for future price movements when setting up trades. The pivot : (Previous high + previous low + 2 x previou
FREE
Market Profile iMT4
Kyra Nickaline Watson-gordon
Definition : A Market Profile is an intra-day charting technique (price vertical, time/activity horizontal). Market Profile is best understood as a way to see order in the markets. Market Profile was a way for traders to get a better understanding of what was going on, without having to be on the trading floor. The current indicator is developed based on Easy-to-Use architecture including a wide range of visual settings. Major Features of Indicator : Various Views of Market Profile The indica
Binary Options Assistant (BOA) ICE Signals Indicator provides signals based on gkNextLevel Binary Options Strategy.  Indicators: 2 Bollinger Bands & Stochastic Stop missing trades, stop jumping from chart to chart looking for trade set-ups and get all the signals on 1 chart! U se any of the BOA Signals Indicator with the  Binary Options Assistant (BOA) Multi Currency Dashboard .   All BOA Signal Indicator settings are adjustable to give you more strategy combinations. The signals can be
FREE
Scorpion Scalper Pro
Mohamed Amine Talbi
In the age of speed, everyone wants to gets what he/she wants quickly. Trading is all about gaining money, and scalping is a way of doing it in a short time. The "Scorpion Scalper Pro" has been named on the scorpion because of its speed. The indicator serves to provide signals for the M15 timeframe. It also sends Alerts (window alert, email alert, push notification alert) whenever a buy/sell signal occurs, and the alerts are customizable (they can be turned ON or OFF). Indicator inputs : - Buy
Colored Market Hours
Mohamed Amine Talbi
5 (1)
As the title says, this is an indicator that shows the current open market (session). It has 4 sessions with customizable schedule : 1. London session, 2. New York session, 3. Sydney session, 4. Tokyo session. Indicator inputs: - The color of each session. - The open time and close time of the sessions. - The line width. The objective of the indicator, is to follow each sessions, observe at what times are multiple sessions open, and thus take the chance of the high market movements.
FREE
Profile Map
Dmitriy Sapegin
5 (11)
Market Profile helps the trader to identify the behavior if major market players and define zones of their interest. The key feature is the clear graphical display of the range of price action, in which 70% of the trades were performed. Understanding of the location of volume accumulation areas can help traders increase the probability of success. The tool can be used as an independent system as well as in combination with other indicators and trading systems. this indicator is designed to suit
Scalper Vault
Oleg Rodin
5 (27)
Scalper Vault 는 성공적인 스캘핑에 필요한 모든 것을 제공하는 전문 스캘핑 시스템입니다. 이 표시기는 외환 및 바이너리 옵션 거래자가 사용할 수 있는 완전한 거래 시스템입니다. 권장 시간 프레임은 M5입니다. 시스템은 추세 방향으로 정확한 화살표 신호를 제공합니다. 또한 상단 및 하단 신호와 Gann 시장 수준을 제공합니다.  이 시스템은 사용하기가 매우 쉽습니다. 원하는 시장 지역의 화살표만 따라가면 됩니다. 엑시트는 가격이 적정 수준에 도달하거나 시장의 고점 또는 저점 신호가 나타날 때 수행됩니다.  표시기는 PUSH 알림을 포함한 모든 유형의 경고를 제공합니다. 인디케이터 구매 후 연락주세요. 내 개인 거래 권장 사항과 훌륭한 보너스 지표를 무료로 공유합니다! 나는 당신에게 행복하고 유익한 거래를 기원합니다!
Fast API Copier MT4
Konstantin Stratigenas
5 (1)
This EA connects trading systems on a Windows Server (VPS), providing top-tier trade copying locally or remotely and powerful API integration. Experience lightning-fast performance with a 10ms reaction time for seamless, reliable trading. For seamless operation, use the EA on a hosted server (VPS or cloud). It also works on your own server or computer. Copy Trades:  Effortlessly copy trades between terminals, local or remote. Just select the same channel for both terminals and set the Direction
Rebate Virtual Grid
Sergii Onyshchenko
3 (1)
This is a Virtual Grid EA  with  positive (for traders) slippage. I recommend it for pair EURUSD. EA may be use as Rebate generator. Works ok during news and gaps (with depo >1000$). Working timeframe M1 . Strategy The system does not use regular takeprofits and stop loss. Martingale is not used. EA use unique indicator (for open "Zero"). Monitoring (5EAs) _ https://www.mql5.com/en/signals/508303 Parameters (one of the safest) Rebate Virtual Grid                          MM_Type    0  MM: 0-
표시기를 통해 현재 가격 방향과 시장 변동성을 결정할 수 있습니다. 이 버전의 Traders Dynamic Index에는 과거 데이터의 다시 그리기가 제거되었으며 알고리즘 계산 속도가 최적화되었으며 보다 정확한 조정을 위해 더 많은 외부 매개변수가 추가되었으며 기능이 확장되었습니다. 초기 발진기 선택 및 평균 평활 방법 추가 . 매개변수: Mode Osc - 추정 발진기 선택 Period Osc - 사용된 오실레이터의 계산 기간 Price Osc - 진동 계산에 적용된 가격 Osc volatility bands period - 오실레이터의 변동성 기간 Osc volatility bands multiplier - 오실레이터의 변동성 승수 Smoothing Osc price line period - 본선의 평활화 기간 Smoothing Osc price line method - 본선의 평활화 방법 Smoothing Osc signal line period - 신호 라인의 평활화 기간 S
Leo Fibonacci
Dmitriy Zaytsev
The indicator is designed for determining Fibonacci levels. Does not repaint/redraw The blue level shows the zero Fibonacci value (it is also the Pivot level) Red levels show calculated Fibonacci levels (used as a rollback or reversal point) Automatic period detection (periods can be entered manually) Adjustable display calculation method. Settings BarsHistory - the number of bars to be used to display the indicator. Method - method of calculation. AutoPeriod - automated period calculation (true
NewsCatcher Pro
Evgeniy Scherbina
4.71 (14)
NewsCatcher Pro opens both pending and market orders based on data from the mql5.com calendar. In live mode, NewsCatcher Pro automatically downloads the calendar, opens orders, trails and closes orders. NewsCatcher Pro can trade any event from the calendar with any symbol available in MetaTrader, including Gold, Oil and cross-rates. To change the default symbol, go to the event view you want to change it for. NewsCatcher Pro uses two strategies: Strategy 1 (pending orders): the advisor opens two
이 제품의 구매자들이 또한 구매함
FX Volume
Daniel Stein
4.58 (33)
모닝 브리핑을 통해 세부 정보와 스크린샷으로 매일 시장 업데이트를 받으세요 여기 mql5 및 텔레그램에서 FX 거래량은 브로커의 관점에서 시장 심리에 대한 실제 통찰력을 제공하는 최초이자 유일한 거래량 지표입니다. 브로커와 같은 기관 시장 참여자가 외환 시장에서 어떤 포지션을 취하고 있는지에 대한 훌륭한 통찰력을 COT 보고서보다 훨씬 빠르게 제공합니다. 차트에서 이 정보를 직접 확인하는 것은 트레이딩의 진정한 판도를 바꾸고 획기적인 솔루션입니다. 다음과 같은 고유한 시장 데이터 인사이트의 이점 비율 는 통화의 매수/매도 포지션 비율을 백분율로 표시 비율 변화 는 선택한 기간 내 매수 비율과 비율 변화를 표시 총 거래량 는 해당 통화의 총 거래량(롱 및 숏)을 로트 단위로 보여줍니다 Volumes Long 는 해당 통화의 모든 롱 포지션의 거래량을 보여줍니다 Volumes Short 는 해당 통화의 모든 숏 포지션의 거래량을 보여줍니다 Net Long 는 순 롱 포지션의 거래량
Atomic Analyst
Issam Kassas
5 (2)
우선적으로 언급할 점은이 거래 지표가 다시 그리지 않고 지연되지 않으며 이를 통해 수동 및 로봇 거래 모두에 이상적이라는 점입니다. 사용자 매뉴얼: 설정, 입력 및 전략. Atomic Analyst는 가격의 강도와 모멘텀을 활용하여 시장에서 더 나은 이점을 찾는 PA Price Action Indicator입니다. 고급 필터를 장착하여 잡음과 거짓 신호를 제거하고 거래 잠재력을 높이는 데 도움이 됩니다. 복잡한 지표의 다중 레이어를 사용하여 Atomic Analyst는 차트를 스캔하고 복잡한 수학적 계산을 간단한 신호와 색상으로 변환하여 초보 트레이더가 이해하고 일관된 거래 결정을 내릴 수 있도록합니다. "Atomic Analyst"는 새로운 및 경험이 풍부한 트레이더를위한 종합적인 거래 솔루션입니다. 프리미엄 지표와 최고 수준의 기능을 하나의 거래 전략에 결합하여 모든 종류의 트레이더에 대한 다재다능한 선택지가되었습니다. 인트라데이 거래 및 스캘핑 전략 : 빠르고 정확한
Scalper Inside PRO
Alexey Minkov
4.73 (56)
An exclusive indicator that utilizes an innovative algorithm to swiftly and accurately determine the market trend. The indicator automatically calculates opening, closing, and profit levels, providing detailed trading statistics. With these features, you can choose the most appropriate trading instrument for the current market conditions. Additionally, you can easily integrate your own arrow indicators into Scalper Inside Pro to quickly evaluate their statistics and profitability. Scalper Inside
FX Power MT4 NG
Daniel Stein
5 (13)
모닝 브리핑 여기 mql5 와 텔레그램에서 FX Power MT4 NG 는 오랫동안 인기 있는 통화 강도 측정기인 FX Power의 차세대 버전입니다. 이 차세대 강도 측정기는 무엇을 제공합니까? 기존 FX Power에서 좋아했던 모든 것 PLUS GOLD/XAU 강도 분석 더욱 정밀한 계산 결과 개별 구성 가능한 분석 기간 더 나은 성능을 위한 사용자 정의 가능한 계산 한도 특별 멀티더 많은 것을보고 싶은 사람들을위한 특별한 다중 인스턴스 설정 모든 차트에서 좋아하는 색상을위한 끝없는 그래픽 설정 수많은 알림 옵션, 중요한 것을 다시는 놓치지 않도록 Windows 11 및 macOS 스타일의 둥근 모서리가 있는 새로운 디자인 마법처럼 움직이는 인디케이터 패널 FX 파워 키 특징 모든 주요 통화의 완전한 강세 이력 모든 시간대에 걸친 통화 강세 이력 모든 브로커 및 차트에서 고유 계산 결과 100% 신뢰할 수있는 실시간100 % 신뢰할 수있는 실시간 계산-> 다시 칠하지 않음
FX Levels MT4
Daniel Stein
FX 레벨은 기존의 라이트하우스 방식과 혁신적인 동적 접근 방식을 결합한 매우 정확한 지지 및 저항 지표로 모든 거래 심볼에서 완벽하게 작동합니다. 여기에는 통화쌍, 지수, 주식 또는 원자재가 포함됩니다. FX 레벨은 반전 포인트를 식별하여 차트에 표시하므로 트레이딩 활동에서 수익 목표로 이상적으로 활용할 수 있습니다. FX 레벨을 개발하면서 브로커에 대한 광범위한 경험과 데이터 피드 및 시간 설정의 다양성을 활용했습니다. 그 결과 FX 레벨은 이제 여러 브로커에서 거의 100% 동일한 레벨을 식별할 수 있습니다. FX 레벨의 이 특별한 기능은 다른 지지 및 저항 지표에서는 찾아볼 수 없는 전례 없는 수준의 신뢰성을 사용자에게 제공합니다. 스타인 인베스트먼트는 좋은 트레이딩 도구와 훌륭한 도구의 차이를 만드는 것이 세부 사항이기 때문에 세부 사항에 많은 주의를 기울이고 있으며, 세부 사항에 대한 추가주의를 통해 잘 알려진 분석 방법을 사용자에게 완전히 새로운 수준으로 끌어올릴 수
The Stochastic Basket Currency Strenght  brings the Stochastic indicator to a new level.  Expanding the boundaries of TimeFrames and mono-currency analysis, the SBCS take the movements of each currency that composes the cross and confront them in the whole basket of 7 crosses.  The indicator works with any combination of AUD, CAD, CHF, EUR, GBP, JPY, NZD, USD pairs and with full automation takes in account every stochastic value (main line) for the selected Time Frame.  After that, the indicator
TPSproTREND PrO
Roman Podpora
4.79 (19)
TPSpro TREND PRO는   시장을 자동으로 분석하여 추세와 각 변화에 대한 정보를 제공할 뿐만 아니라 다시 그리지 않고도 거래에 진입할 수 있는 신호를 제공하는 추세 지표입니다! 지표는 각 양초를 사용하여 개별적으로 분석합니다. 다른 임펄스를 언급합니다 - 업 또는 다운 임펄스. 통화, 암호화폐, 금속, 주식, 지수 거래의 정확한 진입점! 버전 MT5                   표시기에 대한 전체 설명       표시기   와 함께 사용하는 것이 좋습니다   -   RFI LEVELS 주요 기능: 렌더링 없이 정확한 입력 신호! 신호가 나타나면 관련성은 유지됩니다! 이는 신호를 제공한 후 변경하여 예금 자금 손실을 초래할 수 있는 다시 그리기 지표와의 중요한 차이점입니다. 이제 더 큰 확률과 정확도로 시장에 진입할 수 있습니다. 화살표가 나타난 후 목표에 도달(이익실현)하거나 반전 신호가 나타날 때까지 캔들을 색칠하는 기능도 있습니다. STOP LOSS / TAK
Reversal-Arrow: 정확하고 신뢰할 수 있는 반전 포인트 식별 Reversal-Arrow는 트레이더가 잠재적인 추세 반전 지점을 식별할 수 있도록 돕기 위해 설계된 고급 지표입니다. 이 지표는 명확한 시각적 신호를 제공하여 시장 상황을 이해하기 쉽게 하고 불확실성을 줄이며 의사 결정 과정을 간소화합니다. 특히 XAUUSD 및 XAUEUR의 1분, 5분, 15분 타임프레임에 최적화되어 이 시간대에서 최대 성능을 발휘합니다. 그러나 다른 통화 쌍과 시간대에서도 다양하게 사용할 수 있습니다. Reversal-Arrow의 특징 및 장점 명확한 반전 신호: Reversal-Arrow는 잠재적인 반전 지점을 표시하기 위해 컬러 화살표 시스템을 사용합니다. 녹색 화살표는 매수 신호를, 빨간색 화살표는 매도 신호를 나타냅니다. 이 시각적 표현은 직관적으로 설계되어 트레이더가 주요 반전 레벨을 쉽게 인식할 수 있도록 도와줍니다. 짧은 시간대에서 높은 정확도: 정밀한 조정을 통해 XAUUSD
TPSpro RFI Levels
Roman Podpora
4.82 (22)
지침         러시아   -        영어       표시기와 함께 사용하는 것이 좋습니다   .       -       TPSpro   트렌드 프로 -   MT4 버전         거래에서 핵심 요소는 거래 상품을 매수 또는 매도하기로 결정하는 구역 또는 수준입니다. 주요 업체가 시장에서 자신의 존재를 숨기려는 시도에도 불구하고, 그들은 필연적으로 흔적을 남깁니다. 우리의 과제는 이러한 흔적을 식별하고 올바르게 해석하는 방법을 배우는 것이었습니다. 주요 기능:: 판매자와 구매자를 위한 활성 영역을 표시합니다! 이 지표는 매수 및 매도를 위한 모든 올바른 초기 임펄스 레벨/존을 보여줍니다. 진입점 검색이 시작되는 이러한 레벨/존이 활성화되면 레벨의 색상이 바뀌고 특정 음영으로 채워집니다. 또한 상황을 보다 직관적으로 이해하기 위해 화살표가 나타납니다. 더 높은 시간대의 레벨/존 표시(MTF 모드) 더 높은 시간 간격을 사용하여 레벨/존을 표시하는 기능을 추가했습니다.
Dynamic Forex28 Navigator
Bernhard Schweigert
5 (2)
Dynamic Forex28 Navigator - 차세대 외환 거래 도구. 현재 49% 할인. Dynamic Forex28 Navigator는 오랫동안 인기 있는 지표의 진화형으로, 세 가지의 힘을 하나로 결합했습니다. 고급 통화 Strength28 지표(695개 리뷰) + 고급 통화 IMPULSE with ALERT(520개 리뷰) + CS28 콤보 신호(보너스). 지표에 대한 자세한 정보 https://www.mql5.com/en/blogs/post/758844 차세대 Strength 지표는 무엇을 제공합니까?  원래 지표에서 좋아했던 모든 것이 새로운 기능과 더 높은 정확도로 강화되었습니다. 주요 기능: 독점적인 통화 Strength 공식.  모든 시간대에 걸쳐 부드럽고 정확한 강도선. 추세와 정확한 진입을 식별하는 데 이상적입니다. 역동적인 시장 피보나치 수준(시장 피보나치).  이 지표에만 있는 고유한 기능. 가격 차트가 아닌 통화 강도에 피보나치가 적용
Basic Harmonic Patterns Dashboard
Mehran Sepah Mansoor
5 (2)
이 대시보드는 선택한 심볼에 대해 사용 가능한 최신 고조파 패턴을 표시하므로 시간을 절약하고 더 효율적으로 사용할 수 있습니다 / MT5 버전 . 무료 인디케이터: Basic Harmonic Pattern 인디케이터 열 Symbol : 선택한 심볼이 나타납니다 Trend : 강세 또는 약세 Pattern : 패턴 유형(가틀리, 나비, 박쥐, 게, 상어, 사이퍼 또는 ABCD) Entry : 진입 가격 SL: 스톱로스 가격 TP1: 1차 테이크프로핏 가격 TP2: 2차 테이크프로핏 가격 TP3: 3차 테이크프로핏 가격 Current price: 현재 가격 Age (in bars): 마지막으로 그려진 패턴의 나이 주요 입력 Symbols : "28개 주요 통화쌍" 또는 "선택한 심볼" 중에서 선택합니다. Selected Symbols : 쉼표로 구분하여 모니터링하려는 원하는 심볼("EURUSD,GBPUSD,XAUUSD")을 선택합니다. 브로커에 쌍에 접미사 또는 접두사가
Gold Channel XAUUSD
Paulo Rocha
5 (4)
Gold Channel is a volatility-based indicator, developed with a specific timing algorithm for the XAUUSD pair, which consists of finding possible corrections in the market. This indicator shows two outer lines, an inner line (retracement line) and an arrow sign, where the theory of the channel is to help identify overbought and oversold conditions in the market. The market price will generally fall between the boundaries of the channel. If prices touch or move outside the channel it is a tra
현재 20% 할인 ! 초보자 또는 전문가 트레이더를 위한 최고의 솔루션! 이 대시보드 소프트웨어는 28개의 통화 쌍에서 작동합니다. 2가지 주요 지표(Advanced Currency Strength 28 및 Advanced Currency Impulse)를 기반으로 합니다. 전체 Forex 시장에 대한 훌륭한 개요를 제공합니다. 고급 통화 강도 값, 통화 이동 속도 및 모든(9) 시간대의 28 Forex 쌍에 대한 신호를 보여줍니다. 추세 및/또는 스캘핑 기회를 정확히 파악하기 위해 차트의 단일 지표를 사용하여 전체 시장을 볼 수 있을 때 거래가 어떻게 개선될지 상상해 보십시오! 잠재적인 거래를 식별하고 확인하면서 강력한 통화와 약한 통화를 더욱 쉽게 식별할 수 있도록 이 지표에 기능을 내장했습니다. 이 표시기는 통화의 강세 또는 약세가 증가 또는 감소하는지 여부와 모든 시간대에서 수행되는 방식을 그래픽으로 보여줍니다. 추가된 새로운 기능은 현재 시장 조건 변화에 적
Advanced Currency Strength28 Indicator
Bernhard Schweigert
4.9 (652)
현재 26% 할인 초보자 또는 전문가 트레이더를 위한 최고의 솔루션! 이 지표는 우리가 독점 기능과 새로운 공식을 통합했기 때문에 독특하고 고품질이며 저렴한 거래 도구입니다. 단 하나의 차트로 28 Forex 쌍의 통화 강도를 읽을 수 있습니다! 새로운 추세 또는 스캘핑 기회의 정확한 트리거 포인트를 정확히 찾아낼 수 있기 때문에 거래가 어떻게 개선될지 상상해 보십시오. 사용 설명서: 여기를 클릭  https://www.mql5.com/en/blogs/post/697384 그것이 첫 번째, 원본입니다! 쓸모없는 지망생 클론을 사지 마십시오. 더 스페셜  강력한 통화 모멘텀을 보여주는 하위 창의 화살표 GAP가 거래를 안내합니다! 기본 또는 호가 통화가 과매도/과매도 영역(외부 시장 피보나치 수준)에 있을 때 개별 차트의 기본 창에 경고 표시가 나타납니다. 통화 강도가 외부 범위에서 떨어질 때 풀백/반전 경고. 교차 패턴의 특별 경고 추세를 빠르게 볼 수 있는
MetaTrader 4용 Ultimate Gold Advisor Ultimate Gold Advisor는 MetaTrader 4에서 거래 경험을 최적화하도록 설계된 고급 기술 도구입니다. 경험 많은 거래자의 요구를 충족하기 위해 개발된 이 지표는 정밀성, 정교한 분석 및 다기능성을 결합하여 정보에 입각한 거래 결정을 내리는 데 도움을 줍니다. 금 거래에 이상적이지만 다양한 자산에 적용 가능하며, Ultimate Gold Advisor는 시장 전략을 향상시키는 데 도움을 줄 수 있습니다. Ultimate Gold Advisor가 거래자에게 훌륭한 도구인 이유는 무엇입니까? 고급 성능: 각 거래 결과를 차트에 명확하게 표시하는 지표들의 조합으로 전략 성과를 투명하게 볼 수 있습니다. 이를 통해 접근 방식을 개선하고 더 정보에 입각한 결정을 내릴 수 있습니다. 즉각적이고 시각적인 거래 신호: 차트에 빨간색과 파란색 화살표가 표시되어 매수 및 매도 기회를 신호합니다. 이러한 시각적 신호는
Gann Swing Structure
Kirill Borovskii
5 (1)
This indicator is based on the mathematics of the great trader W.D. Ganna. With its help, you can easily find strong levels by analyzing swings to find the optimal entry point. The indicator works on all instruments and all timeframes. The indicator is fully manual and has control buttons. All you need to do is press the NEW button, a segment will appear, which you can place on any movement, swing or even 1 candle that you want to analyze. By placing the segment, press the OK button. A grid (th
ON Trade Waves Patterns Harmonic Elliot Wolfe를 소개합니다. 이는 수동 및 자동 방법을 사용하여 다양한 시장 패턴을 감지하기 위해 개발된 고급 지표입니다. 다음은 그 작동 방식입니다: 조화적 패턴: 이 지표는 차트에 나타나는 조화적 패턴을 식별할 수 있습니다. 이러한 패턴은 Scott Carney의 "Harmonic Trading vol 1 및 2"에서 설명한 것처럼 조화적 거래 이론을 연습하는 트레이더에게 중요합니다. 수동으로 그리든 자동 감지를 사용하든 ON Trade Waves Patterns가 도움을 줄 것입니다. 컨트롤 패널: 이 지표에는 사용자 친화적인 컨트롤 패널이 있습니다. 차트 및 시간 프레임 설정을 저장하여 다양한 구성 간에 쉽게 전환할 수 있습니다. 차트 공간을 최대화하려면 최소화할 수도 있습니다. 다른 분석 도구를 사용하는 것을 선호하는 경우 닫기 버튼을 클릭하여 모든 지표 데이터를 숨길 수 있습니다. 템플릿 저장: 설정을 사
Advanced Supply Demand
Bernhard Schweigert
4.91 (295)
현재 33% 할인! 초보자나 전문 트레이더를 위한 최고의 솔루션! 이 보조지표는 우리가 다수의 독창적 기능과 새로운 공식을 통합한 독특하고 고품질이며 저렴한 거래 도구입니다. 이 업데이트를 통해 이중 시간대를 표시할 수 있습니다. 더 높은 TF를 표시할 수 있을 뿐만 아니라 차트 TF와 더 높은 TF 모두를 표시할 수 있습니다: 중첩 영역 표시. 모든 Supply Demand 트레이더들이 좋아할 것입니다. :) 중요한 정보 공개 Advanced Supply Demand의 잠재력을 극대화하려면 다음을 방문하십시오. https://www.mql5.com/ko/blogs/post/720245   진입 또는 목표의 명확한 트리거 포인트를 정확히 찾아냄으로 해서 거래가 어떻게 개선될지 상상해 보십시오. 새로운 알고리즘을 기반으로 매수자와 매도자 간의 잠재적인 불균형을 훨씬 더 쉽게 분간할 수 있습니다. 왜냐하면 가장 강한 공급영역과 가장 강한 수요 영역과 과거에 어떻게 진행 되었는지를(이
Supply and Demand Dashboard PRO
Bernhard Schweigert
4.8 (20)
현재 20% 할인! 이 대시보드는 여러 기호와 최대 9개의 타임프레임에서 작동하는 매우 강력한 소프트웨어입니다. 주요 지표(최상의 리뷰: 고급 공급 수요)를 기반으로 합니다.   Advanced Supply Demand 대시보드는 훌륭한 개요를 제공합니다. 다음과 같이 표시됩니다.  영역 강도 등급을 포함하여 필터링된 공급 및 수요 값, 영역에 대한/및 영역 내 Pips 거리, 중첩된 영역을 강조 표시하고 모든 (9) 시간 프레임에서 선택한 기호에 대해 4가지 종류의 경고를 제공합니다. 그것은 당신의 개인적인 필요에 맞게 고도로 구성 가능합니다! 당신의 혜택! 모든 트레이더에게 가장 중요한 질문: 시장에 진입하기에 가장 좋은 수준은 무엇입니까? 최고의 성공 기회와 위험/보상을 얻으려면 강력한 공급/수요 영역 내 또는 그 근처에서 거래를 시작하십시오. 손절매를 위한 최적의 장소는 어디입니까? 가장 안전하려면 강력한 수요/공급 구역 아래/위에 정
Advanced Currency IMPULSE with ALERT
Bernhard Schweigert
4.9 (483)
현재 31% 할인!! 초보자 또는 전문가 트레이더를 위한 최고의 솔루션! 이 지표는 우리가 독점 기능과 비밀 공식을 통합했기 때문에 독특하고 고품질이며 저렴한 거래 도구입니다. 단 하나의 차트로 28개 통화 쌍 모두에 대한 경고를 제공합니다. 새로운 추세 또는 스캘핑 기회의 정확한 트리거 포인트를 정확히 찾아낼 수 있기 때문에 거래가 어떻게 개선될지 상상해 보십시오! 새로운 기본 알고리즘을 기반으로 구축되어 잠재적인 거래를 훨씬 더 쉽게 식별하고 확인할 수 있습니다. 이는 통화의 강세 또는 약세가 가속되는지 여부를 그래픽으로 표시하고 가속 속도를 측정하기 때문입니다. 자동차의 속도계처럼 생각하면 됩니다. 가속화할 때 Forex 시장에서 동일한 일이 분명히 더 빠르게 발생합니다. 즉, 반대 방향으로 가속화되는 통화를 페어링하면 잠재적으로 수익성 있는 거래를 식별한 것입니다. 통화 모멘텀의 수직선과 화살표가 거래를 안내합니다! 역동적인 Market Fibonacci 23
Enigmera
Ivan Stefanov
5 (3)
에니메라: 시장의 핵심 https://www.enigmera.com 소개 이 지표 및 트레이딩 시스템은 금융 시장에 대한 놀라운 접근 방식입니다. 에니메라는 프랙탈 주기를 사용하여 지지선과 저항선을 정확하게 계산합니다. 진정한 축적 단계를 보여주고 방향과 목표를 제시합니다.  추세에 있든 조정에 있든 작동하는 시스템입니다.  어떻게 작동하나요? 에니메라는 지지선/저항선, 목표선, 편차선의 세 가지 라인으로 구성됩니다. 이 시스템은 과거 데이터를 현재와 미래로 추정하는 일반적인 시장 지표와 달리 현재에 대한 완전한 그림을 제공합니다. 지지선 위에 있으면 실제 지지를 의미하고 저항선 위에 있으면 실제 저항을 의미합니다. 레벨이 깨지면 추세의 변화를 나타냅니다. 다시 그리지 않습니다. 시장이 지속적으로 진화함에 따라 에니메라는 평가 도구를 조정하여 전략을 정기적으로 수정합니다.   이를 통해 모든 시나리오를 철저히 평가할 수 있습니다. 이 시장 지표의 고유성은 분명하며 그 기
Apollo Pips PLUS SP
Oleg Rodin
5 (4)
제품을 구매하기 전에 아래 정보를 읽어보세요! Apollo Pips PLUS SP는 독특한 제품입니다! 모든 거래 지표에 액세스할 수 있는 새로운 "APOLLO PIPS" 지표와 "슈퍼 팩" 보너스를 받고 싶은 분들을 위한 것입니다! Apollo Pips PLUS SP 제품을 구매하면 실제로 Apollo Pips 표시기의 완전히 새로운 버전을 구매하게 됩니다. 이 버전의 지표에는 개선된 알고리즘과 사용하기 쉬운 매개변수가 있어 모든 시장 및 거래 스타일에서 지표를 사용할 수 있는 기회를 제공합니다. 이 제품의 구매자는 슈퍼 보너스로 다른 모든 표시기에 무료로 액세스할 수 있습니다! 내 모든 거래 도구에 액세스하고 싶었다면 이 제품이 당신에게 딱 맞습니다! :) 하지만 이것이 전부는 아닙니다! :) 이 제품의 모든 구매자는 또한 내 새로운 지표를 무료로 받을 자격이 있습니다! :) 새로운 거래 지표를 사용할 수 있게 되었는데, 귀하는 저의 특별한 "SUPER PACK" 평생 보너스
TakePropips Donchian Trend Pro
Eric John Pajarillaga Aldana
4.44 (16)
TakePropips Donchian Trend Pro   (MT4)는 Donchian 채널을 사용하여 추세의 방향을 자동으로 감지하고 진입 및 퇴장 거래 신호를 제공하는 강력하고 효과적인 도구입니다! 이 다기능 지표에는 추세 스캐너, 거래 신호, 통계 패널, 스크리너, 거래 세션 및 경고 내역 대시보드가 포함됩니다. 거래 신호를 제공하고 차트 분석 시간을 절약하도록 설계되었습니다! 다음 블로그 게시물에서 사용자 설명서 및 설치 가이드를 다운로드할 수 있습니다.   https://www.mql5.com/en/blogs/post/751368 오늘 50% 할인을 받으세요! 가격이 $98에서 $49로 인하되었습니다! 전략 테스터에서 이 지표를 테스트할 수 있습니다(비주얼 모드 활성화).  자세한 내용은 설명 아래에 비디오 자습서도 제공됩니다. 질문이 있거나 도움이 필요하면 저에게 연락하십시오. TakePropips Donchian Trend Pro 지표는 모든 Forex 쌍, 금속
XQ Indicator MetaTrader 4
Marzena Maria Szmit
4 (4)
Step into the realm of Forex trading with confidence and precision using XQ, a cutting-edge Forex indicator designed to elevate your trading game to unprecedented heights. Whether you're a seasoned trader or just stepping into the world of currency exchange,   XQ Forex Indicator   empowers you with the insights and signals needed to make informed trading decisions. The signal conditions are a combination of three indicators, and XQ Forex Indicator only display  medium and long-term trends . The
TrendMaestro
Stefano Frisetti
5 (3)
note: this indicator is for METATRADER4, if you want the version for METATRADER5 this is the link:  https://www.mql5.com/it/market/product/108106 TRENDMAESTRO ver 2.4 TRENDMAESTRO recognizes a new TREND in the bud, he never makes mistakes. The certainty of identifying a new TREND is priceless. DESCRIPTION TRENDMAESTRO identifies a new TREND in the bud, this indicator examines the volatility, volumes and momentum to identify the moment in which there is an explosion of one or more of these data a
ACB Breakout Arrows
KEENBASE SOFTWARE SOLUTIONS
4.15 (34)
The ACB Breakout Arrows indicator provides a crucial entry signal in the market by detecting a special breakout pattern. The indicator constantly scans the chart for a settling momentum in one direction and provide the accurate entry signal right before the major move.  Get multi-symbol and multi-timeframe scanner from here - Scanner for ACB Breakout Arrows MT4 Key features Stoploss and Take Profit levels are provided by the indicator. Comes with a MTF Scanner dashboard which tracks the brea
SSM ZakopiecFX Follow The Trend
ROBERT URBANSKI
4.82 (22)
맞춤형 MT4 지표로 성공적인 외환 거래에 대한 비밀을 발견하십시오! 외환 시장에서 성공을 달성하고 위험을 최소화하면서 일관되게 이익을 얻는 방법을 궁금해 한 적이 있습니까? 여기에 당신이 찾고 있던 답이 있습니다! 거래에 대한 귀하의 접근 방식을 혁신 할 독점적 MT4 지표를 소개 할 수 있습니다. 독특한 다양성 우리의 지표는 Renko 및 Rangebar Candle Formations를 선호하는 사용자를 위해 특별히 설계되었습니다. 우리는 이러한 차트 유형이 많은 숙련 된 거래자들이 선호한다는 것을 이해하기 때문에 우리의 지표가 그들과 완벽하게 통합되어 비교할 수없는 시장 분석을 제공합니다. 명확한 추세 신호 복잡한 분석을 잊어 버리십시오! 우리의 지표는 생생한 색상과 명확한 점 구조를 사용하여 시장 동향을 명확하게 나타냅니다. 빨간색과 파란색 점은 가격 이동 방향에 대해 의심의 여지가 없어 거래에서 빠른 의사 결정을 할 수 있습니다. HH/HL HL/LL
(Currently 30% OFF) Before reading the description of this indicator, I just want to introduce to you following concept Moving Average Line - Typical moving average which is based on one chart alone.  Currency Strength Line - The moving average of a certain pair in which the strength is based on 28 pairs. Can be said as the real moving average line. Moving Average indeed is one of the most popular indicator which almost every trader use. Currency Strength Meter is also a trend indicator whic
Shepherd Harmonic Pattern
Abdullah Alrai
4.65 (49)
이 지표는 수동 및 자동 방법으로 차트에 그려진 고조파 패턴을 감지합니다. 사용자 매뉴얼은 다음 링크에서 확인할 수 있습니다. 리뷰를 작성하고 문의하면 무료 버전으로 MT4에서 제품을 시도할 수 있습니다. Gartley 및 Nenstar 패턴을 감지하는 데 사용할 수 있습니다. https://www.mql5.com/en/market/product/30181 전체 MT4 버전을 구입하려면 다음에서 구입할 수 있습니다. https://www.mql5.com/en/market/product/15212 참고 사항 지표에는 제어 패널이 있으며 모든 (차트 및 시간대) 설정을 저장합니다. 차트에서 더 많은 공간을 확보하려면 최소화할 수 있으며, 다른 분석 도구로 작업하는 것이 선호되는 경우 모든 지표 데이터를 숨기려면 닫기 버튼을 누를 수 있습니다. 이 지표를 사용하고 설정을 변경하면 이동 평균 또는 볼린저 밴드와 같은 지표를 추가하면 자동으로 템플릿을 저장하고 필요할 때 언제든지 로드할 수
Currency Strength Matrix
Raymond Gilmour
4.5 (26)
THE ONLY CURRENCY STRENGTH INDICATOR THAT IS BASED ON PRICE ACTION. DESIGNED FOR TREND, MOMENTUM & REVERSAL TRADERS This indicator  reads price action to confirm trend and strength . Advanced multi-currency and multi-time frame indicator that shows you simply by looking at one chart, every currency pair that is trending and the strongest and weakest currencies driving those trends. For full details on how to use this indicator, and also how to get a FREE chart tool, please see user manual HER
제작자의 제품 더 보기
Market Structures MT5
Andrei Novichkov
4.78 (9)
The Market Structures MT5 indicator finds and shows the Break Of Structures (BoS) pattern on the chart. The pattern is an important part of the Smart Money Concepts (SMC) system. The appearance of a pattern means that the price breaks the last peak of an uptrend, or the last bottom of a downtrend. This indicates a change in the existing trend structure and the beginning of a new movement. BOS is a technical analysis tool used to identify trend reversals. The set of input parameters is simple
FREE
Market Structures MT4
Andrei Novichkov
4.5 (4)
The Market Structures MT4 indicator finds and shows the Break Of Structures (BoS) pattern on the chart. The pattern is an important part of the Smart Money Concepts (SMC) system. The appearance of a pattern means that the price breaks the last peak of an uptrend, or the last bottom of a downtrend. This indicates a change in the existing trend structure and the beginning of a new movement. BOS is a technical analysis tool used to identify trend reversals. The set of input parameters is simple
FREE
GridShowAverageMT5
Andrei Novichkov
3 (1)
For any number of placed market and pending orders, the utility calculates the "breakeven level" - weighted average price. The calculation is performed individually for buy and sell orders. The weighted average price is marked with a label and colored horizontal line separately as well - one line for the buy price, and the other for sell price. Input Parameters: Include pending. Include the pending orders in calculation. The default value of this parameter is false, and the calculation of the
FREE
CloneChartMT5
Andrei Novichkov
5 (1)
This utility clones the chart it is running on. It opens the same chart with the same graphical objects, set of indicators (saving the parameters) and the rest of the elements. In essence, it performs a deep copying of the original chart, transferring the template to the opened chart. The symbol and the timeframe of the original chart are also saved.
FREE
CloneChartMT4
Andrei Novichkov
5 (2)
This utility clones the chart it is running on. It opens the same chart with the same graphical objects, set of indicators (saving the parameters) and the rest of the elements. In essence, it performs a deep copying of the original chart, transferring the template to the opened chart. The symbol and the timeframe of the original chart are also saved.
FREE
The script allows to use the mouse for placing a grid of orders with fixed or variable step quickly and with as few mistakes as possible. Drag the script to the chart using the left mouse button and release. The grid will be plotted starting from that point. If the current price is lower than the grid start point, the grid will be placed "to the north" towards the buys, and if higher - towards the sells, "to the south". Setting take profit and stop loss is left to trader's discretion. Input Pa
Модифицируйте тейк профит и стоп лосс сети ордеров с помощью мыши. Перетащите скрипт на график левой кнопкой мыши и отпустите. Скрипт выставляет всем рыночным и отложенным ордерам раздельно, единый стоп лосс и единый тейк профит, используя величину цены в точке окончания перетаскивания. Входные параметры Buy or sell - Ордера какого типа подлежат модификации. Возможны два варианта: All BUY - все ордера на покупку All SELL - все ордера на продажу По умолчанию значение этого параметра All BUY. Wh
If a complex grid with specified stop loss and take profit levels has been created in the wrong place by mistake, it is not necessary to remove it and start over again. The grid can be moved to a new place using the mouse. Drag the script to the chart and drop it where the grid should be moved. The grid will be moved, keeping the distance between orders, distances to stop loss and take profit. The script works exclusively with pending orders , market orders will be left unchanged. Input Parame
VSA on the Fly MT4
Andrei Novichkov
The "VSA on the FLY" indicator is designed to quickly display various Volume Profile / Market Profile parameters.. The indicator takes the initial data for operation from the M1 timeframe. The indicator is installed on any timeframe and starts displaying data starting from the selected left border. This can be the beginning of a day, a week, a trading session, any hour, etc. The version of this indicator for MetaTrader 5 can be found here . The following input parameters are available: Show
Scalper Channel MT4
Andrei Novichkov
"Scalper Channel MT4" is a modern channel indicator that shows the trader the direction of the trade. For work, the indicator uses built-in and proprietary technical means and a new secret formula. Load it on the chart and the indicator will show you the entry direction in color: If the upper limit of the price channel of the indicator is blue, open a buy position. If the lower limit of the price channel of the indicator is red, open a sell position. If the border of the indicator is gray, ne
Indicator ICT Implied Fair Value Gap (IFVG) is an important part of the Smart Money Concepts (SMC) system. It looks for and shows on the chart a modern pattern - the Fair Value Gap ( FVG ). This pattern is a three candlestick imbalance formation based on the discovery of a mismatch between supply and demand. This happens when the price moves quickly in one direction without encountering resistance. The result is a "gap", which can be filled in later. The indicator finds this pattern using the up
Smart M Concept MT4
Andrei Novichkov
Our new indicator is an important part of the Smart Money Concepts (SMC) system It uses a modern market vision and fast calculation methods. As a result, the trader has a complete picture of the trade at every moment in time, which makes the process of obtaining results easier and faster. Our new indicator displays the following important patterns:   Order Blocks. Imbalance – Fair Value Gap (FVG). Break Of Structures (BoS). Change of character (CHoCH). Equal highs & lows. Premium , Equili
The script allows to use the mouse for placing a grid of orders with fixed or variable step quickly and with as few mistakes as possible. Drag the script to the chart using the left mouse button and release. The grid will be plotted starting from that point. If the current price is lower than the grid start point, the grid will be placed "to the north" towards the buys, and if higher - towards the sells, "to the south". Setting take profit and stop loss is left to trader's discretion. Input Pa
Modify the take profit and stop loss of orders grid using the mouse. Drag the script to the chart using the left mouse button and release. The script sets a single stop loss and take profit to all positions and pending orders separately, using the price value at the final point of dragging. Input Parameters Buy or sell - the type to be modified. There are two options: All BUY - all buy orders and positions (this parameter is set to All BUY by default.) All SELL - all sell orders and positions
If a complex grid with specified stop loss and take profit levels has been created in the wrong place by mistake, it is not necessary to remove it and start over again. The grid can be moved to a new place using the mouse. Drag the script to the chart and drop it where the grid should be moved. The grid will be moved, keeping the distance between orders, distances to stop loss and take profit. The script works exclusively with pending orders , market orders will be left unchanged. Input Parame
VSA on the Fly MT5
Andrei Novichkov
The "VSA on the FLY" indicator is designed to quickly display various Volume Profile / Market Profile parameters.. The indicator takes the initial data for operation from the M1 timeframe. The indicator is installed on any timeframe and starts displaying data starting from the selected left border. This can be the beginning of a day, a week, a trading session, any hour, etc. The version of this indicator for MetaTrader 4 can be found here . The following input parameters are available: Show
Scalper Channel MT5
Andrei Novichkov
"Scalper Channel MT5" is a modern channel indicator that shows the trader the direction of the trade. For work, the indicator uses built-in and proprietary technical means and a new secret formula. Load it on the chart and the indicator will show you the entry direction in color: If the upper limit of the price channel of the indicator is blue, open a buy position. If the lower limit of the price channel of the indicator is red, open a sell position. If the border of the indicator is gray, ne
Indicator ICT Implied Fair Value Gap (IFVG) is an important part of the Smart Money Concepts (SMC) system. It looks for and shows on the chart a modern pattern - the Fair Value Gap ( FVG ). This pattern is a three candlestick imbalance formation based on the discovery of a mismatch between supply and demand. This happens when the price moves quickly in one direction without encountering resistance. The result is a "gap", which can be filled in later. The indicator finds this pattern using the up
The Market Structures Pro indicator finds and displays 5 (five) patterns of the Smart Money Concepts (SMC) system on the chart, namely: Break Of Structures (BoS)       Change of character (CHoCH) Equal Highs & Lows Premium, Equilibrium and Discount zones with Fibo grid High-high, Low-low, High-low and Low-high extremes Patterns are displayed for two modes - Swing and Internal and are easily distinguished by color on the chart. Internal mode features higher contrast colors, finer lines, and sm
Smart M Concept MT5
Andrei Novichkov
Our new indicator is an important part of the Smart Money Concepts (SMC) system It uses a modern market vision and fast calculation methods. As a result, the trader has a complete picture of the trade at every moment in time, which makes the process of obtaining results easier and faster. Our new indicator displays the following important patterns:   Order Blocks. Imbalance – Fair Value Gap (FVG). Break Of Structures (BoS). Change of character (CHoCH). Equal highs & lows. Premium , Equili
필터:
wuzzy66
921
wuzzy66 2023.12.09 23:08 
 

This is a must have indicator if you want to boost your trading profit this indicator was exactly want I having been looking for it finds the swing points so you can catch as much as 100 pips on reversal and also developer has been very helpful and it’s worth renting for $60 for a year you can easily make your money back in a day if you go for H4 time frame very reversal pulls back as much as over 100 pips

리뷰 답변
버전 1.10 2023.12.06
1. Added alerts about pattern breakout. Available: text messages, sound messages, notifications to a smartphone and email.
2. Internal algorithms have been optimized.