Market Structures Pro MT5
- 지표
- Andrei Novichkov
- 버전: 1.10
- 업데이트됨: 6 12월 2023
- 활성화: 5
The Market Structures Pro indicator finds and displays 5 (five) patterns of the Smart Money Concepts (SMC) system on the chart, namely:
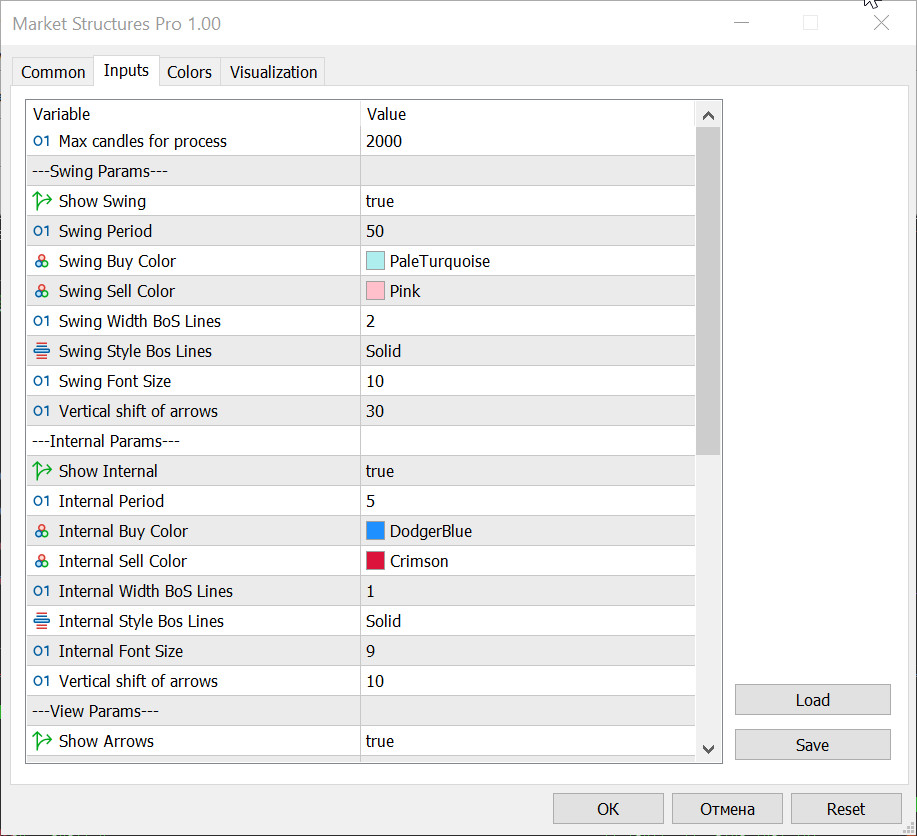
Patterns are displayed for two modes - Swing and Internal and are easily distinguished by color on the chart. Internal mode features higher contrast colors, finer lines, and smaller character sizes. For Swing mode, colors are less vibrant, lines are thicker, and symbols are larger. In the indicator you can enable/disable the display of each mode.
In addition, the indicator separately turns on/off the display of High-high, Low-low, High-low and Low-high extremes, Premium, Equilibrium and Discount zones and “Legends” - tables with hints to the user.
For Premium, Equilibrium and Discount zones, it is possible to display Fibo with customizable levels.
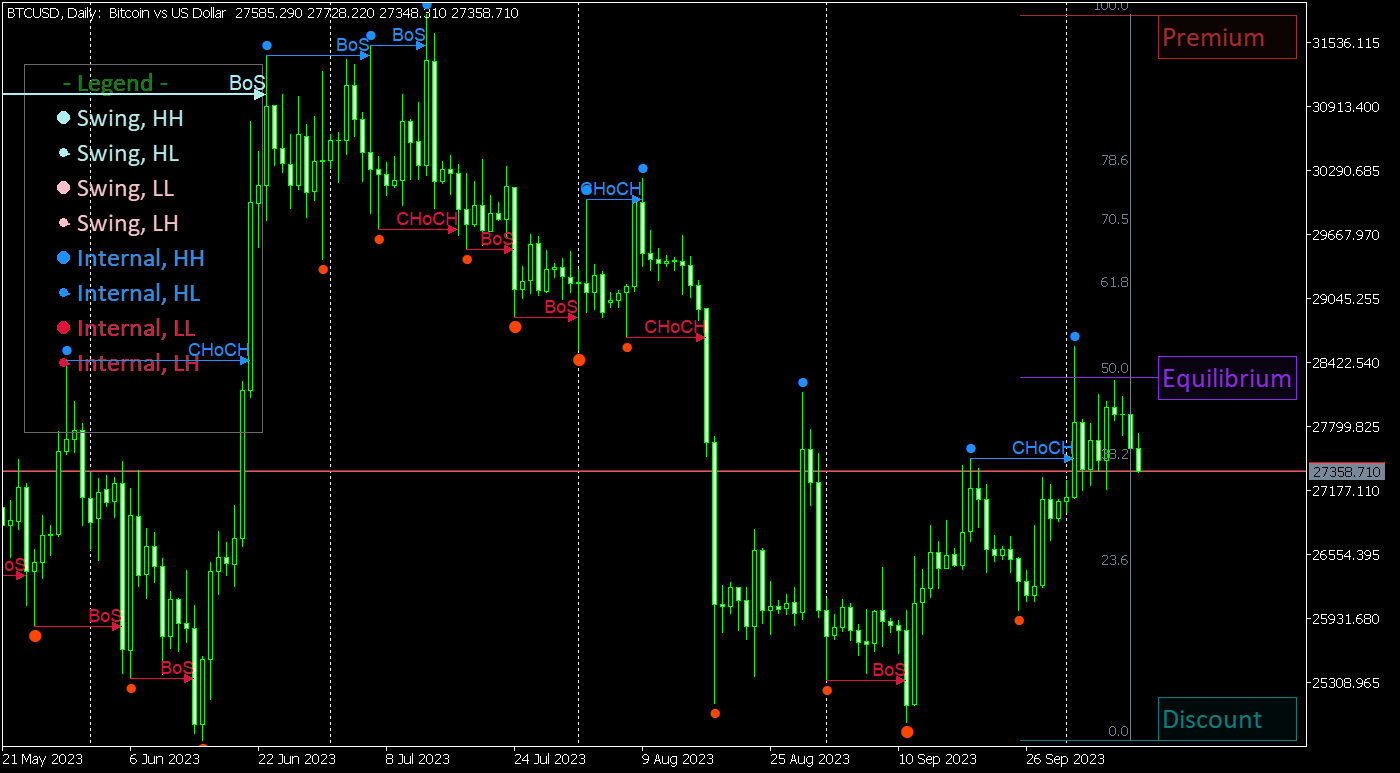
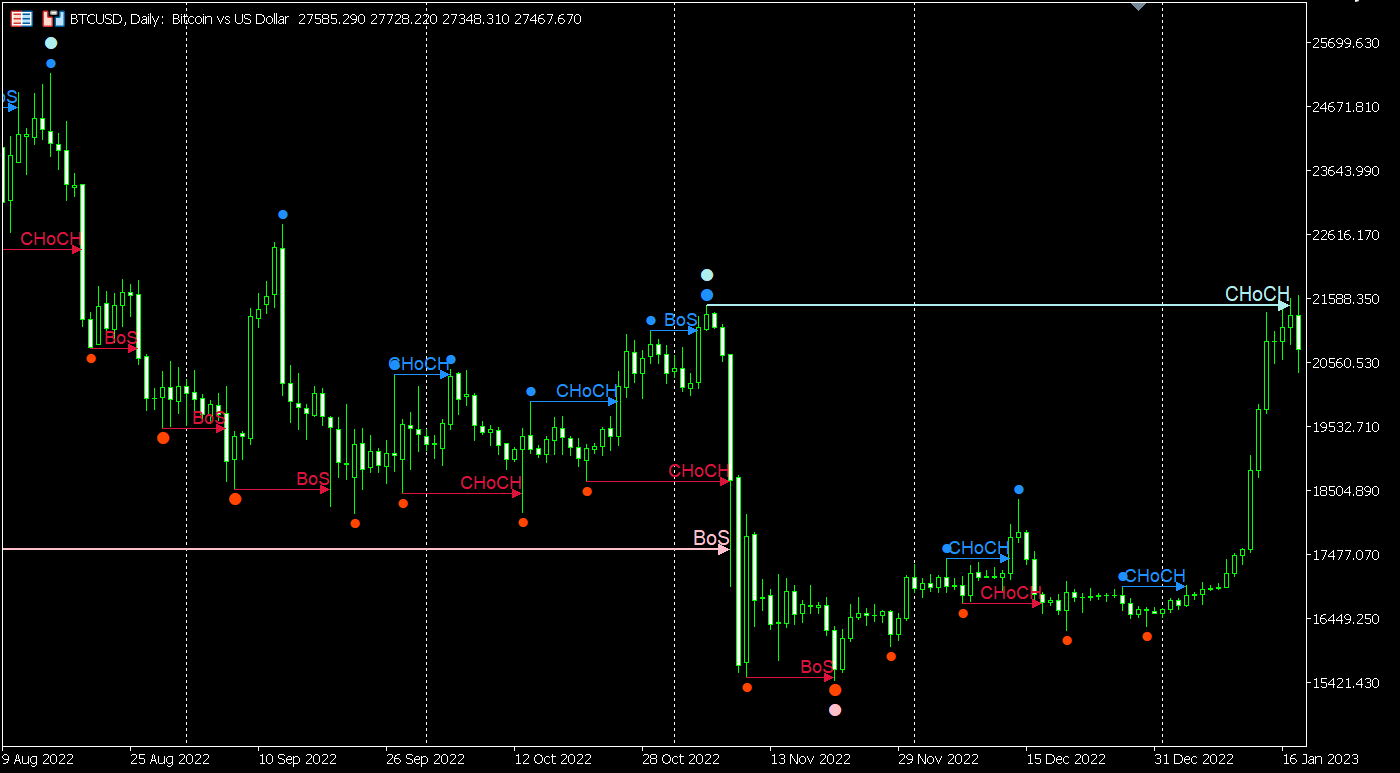
Two screenshots demonstrate two options (out of several) for displaying the indicator:
There is a completely free “demo” version for this indicator here. Work with it, read the reviews and make the right decision about the need to purchase this indicator.
I wish everyone successful trading and big profits)
- Break Of Structures (BoS)
- Change of character (CHoCH)
- Equal Highs & Lows
- Premium, Equilibrium and Discount zones with Fibo grid
- High-high, Low-low, High-low and Low-high extremes
Patterns are displayed for two modes - Swing and Internal and are easily distinguished by color on the chart. Internal mode features higher contrast colors, finer lines, and smaller character sizes. For Swing mode, colors are less vibrant, lines are thicker, and symbols are larger. In the indicator you can enable/disable the display of each mode.
In addition, the indicator separately turns on/off the display of High-high, Low-low, High-low and Low-high extremes, Premium, Equilibrium and Discount zones and “Legends” - tables with hints to the user.
For Premium, Equilibrium and Discount zones, it is possible to display Fibo with customizable levels.
Two screenshots demonstrate two options (out of several) for displaying the indicator:
- Full output of all available options
- "Zones" and "Legends" are not output
There is a completely free “demo” version for this indicator here. Work with it, read the reviews and make the right decision about the need to purchase this indicator.
I wish everyone successful trading and big profits)