Most visited level PRO
- 지표
- Ivan Stefanov
- 버전: 1.0
- 활성화: 15
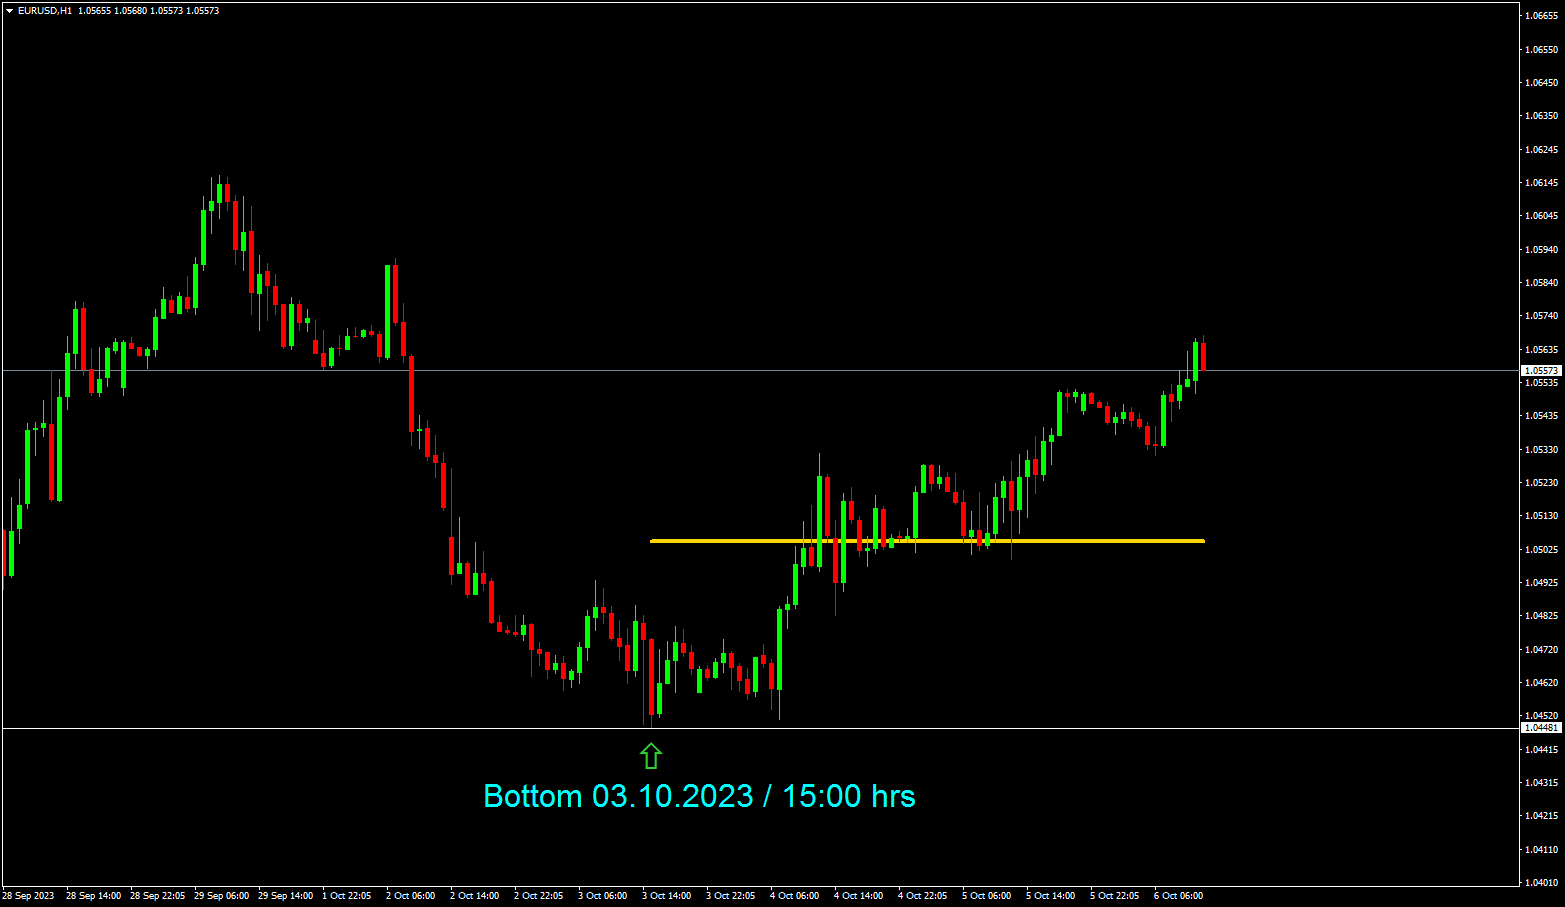
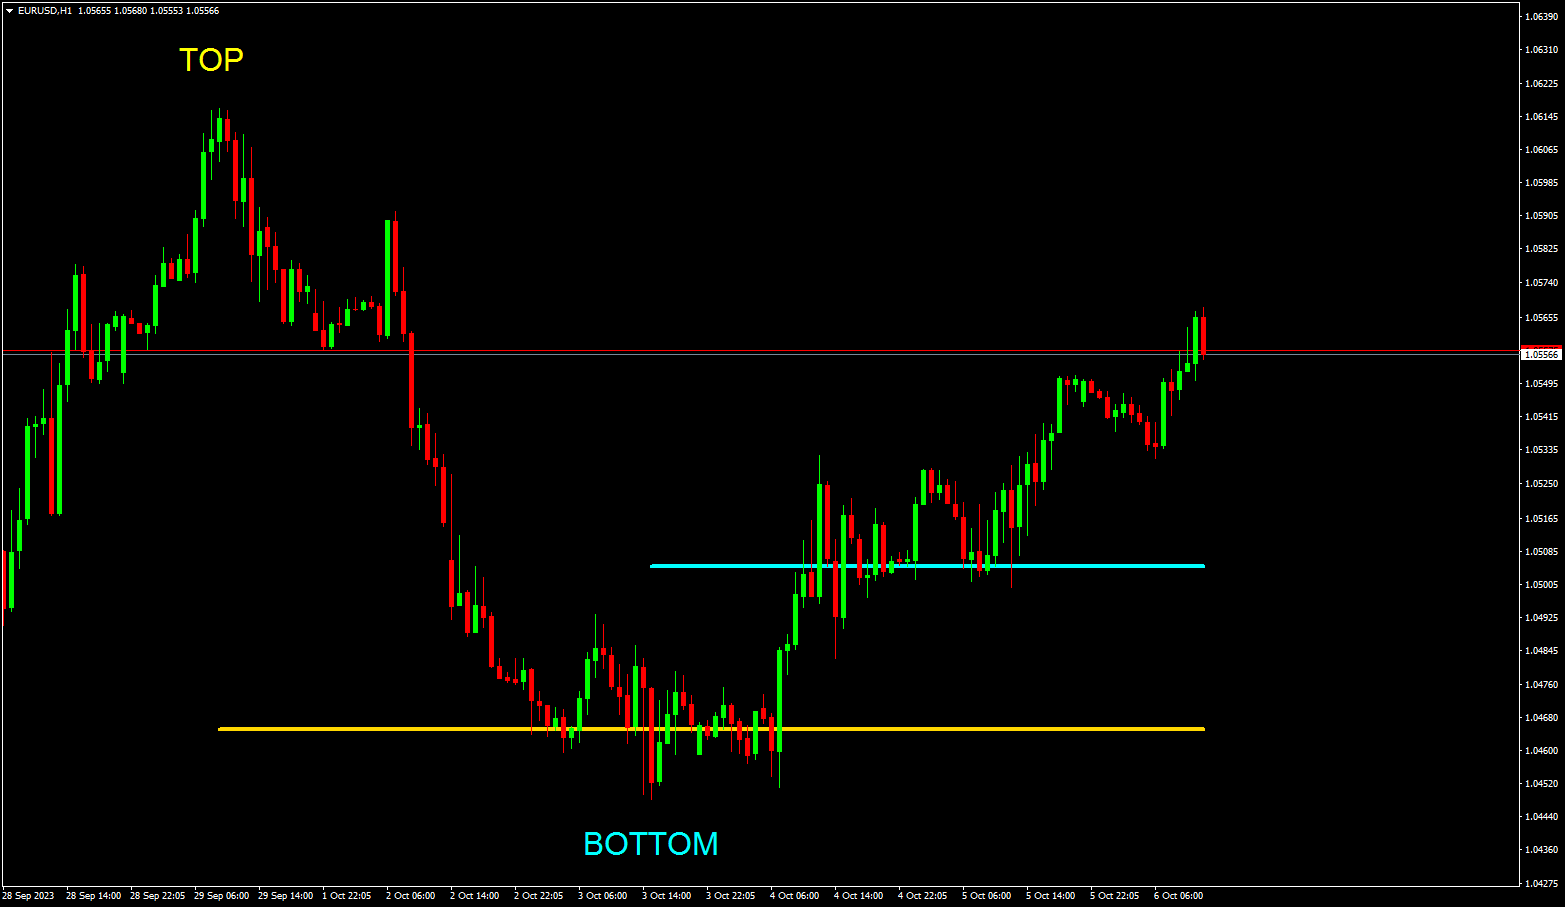
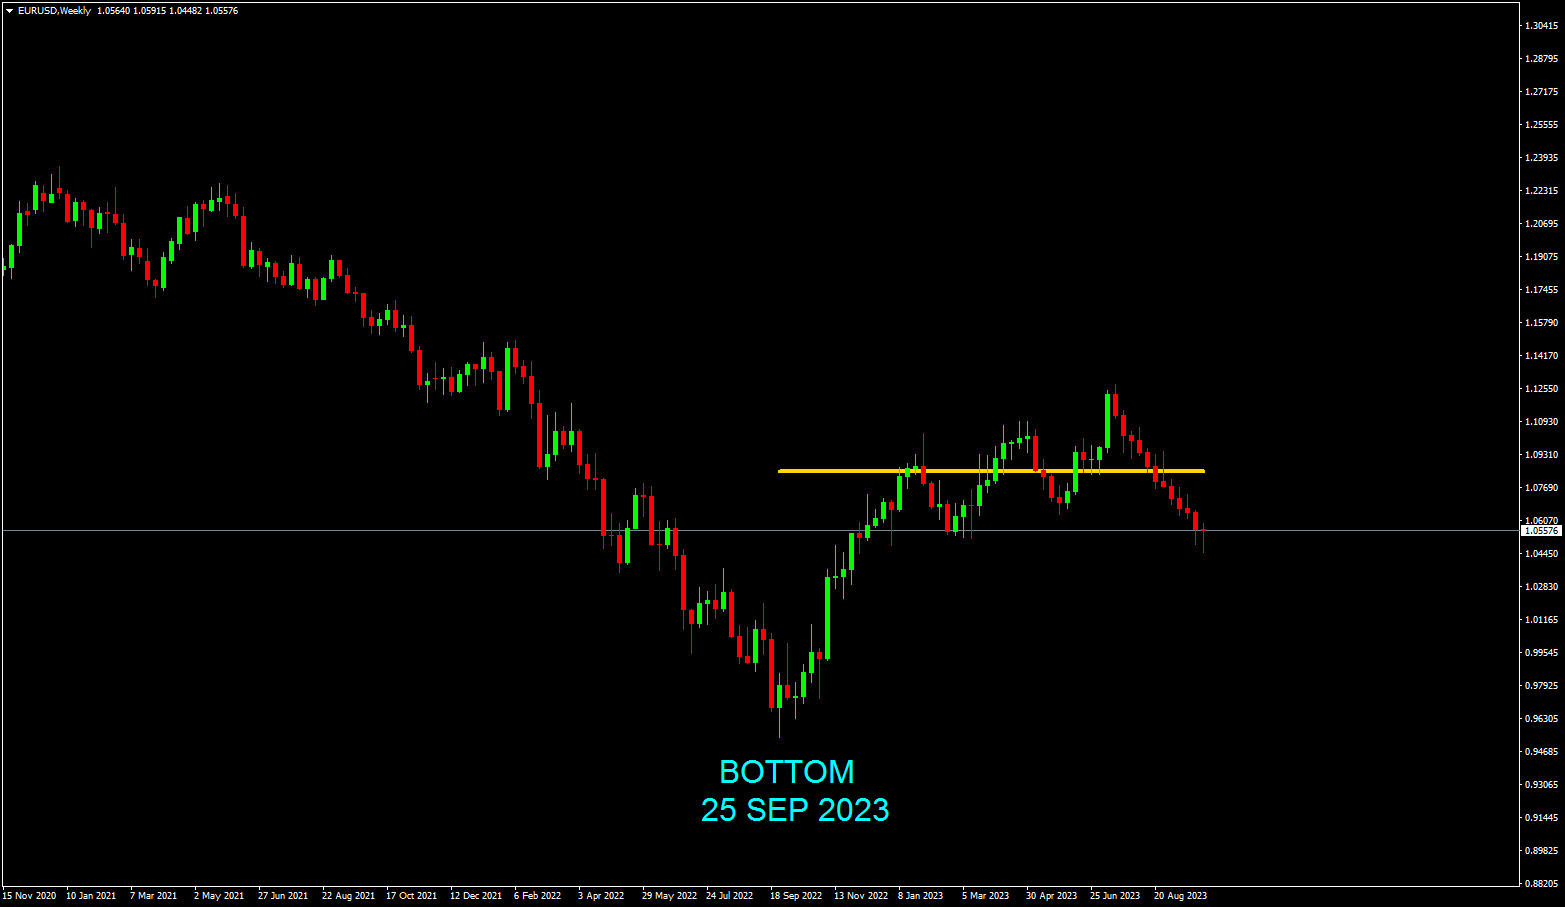
이 지표는 실제 경험을 바탕으로 합니다.
최고/최저의 날짜/시간을 입력합니다.
고점/저점부터 현재 시점까지 가장 많이 방문한 레벨을 계산합니다.
새로운 캔들이 생길 때마다 자동으로 업데이트됩니다.
다양한 추세와 기간에 대해 여러 지표를 동시에 사용할 수 있습니다.
기간은 항상 생리 시작부터 현재까지의 기간으로 표시됩니다.
유용한 프로 도구.
이 지표는 실제 경험을 바탕으로 합니다.
최고/최저의 날짜/시간을 입력합니다.
고점/저점부터 현재 시점까지 가장 많이 방문한 레벨을 계산합니다.
새로운 캔들이 생길 때마다 자동으로 업데이트됩니다.
다양한 추세와 기간에 대해 여러 지표를 동시에 사용할 수 있습니다.
기간은 항상 생리 시작부터 현재까지의 기간으로 표시됩니다.
유용한 프로 도구.
이 지표는 실제 경험을 바탕으로 합니다.
최고/최저의 날짜/시간을 입력합니다.
고점/저점부터 현재 시점까지 가장 많이 방문한 레벨을 계산합니다.
새로운 캔들이 생길 때마다 자동으로 업데이트됩니다.
다양한 추세와 기간에 대해 여러 지표를 동시에 사용할 수 있습니다.
기간은 항상 생리 시작부터 현재까지의 기간으로 표시됩니다.
유용한 프로 도구.