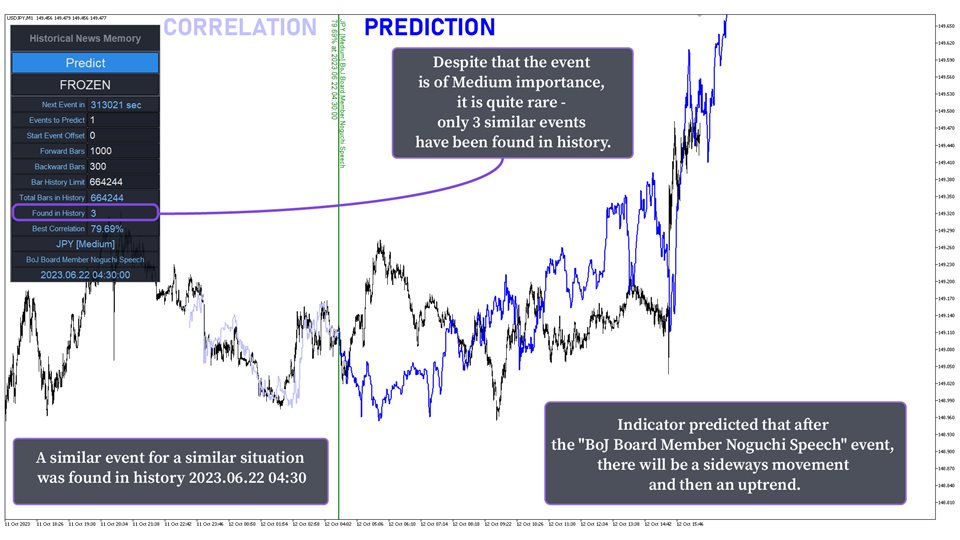
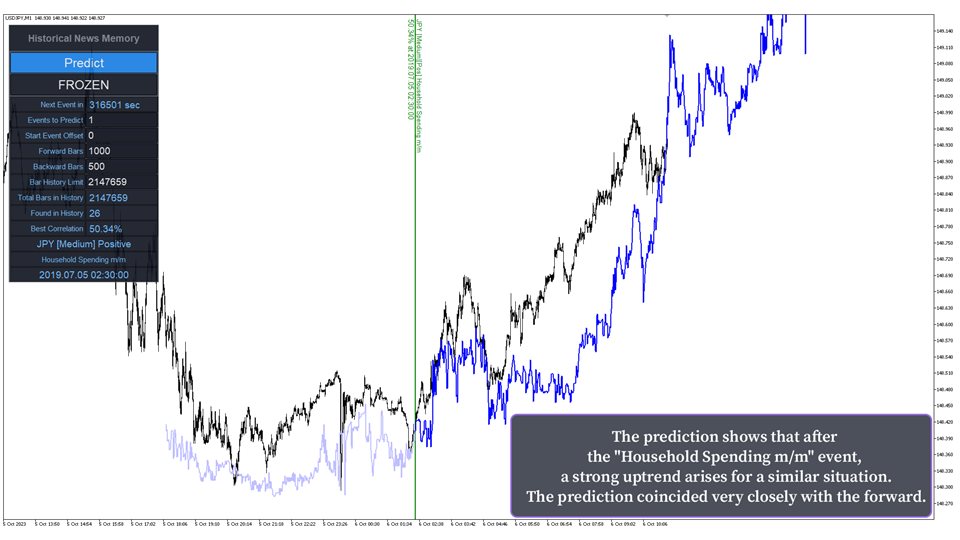
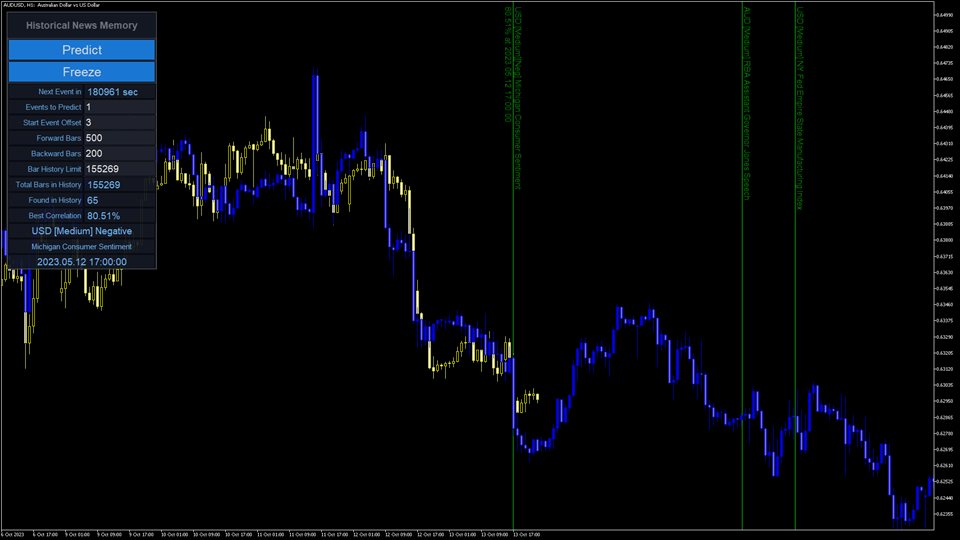
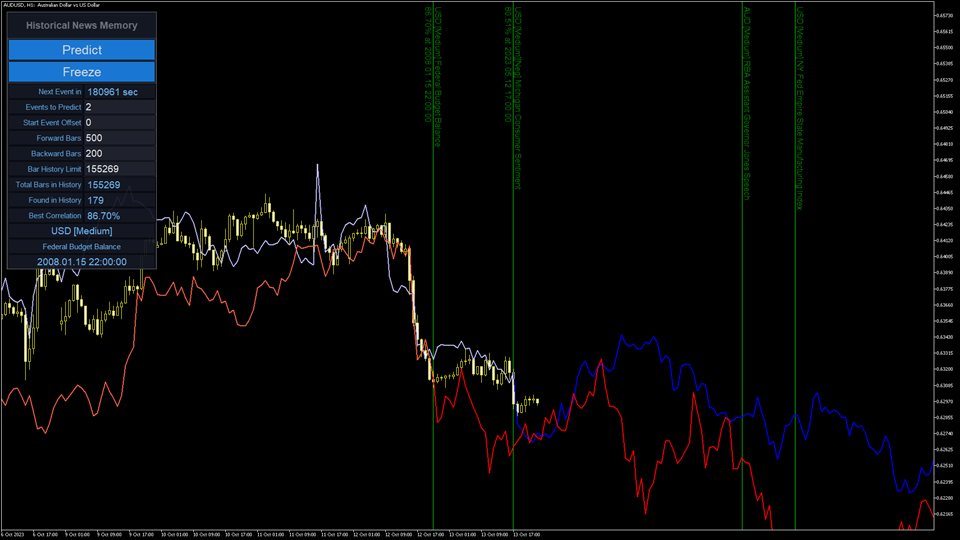
Historical News Memory
- 지표
- Marat Sultanov
- 버전: 1.232
- 업데이트됨: 17 3월 2024
- 활성화: 15
Do you want to know how an economic event will impact price? What will happen to price after the news? How has an economic news affected price in the past? This indicator can help you with that.
Do you like technical analysis? Do you enjoy studying the history to predict the future? But what do you think could be more important than technical analysis, what could improve technical analysis? Of course, it's fundamental analysis! After all, economic events directly impact the market, and therefore future price movement. But how exactly do news impact price? How does each economic event affect the price of each financial instrument, on each time frame? There are a lot of different economic events and it can be difficult to understand how each one affects different financial instruments.
But what if you could look at an economic event in history and try to understand its direct impact? What if you could search for the news in the past, on a section of history where the market state is most similar to the current state and then see how the news changed price?
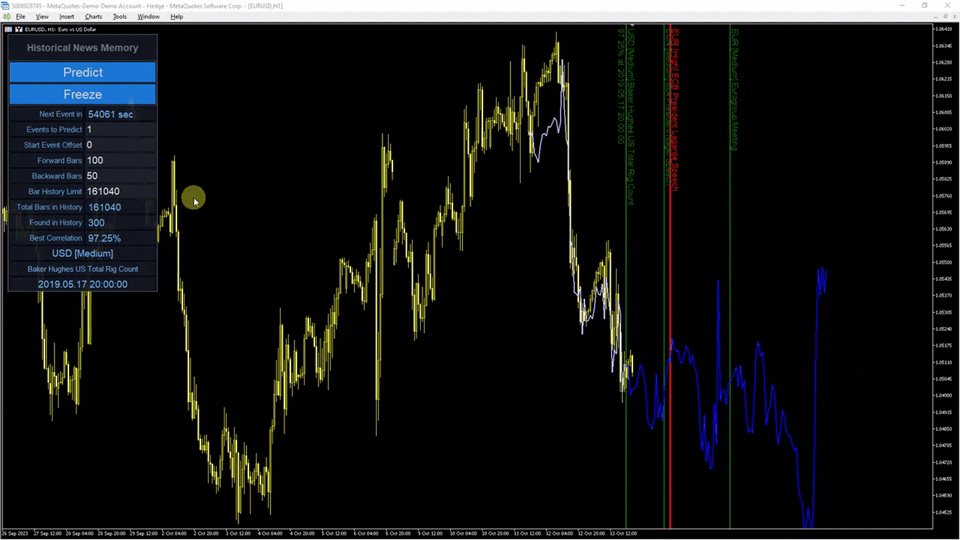
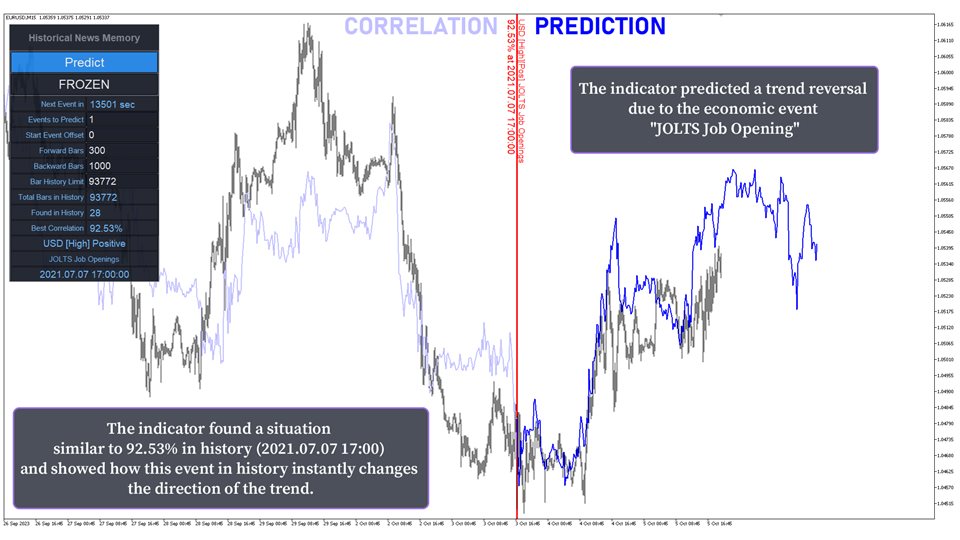
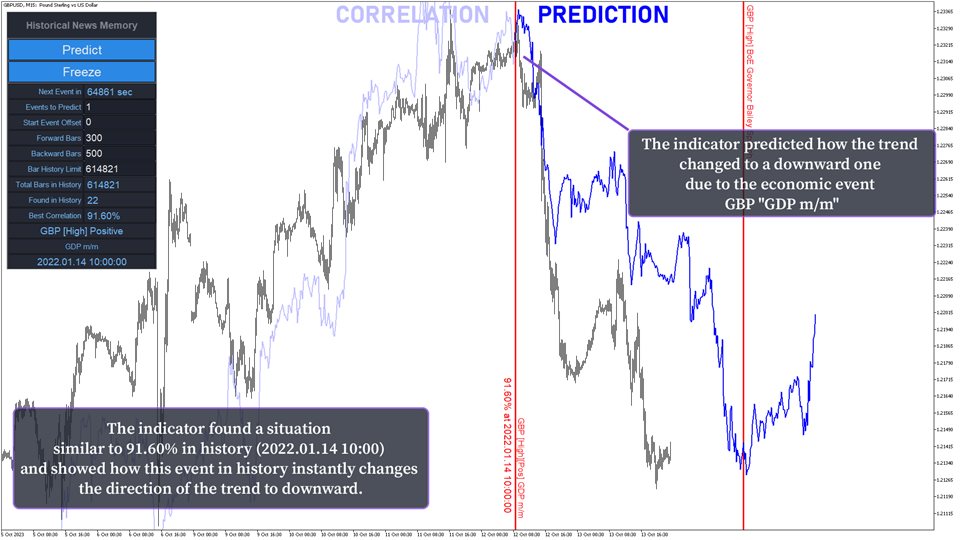
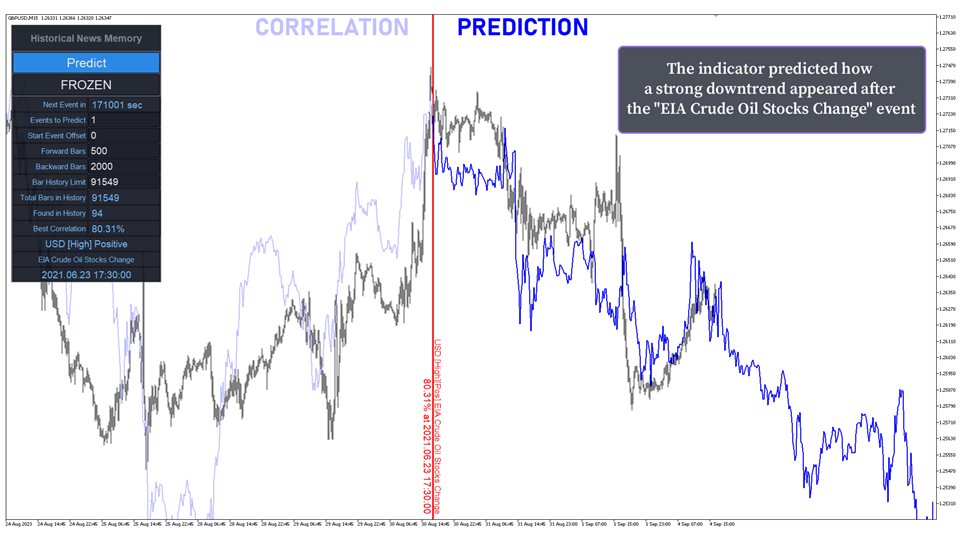
This indicator will do that, and automatically too. It will analyze the entire bar history and all historical economic events that have occurred in the past, and predict and show future market movement immediately upon the occurrence of the event.
How does it analyze? It searches for similar economic events and similar sections in history that have the highest correlation with the current market state and the current economic event. Then it makes a prediction and draws future prices immediately upon the occurrence of the news. These predicted prices show how price in history changed after the occurrence of an economic event on a section of history similar to the current one.
Advantages:
- The indicator can work in the strategy tester. It has a built-in database of economic events. And when launched on a live chart, it will automatically update its database.
- There is a graphical user interface. This simplifies and speeds up the work with the indicator.
- The indicator shows future economic events on the chart. This will help to see future events on the chart before they occur.
- There is an alert function at the occurrence of an economic event.
- Three methods of correlation calculation: Pearson, Spearman, Kendall.
Attention! When launched in the strategy tester, not all bar history may be available. At launch, only history for the past 2 years is available. Therefore, to use a deeper history in the strategy tester, you need to set the start date to the one you need, so that the indicator after launch will accumulate the depth of history you need. And in the indicator settings you will find the input parameter "Start Date (for Strategy Tester)" - this is the date from which the indicator starts working, before this date the indicator does not work, but only accumulates bar history.
Settings:
- Start Date (for Strategy Tester) - used only in the strategy tester. This is the date from which the indicator starts working. Before this date, the indicator does not work, but only accumulates bar history. This is needed to accumulate enough bar history.
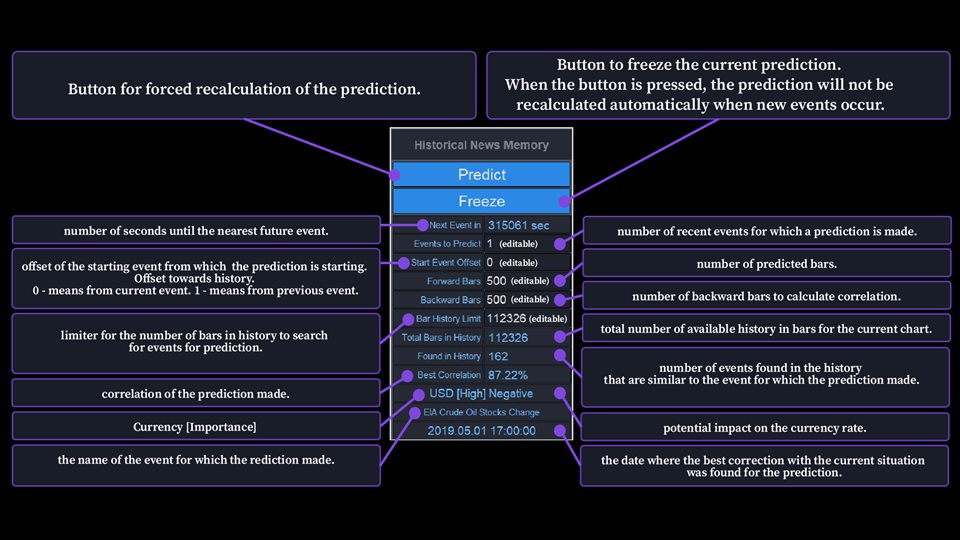
- Events to Predict [1...5] - the number of recent events to predict. Values from 1 to 5.
- Start Event Offset [0...) - the offset of the initial event from which the prediction starts. The offset is in the direction of history. 0 means to make a prediction from the current event. 1 means to make a prediction from the previous event.
- Draw Type - the way to display the prediction: 'Line' - as a line, 'Candles' - as candles.
- Draw Mode - the type of prediction display.
Prediction
- Freeze - prediction freeze. True is the prediction will not be automatically recalculated when new events occur.
- Correlation Method - the formula for calculating the correlation coefficient: Pearson, Spearman, Kendall.
- Correlation Filter in % (0 is OFF) [0...100] - the correlation filter in percent. If the found correlation of the prediction is below this value, then the prediction is not displayed. At 0, the function is not used.
- Forward: number of bars [1...) - the number of predicted bars.
- Backward: number of bars [1...) - the number of bars for calculating the correlation.
- Bar History Limit - the limit of the number of bars in history for searching for events for the prediction. This setting is needed if you need to analyze a limited depth of history.
Economic Events
- Show Future Events Up to (in minutes, 0 is OFF) - display future economic events that will occur not later than the specified number of minutes.
- Currencies Filter - currency filter:
- - 'Auto(current contract)' - the currencies of the current contract will be used (the currency of profit and the currency in which margin is calculated).
- - 'Manual' - the list of currencies is specified manually using the 'Currencies Filter' parameter.
- - 'OFF(use all currencies)' - do not use the filter. All currencies will be used.
- Currencies Filter (If 'Currencies Filter'=Manual) - the list of currencies (separated by commas) for the mode "Currencies Filter" = 'Manual'.
- Use Impact Low - True - use events with low importance.
- Use Impact Medium - True - use events with medium importance.
- Use Impact High - True - use events with high importance.
- Line Text Position - the position of the text display at the vertical line: Upper - top, Lower - bottom.
- Line: Text Size - the size of the text at the vertical line.
- Line(color): Impact Low - the color of the vertical line for events with low importance.
- Line(color): Impact Medium - the color of the vertical line for events with medium importance.
- Line(color): Impact High - the color of the vertical line for events with high importance.
- Line(width): Impact Low - the width of the vertical line for events with low importance.
- Line(width): Impact Medium - the width of the vertical line for events with medium importance.
- Line(width): Impact High - the width of the vertical line for events with high importance.
- Line(style): Impact Low - the style of the vertical line for events with low importance.
- Line(style): Impact Medium - the style of the vertical line for events with medium importance.
- Line(style): Impact High - the style of the vertical line for events with high importance.
Notification
- Use Chart Info - True is the chart Symbol and Time Frame will be added to the alert/notification description.
- Alerts? - True is there will be a notification of a new event in the "Alert" window when a new event occurs.
- Play Sound? - True is play a sound.
- File Name for Sound - the name of the sound file to play.
- Send To Mail? - true is when a new signal appears or signal changes, an email will be sent. (The email address can be specified in the Meta Trader settings)
- Mail Header - Specify the email title.
- Notifications? - True is when a new signal appears or signal changes, there will be a push notification.
Panel
- Use? - True is display the control panel.
- Size (in pixels) - the size of the panel in pixels.
- Position: X (in pixels) - the horizontal position (in pixels) of the panel.
- Position: Y (in pixels) - the vertical position (in pixels) of the panel.
- Transparent in % [0...100] - transparency as a percentage, where 0 is completely opaque, 100 is completely transparent.
- Background Color - the background color.
- Header Color - the color of the header.
- Border Color - the color of the border.
- Button Un Pressed Color - the color of the button not pressed.
- Button Pressed Color - the color of the pressed button.
- Button Text Color - the color of the button text.
- Button Border Color - the color of the button border.
- Settings Name Cell Color - the color of the cell with the parameter name.
- Settings Value Cell Color - the color of the cell with the parameter value.
- Settings Border Color - the color of the cell border.
- Settings Name Text Color - the color of the text of the cell with the name of the parameter.
- Settings Value Text Color - the color of the cell text with the parameter value.

