• 미리보기
  • 리뷰
  • 코멘트 (2)

Market Volume Profile Pro

Description: 

For a comprehensive understanding of our indicators, we invite you to explore the entire Q&A section within this MQL5 blog post here.

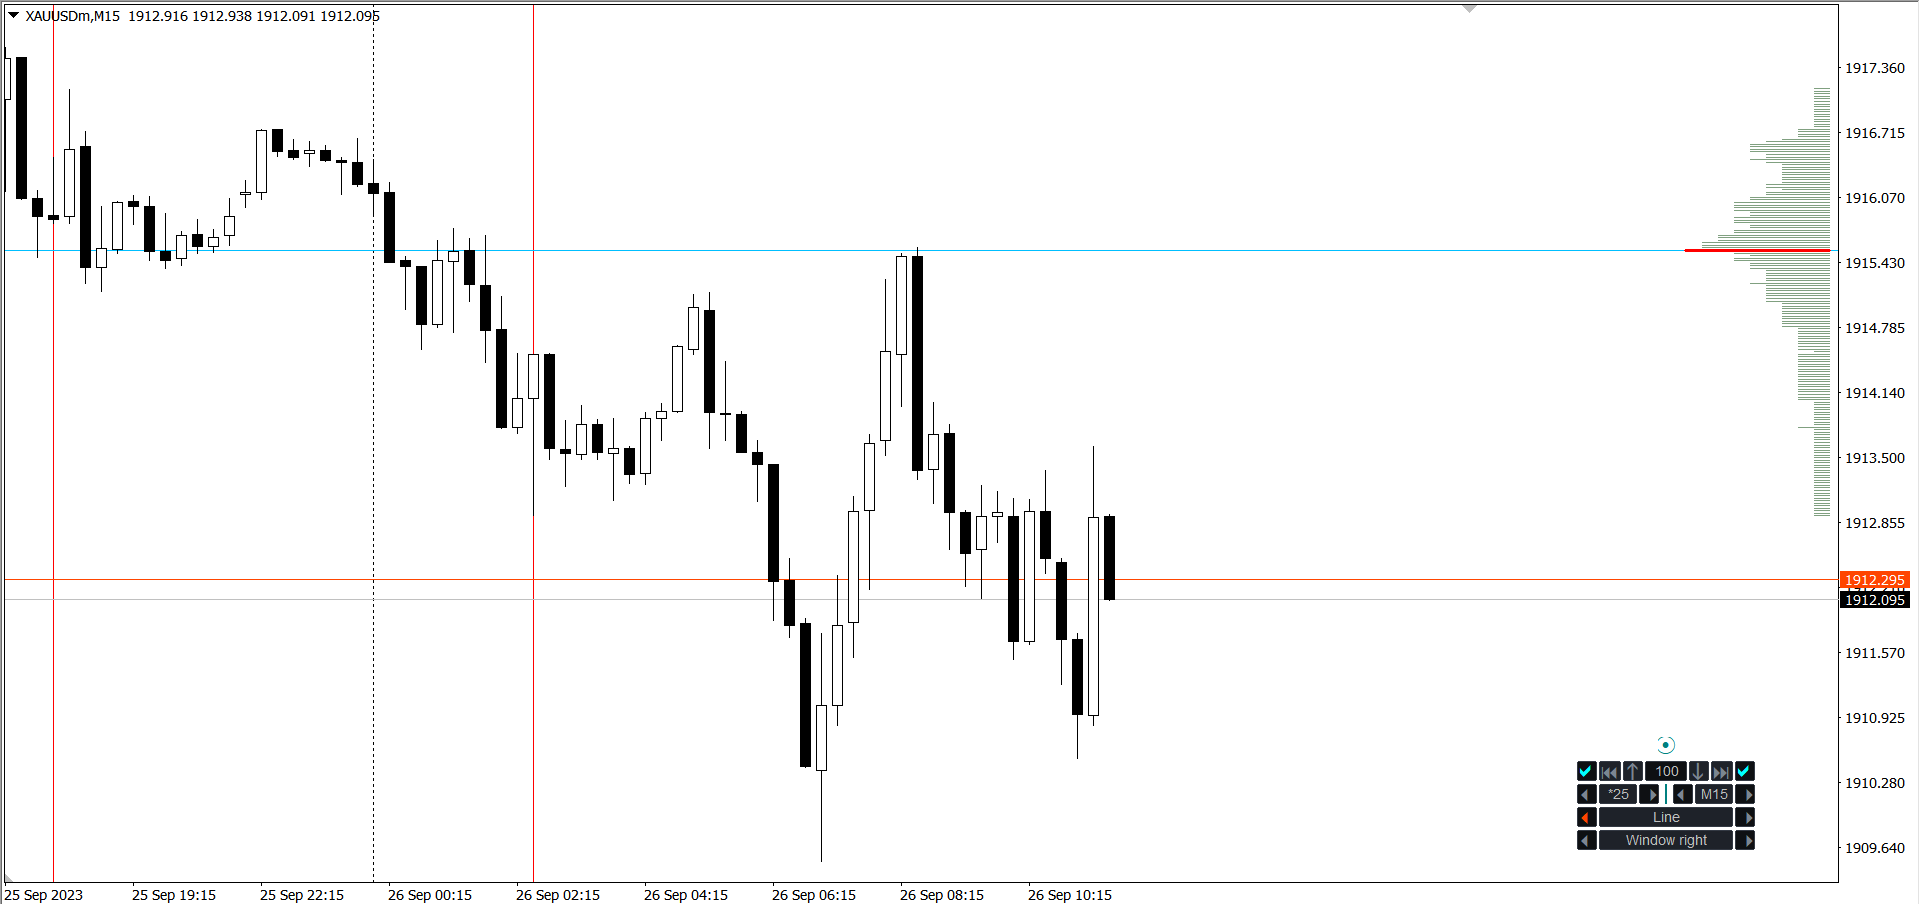
Our Market Volume Profile Indicator is an indispensable tool for traders looking to gain deep insights into market dynamics. It offers a comprehensive view of volume distribution within a given time frame, allowing traders to make informed decisions based on a clear understanding of where significant buying and selling activities occur.


Key Features:

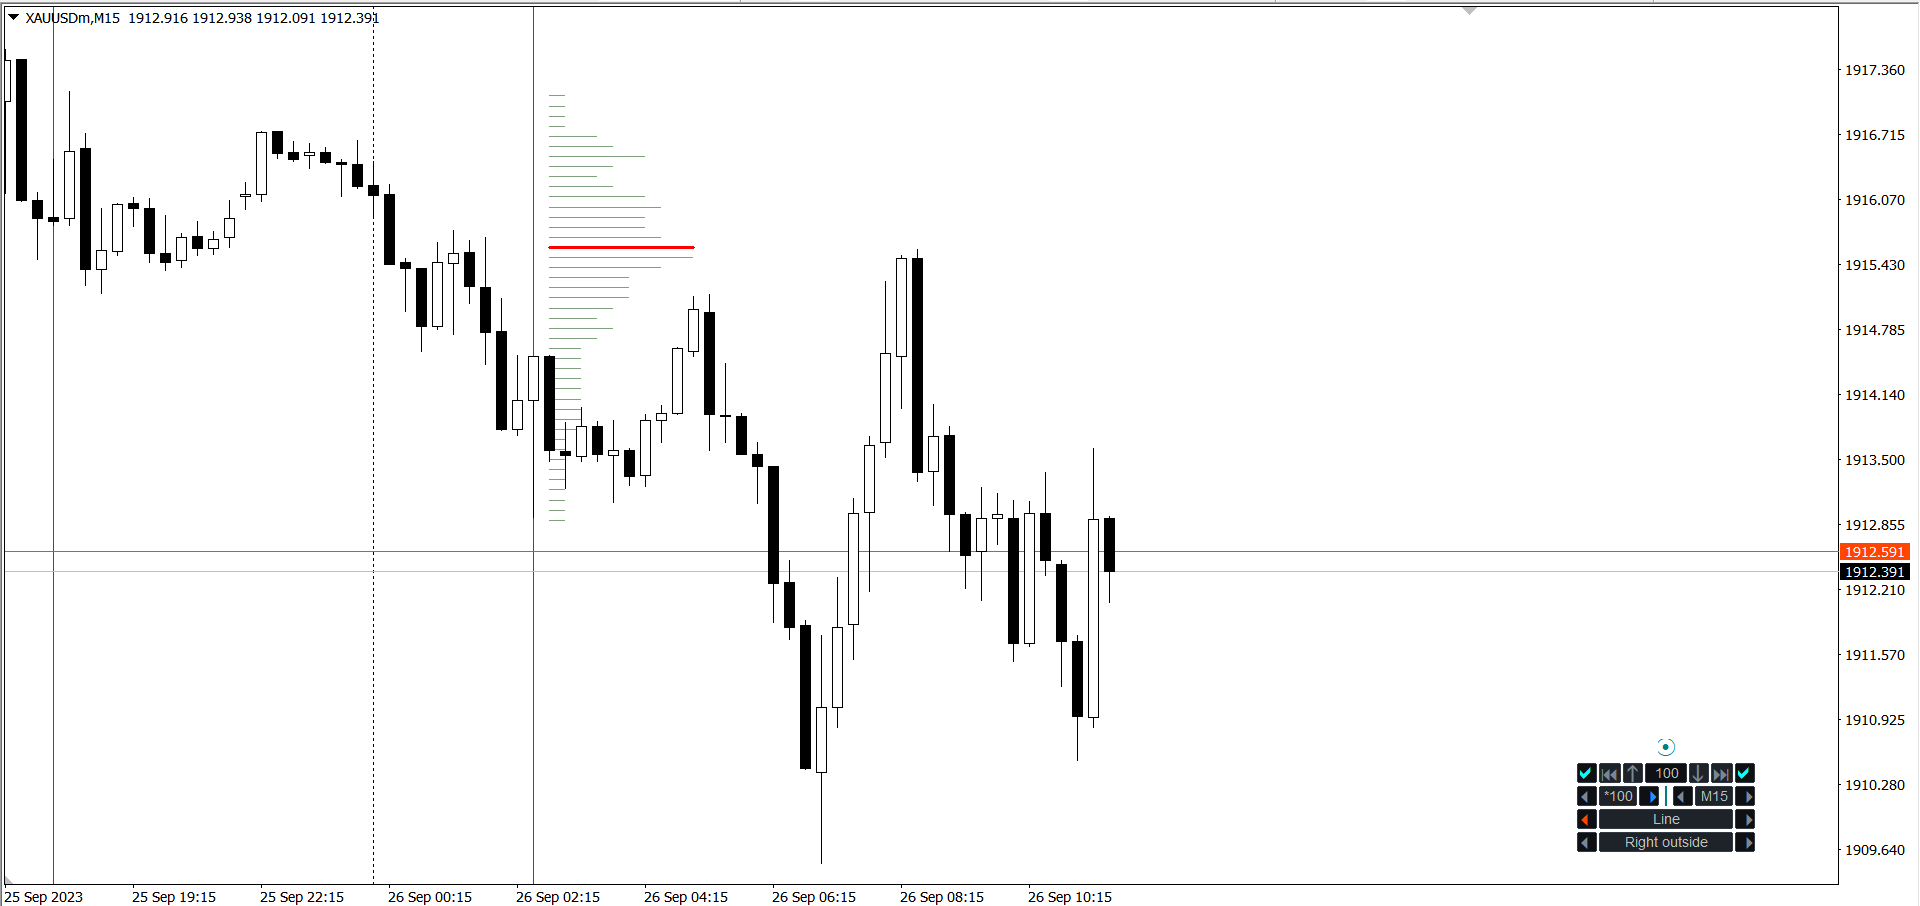
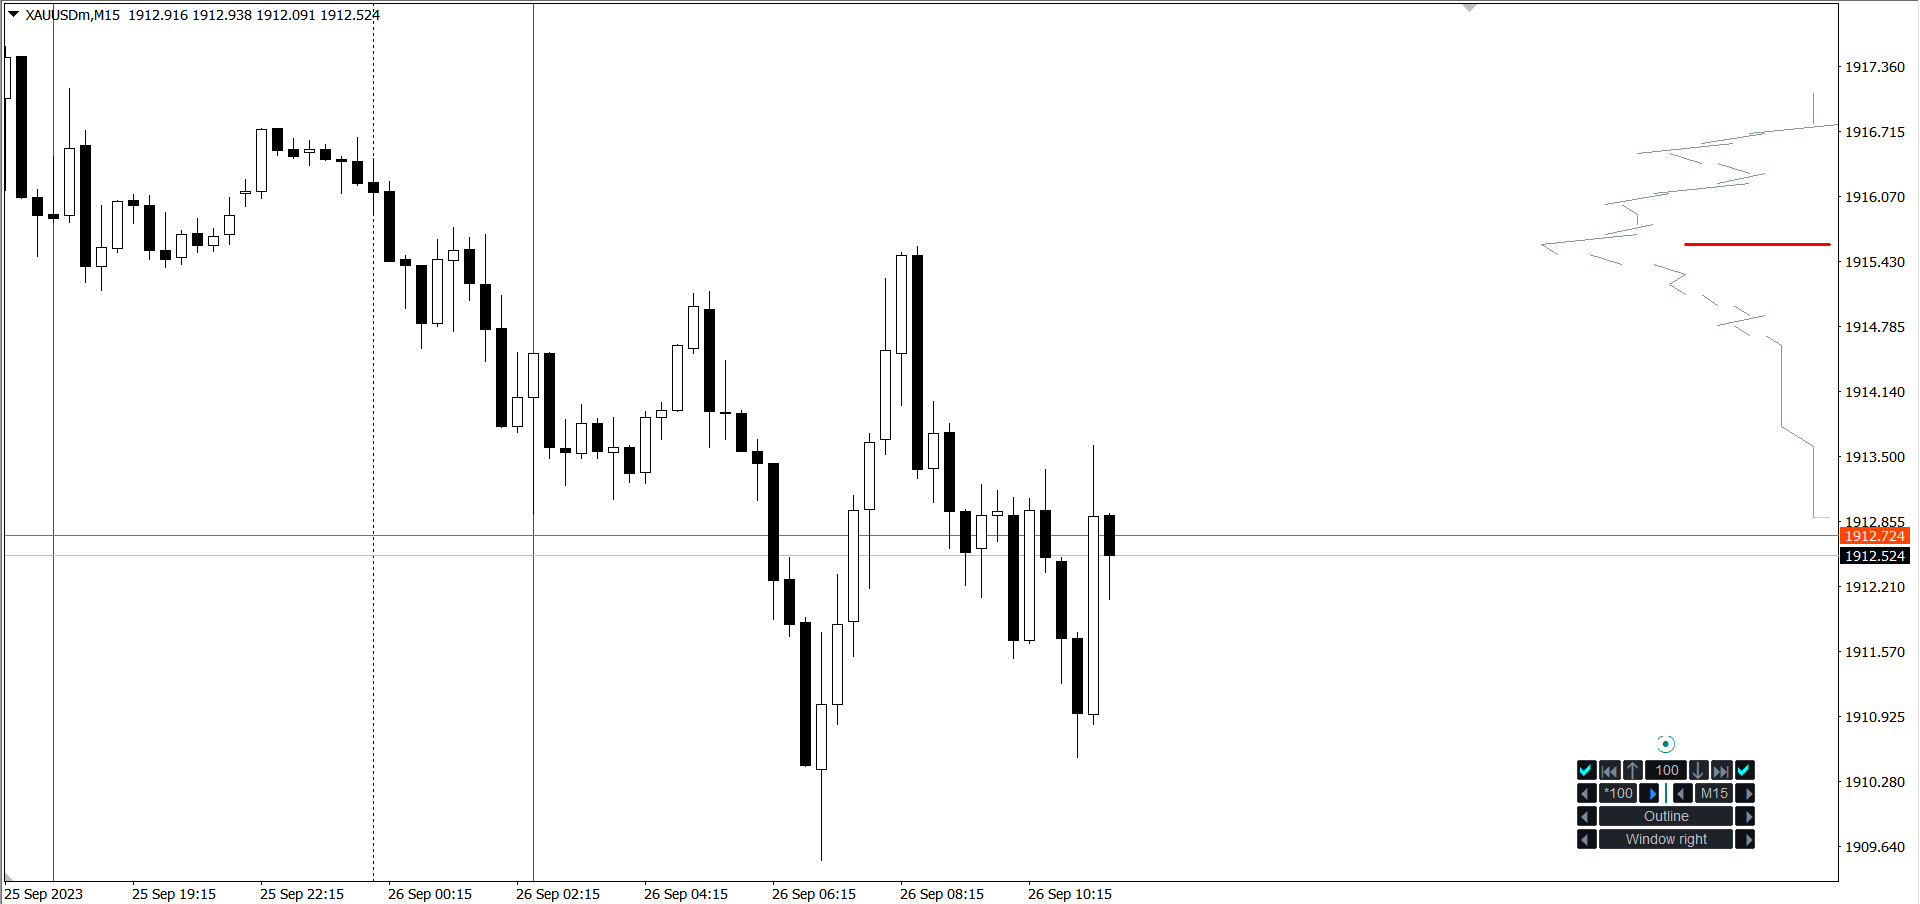
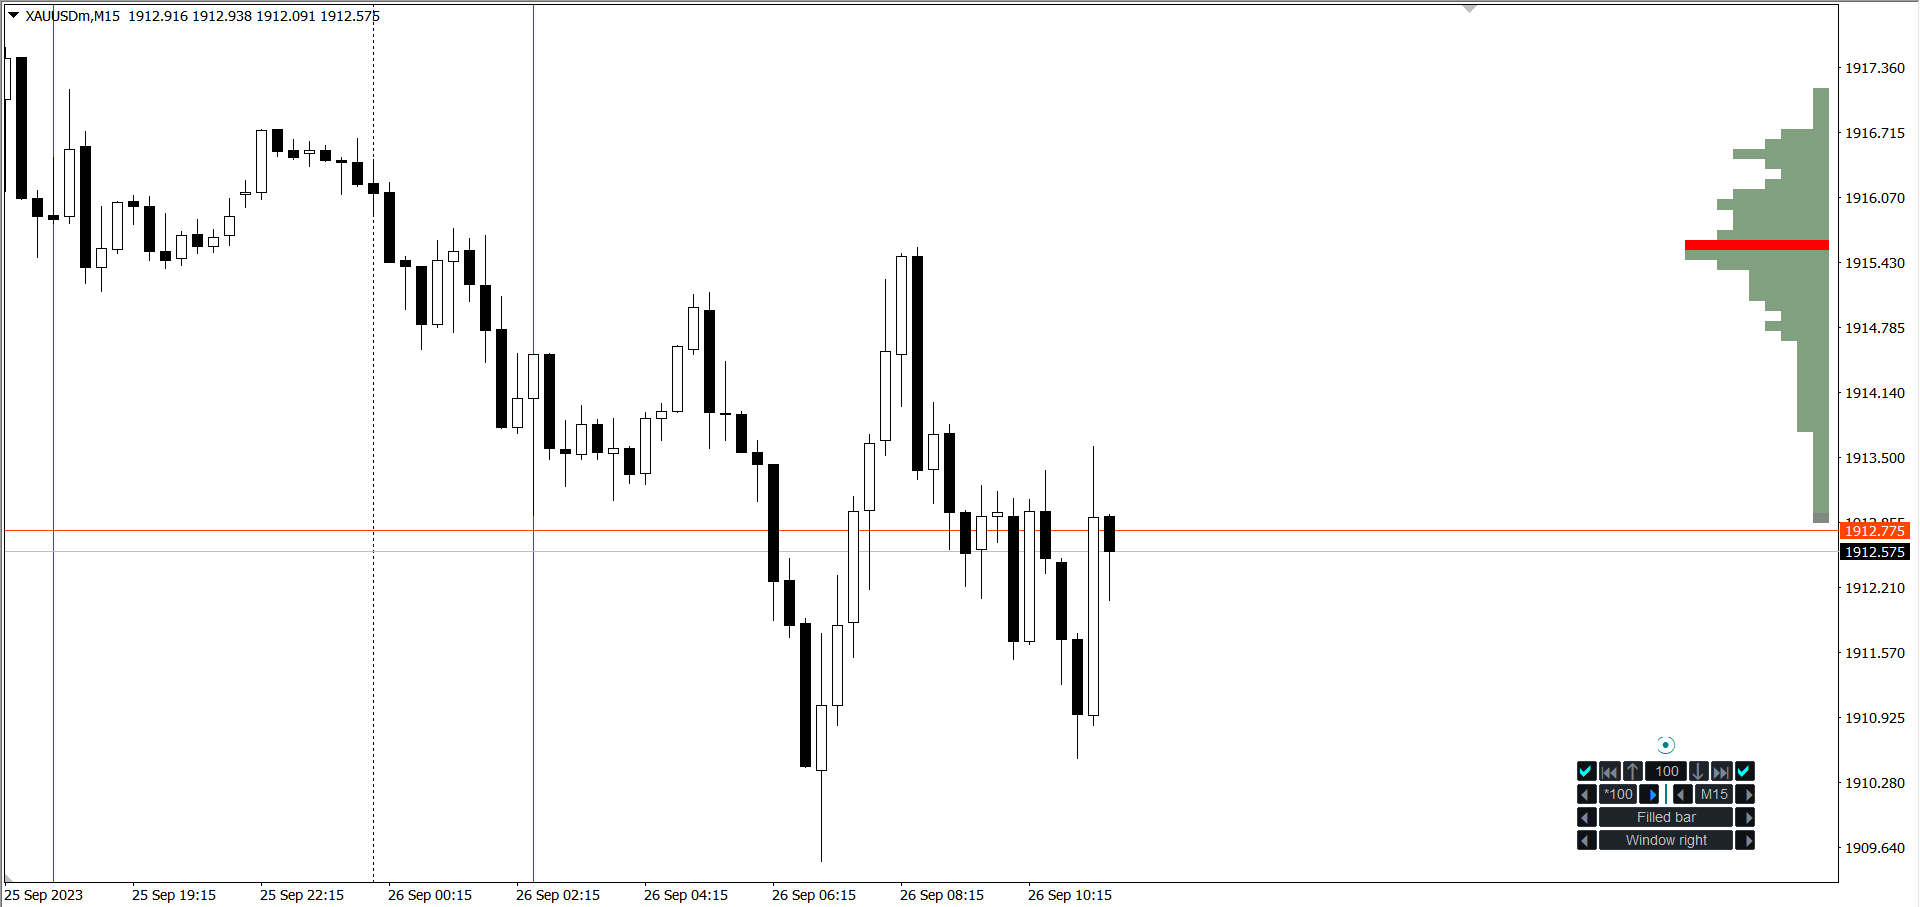
1. Volume Histogram: The indicator displays a histogram that represents the volume traded at different price levels. Traders can quickly identify price areas with the highest and lowest trading activity.


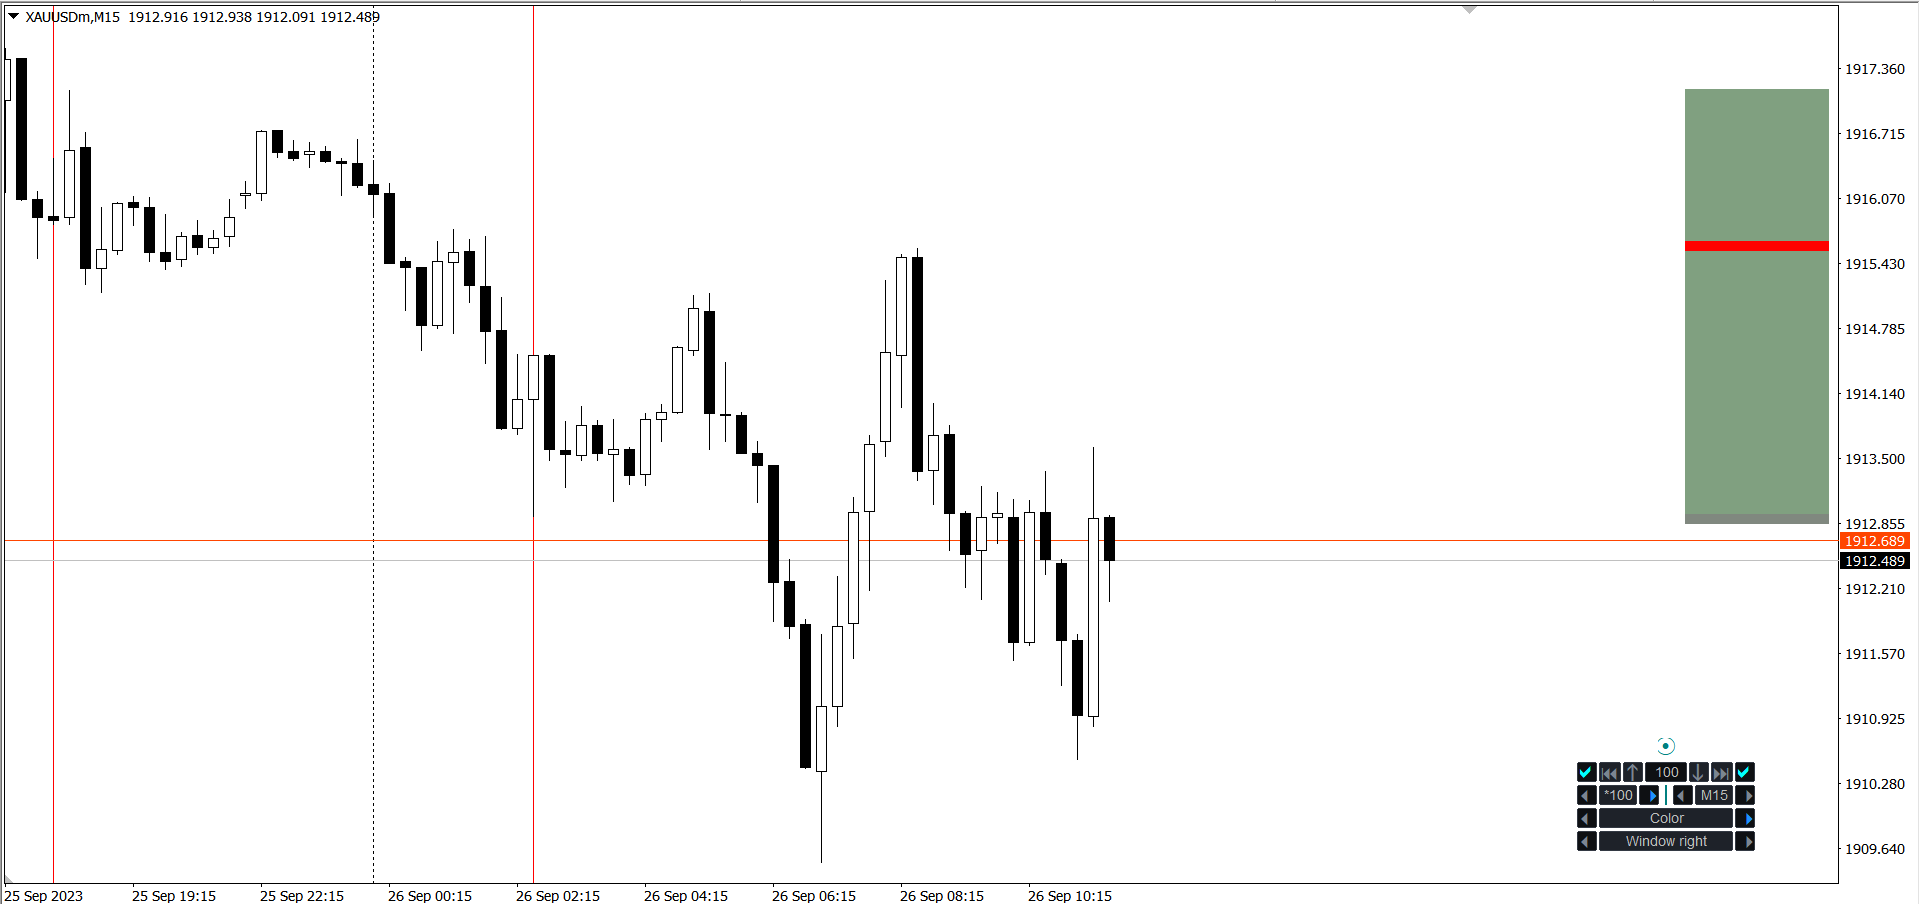
2. Point of Control (POC): POC represents the price level at which the most volume has been traded. It serves as a critical reference point for traders, indicating potential support or resistance areas.


3. Value Area: The Value Area encompasses the price range where the majority of trading activity occurred, typically covering around 70% of the total volume. Traders use this area to identify potential breakout or reversal points.


4. TPO (Time Price Opportunity) Profile: Our indicator includes TPO profiles, which show the time spent at different price levels. This data helps traders gauge the significance of price levels over time.


5. Customizable Periods: Traders can adjust the indicator to display volume profiles for various time frames, allowing for both short-term and long-term analysis.


6. Visual Clarity: The indicator provides a clear visual representation of volume profiles through color-coding and easy-to-read histograms.


7. Multiple Chart Compatibility: It is compatible with both MT4 and MT5 platforms, making it accessible to a wide range of traders.


8. User-Friendly Interface: Our Market Volume Profile Indicator boasts a user-friendly interface, ensuring that traders of all levels can effectively utilize its features.


How It Benefits Traders:

- Enhanced Decision-Making: Traders can identify areas of high and low liquidity, aiding in trade entry and exit decisions.

- Support and Resistance: The POC and Value Area assist in identifying crucial support and resistance levels.

- Intraday Analysis: Short-term traders can use the indicator to pinpoint intraday trading opportunities.

- Swing Trading: Swing traders benefit from insights into longer-term volume distribution.


Whether you are a day trader, swing trader, or investor, our Market Volume Profile Indicator equips you with a vital tool to better understand market sentiment and make well-informed trading choices. It's your gateway to a deeper comprehension of market structure and a competitive edge in the trading world.


추천 제품
The indicator displays the usual Moving Average with input parameters: maPeriod_1; maMethod_1; maAppPrice_1. Then it calculates and displays MA on MA1 with input parameters: maPeriod_2; maMethod_2. Then it calculates and displays MA on MA2 with input parameters: maPeriod_3; maMethod_3. If AlertsEnabled = true the Indicator will show the Alert (message window) with a text like this: "Price going Down on ", Symbol(), " - ", Period(), " min", " price = ", Bid; If eMailEnabled = true the Indicator w
Crypto_Forex 지표 HTF MACD 오실레이터 for MT4. - HTF는 - 더 높은 시간 프레임을 의미합니다. - MACD 지표 자체는 트렌드 트레이딩에 가장 인기 있는 지표 중 하나입니다. - 이 지표는 가격 액션 항목이 있는 다중 시간 프레임 트레이딩 시스템이나 다른 지표와 조합하는 데 탁월합니다. - HTF MACD 지표를 사용하면 더 높은 시간 프레임의 MACD를 현재 차트에 첨부할 수 있습니다 --> 이는 전문적인 트레이딩 접근 방식입니다. - 지표에는 모바일 및 PC 알림이 내장되어 있습니다. // 훌륭한 트레이딩 로봇과 지표는 여기에서 제공됩니다: https://www.mql5.com/en/users/def1380/seller 이 MQL5 웹사이트에서만 제공되는 오리지널 제품입니다.
This indicator includes: Currency Strength Meter My currency strength meter gives you a quick visual guide to which currencies are currently strong, and which ones are weak. The meter measures the strength of all forex cross pairs and applies calculations on them to determine the overall strength for each individual currency. Live Heat Map — Multiple time frame Heat Map makes it easy to spot strong and weak currencies in real-time. Get an overview of how world currencies are traded against each
Analytic System
Pavel Krysanov
Индикатор Analytic System - это полноценная торговая система. Он состоит из 2 частей: Первая - это стрелочки, показывающие наиболее оптимальные точки открытия и закрытия сделок. Стрелка вверх - сигнал на покупку,стрелка вниз - на продажу. Индикатор использует сложные аналитические алгоритмы, при помощи которых система определяет моменты входов и выходов. Вторая - это информационная панель в правом верхнем углу. Крупным шрифтом обозначена цена, справа от неё показано текущее направление тренда (в
SX Currency Strength indicator allows users to analyze currency strength through a selected period, with results resetting periodically and accumulating thereafter. It displays the historical relative strength of eight major currencies (USD, EUR, GBP, JPY, AUD, CHF, CAD and NZD) across a selected timeframe. Assessing a currency's relative strength aids in evaluating its performance against a basket of other currencies. Users can select to visualize relative strength of the currencies in the shap
ABC Trend Levels
Oleksandr Novosiadlyi
Description ABC Trend Levels is an indicator that identifies market trends and important trend support and resistance levels. Recommendations You can use this indicator to determine the trend and, accordingly, to determine the direction of opening a position or closing an opposite position. Parameters ===== _INDICATOR_SETTINGS_ ===== - indicator settings Maximum History Bars - maximum number of history bars for calculating the indicator. Average True Range Period - ATR indicator period (us
With the MACD Multi Time Frame indicator you can spot divergences of higher timeframes while you are searching for pinpointed entries on lower timeframes. This blog post gives you real-time MACD Divergence Analysis for free and tips how to trade the divergences: Real-Time MACD Divergence Analysis The MACD Multi Time Frame gives you an very good overview of what is happening on higher timeframes without the need of switching to the higher timeframe. You will e.g. always see the MACD value of the
R Silver Trend 지표는 Metatrader 4 활동 차트에 직접 현재 추세를 표시하는 추세 추종 거래 지표입니다. 두 가지 유형의 양초를 그립니다. 파란색은 강세 가격 조치입니다. 약세 가격 움직임을 나타내는 빨간색. R Silver Trend 지표로 거래하는 것은 절대 초보자도 매우 쉽고 스캘핑(M1, M5), 일일 거래(M5, M15, M30) 및 스윙 거래(H1, H4, D1) 통화에 사용할 수 있습니다. 기본 거래 신호 R Silver Trend 표시기 신호는 해석하기 쉽고 다음과 같이 표시됩니다. 매수 신호: 인디케이터가 차트에 파란색 양초를 그릴 때 매수 포지션을 엽니다. 매도 신호: 지표가 차트에 빨간 양초를 그리면 매도 포지션을 엽니다. 거래 청산: 반대 신호가 나타나면 열린 거래를 청산하거나 자신의 거래 청산 방법을 사용하십시오. 팁 R Silver Trend 지표로 하락 및 매도 전략을 거래하려면 차트에 장기 추세 추종 지표를 추가하고 더
推荐这款分时均线指标程序!它在主窗口直观展示实时价格与 30 分钟、60 分钟、120 分钟均线,助您精准把握日内趋势。参数可灵活调整,支持多种均线类型,适配不同交易风格。代码优化高效,避免重复计算,运行流畅。清晰的多色线条与标签设计,让价格与均线的关系一目了然,助力您快速捕捉交易信号。简洁实用的设计,是日内交易者分析行情的得力工具,值得一试。配合MACD及HAM买卖提示能对交易有质的提升。 1. 指标显示设置 借助   #property   指令对指标的显示属性加以设置: #property indicator_chart_window :保证指标在交易图表的主窗口显示。 #property indicator_buffers 4 :设定指标运用 4 个数据缓冲区,分别用来存储实时价格以及 3 种不同周期的均线数据。 #property indicator_colorX :为不同的线条设定颜色,例如价格线是蓝色,30 分钟均线是红色,60 分钟均线是绿色,120 分钟均线是紫色。 2. 输入参数设置 提供了几个可调节的输入参数,用户能够依据自身需求进行修改: MAPeriod1 、
Nasdaq 11
Sami Saydam
New update: 13th of September 2024 It is very simple automated trader working on most instruments in Forex MT4 platform. It is a combination between Sami Saydam invented indicator   https://www.mql5.com/en/market/product/87142  and other known indicators. It is running this signal since 4th September 2024:  https://www.mql5.com/en/signals/2257651  You can always watching it live.  This EA copyrighted in 2010 under the number 316009 for the owner Sami Saydam and with any MT4 indicator with specia
Let us introduce you to a new era of neural indicators for financial markets! Intelligent Moving is a unique indicator that trains its neural network in real time! You no longer need to look for the optimal indicator parameters for each specific situation. No more late signals. The artificial intelligence is able to adapt itself and predict any market movements. Visually, the indicator is drawn as a main solid moving average line, two dotted lines of standard deviations and signal arrows. For
RSI / TDI 알림 대시보드를 사용하면 거래하는 모든 주요 쌍에서 RSI를 한 번에(귀하가 선택 가능) 모니터링할 수 있습니다. 두 가지 방법으로 사용할 수 있습니다. 1. 여러 시간 프레임을 선택하면 일반적인 거래 조건을 넘어 확장된 여러 시간 프레임이 있을 때 대시가 표시됩니다. 가격이 여러 기간에 걸쳐 과매수 또는 과매도 수준에 도달하여 최근에 가격이 크게 밀리고 있으므로 곧 철회 또는 반전이 예정되어 있음을 나타내는 훌륭한 지표입니다. 2. 하나의 기간(당신이 가장 선호하는 거래)과 여러 RSI 수준을 사용하여 해당 기간에 RSI 확장의 강도를 보여줍니다. 이것은 가격이 너무 오랫동안 한 방향으로 매우 세게 밀렸고 시장이 차익실현을 해야 할 때 평균 회귀 거래를 취하기 위한 훌륭한 전략입니다. 예시 스크린샷에서 H4 RSI가 25레벨을 넘어 2쌍으로 확장된 것을 볼 수 있습니다. 이는 일반적인 가격 조치보다 훨씬 더 멀리 있기 때문에 매수할 좋은 기회입니다. 대
Naked Forex Big Shadow IndicatorBig Shadow Indicator is a pattern recognition indicator for Forex, Stocks, Indices, Futures, Commodities and Cryptos. When you have a Big Shadow on your chart then this is a strong signal meaning that you might be ahead of a reversal. You can take other elements (momentum, trend, volatility, price action, fundamentals) to build a complete strategy and confirm your entries. Beware that you might not make money just following the arrows generated by the pattern reco
SRP Pro
Farhad Kia
5 (1)
Strong Retracement Points Pro edition! SRP (Strong Retracement/Reversal Points) is a powerful and unique support and resistance indicator. It displays the closest important levels which we expect the price retracement/reversal! If all level are broken from one side, it recalculates and draws new support and resistance levels, so the levels might be valid for several days depending on the market! If you are still hesitating to start using this wonderful tool, you can check this link to see how ef
FW 2WPR MTF
Sergey Zhukov
Indicator based trading according to the price analysis of bars, the most popular among traders. The indicators calculated based on larger periods are used for identification of a stable trend on the market, and the ones calculated based on smaller periods are used for entering the market after a correction. The oscillators with overbought and oversold levels have a special place in indicator-based trading. The values of such indicators are subjected to wave structure - the higher waves (chart t
This is a strategy builder indicator. It consists of almost all the technical indicators. Include notification and Buy/Sell arrows, Automatic Support and Resistance, and Sideways Detection (MT5 version does not include Sideways Detection and only one type of Support and Resistance).  The indicator includes: MACD (Moving Average Convergence Divergence) RSI (Relative Strength Index) Stochastic CCI (Commodity Channel Index) ADX (Average Directional Moving Index) PSAR (Parabolic Stop and Reverse)
Currency Strength Meter 1:Correctly identifying trends in foreign exchange investments is critical. 2:TrendSymbolOneClick quickly detects and displays trends that have just begun and those that have already been in place for an extended period of time. 3:There is also a USD JPY EUR GBP AUD NZD strength function. 4:Volatility allows you to know exactly when there is a major market move. 5:You can save time in your market analysis by using Trend Symbol One Click. 6:Analysis available from 1 minut
ZigZag Global
Igor Semyonov
Description A colored universal multicurrency/multi-symbol indicator ZigZag to be drawn in a separate window below the main financial instrument. The indicator may be used with any broker, irrespective of the name of the financial instrument since it is necessary to manually enter the name as an input parameter. If you enter a non-existent or incorrect name of a financial instrument, you will receive an error message that this financial instrument is unknown (does not exist).  The indicator can
Comfortable MACD
Anton Iudakov
4.75 (4)
Trading with the help of the MACD indicator has become even more convenient. Flexible settings will help you choose what you really need in your trading. Use the strategy that you need - the indicator uses 3 strategies. Download the demo right now! I recommend watching my advisor - Night Zen EA Subscribe to my telegram channel, link in my profile contacts -   my profile See also my other products on mql5.com -   my products Advantages of the indicator: In this indicator, the interpretation of th
FREE
Crit
Yvan Musatov
The Crit indicator analyzes price behavior and, if there is a temporary weakness in the trend, you can notice this from the indicator readings, as in the case of a pronounced change in trend direction. Entering the market is not difficult, but staying in it is much more difficult. With the Crit indicator, staying on trend will become much easier! This indicator allows you to analyze historical data and, based on it, display instructions for further actions on the trader’s screen. A arrow techn
Pair Power Matrix
Ziheng Zhuang
3.67 (3)
This indicator is designed to show the pair power of the major 28 paris with RSI,Stochostic,and CCI. The power value is sorted from the weak to the strong. The weaker pairs: the pairs occurs at least 2 times in the top 3 rows The stronger pairs:   the pairs occurs at least 2 times in the bottom 3 rows Users can add another symbol, so it can calculate 28+1 symbols. My advice: https://www.mql5.com/en/blogs/post/729880 A free EA with Pair Power Matrix  ---  https://www.mql5.com/en/blogs/post/7328
Smart Help
Pavel Krysanov
5 (2)
The 'Smart Help' indicator is an excellent assistant for beginners and experienced traders. It consists of 3 parts: The first part provides entry and exit signals in the form of arrows. The up arrow is a signal of an uptrend, the down arrow indicates a downward trend. The second part shows the direction and strength of the current trend. The third part provides information on the currency pair state. The current price is indicated at the top. Below it are: the daily Low and High, the point dista
DisconnectionSaver
Vladimir Liubchenko
This specific indicator is designed to solve one specific problem : In case the connection to the broker's server is lost, remember when the connection was lost, and at what time the connection was resumed. Thus, the user sees the time when there was no connection to the broker's server . An Alert box is displayed on the screen, which records when the connection was lost and resumed. Of course, the indicator will not react to slight losses of packets. For better visualization of the indicator op
Market Heartbeat
Reza Aghajanpour
5 (9)
Market Heartbeat in your hand! Introduction The Market Heartbeat indicator with a special enhanced algorithm (volume, money flow, cycle of market and a secret value) is a very repetitive trend finder with a high success rate . Interestingly, this Winner indicator indicates that the trend has changed its direction or the end of a trend retracement or even appears at the range market. The Market Heartbeat can use in scalping trading or trend trading. It finds immediately with alarm, notification a
Colored candles
Alexander Nikolaev
Some candles have a strong tendency to continue the movement or to revert it. With the help of the Colored candles indicator such movements are clearly visible. This indicator calculates the parameters of each candle, as well as its volume, and after that it paints the candles depending on its strength and direction. Bullish candles are colored green and bearish candles - red. The greater the power of the bulls or the bears, the brighter the color. You can change the colors if you want. The indi
GGP Wave Trend Oscillator MT4
Mohammadmahmood Pirayeh
The GGP Wave Trend Oscillator MT4   Indicator is a volatility and momentum tool designed to help traders optimize their trading performance and providing traders find the most accurate market reversals. This indicator is MT4 conversion of the Indicator: WaveTrend Oscillator [WT] by “ LazyBear “ in Trading View website and some alert methods are added to provide real-time alerts when a trading signal is generated, in order to allow traders to act quickly and efficiently. When the oscillator is ab
Breakout Impulse indicator for MT4
Renaud Herve Francois Candel
Breakout Impulse IndicatorBreakout Impulse Indicator is a pattern recognition indicator for Forex, Stocks, Indices, Futures, Commodities and Cryptos. The Breakout Impulse is a multi-bar pattern. The purpose of the pattern is to identify a fast change in momentum. This type of change can announce the start of a big directional move. Inputs of the indicator are: Distance: distance in pixel relative to top or bottom of candle to display the arrow symbol MaxBars: number of bars back used to calcula
The Supernatural channel is determined using a special algorithm, marker points are used to determine the movement of the channel. The Supernatural channel consists of two lines, red and blue, that make up the channel. Simple, visual and efficient use. Can be used for intra-channel trading. The indicator does not redraw and does not lag. Works on all currency pairs and on all timeframes.
Description Trend Influencer is an indicator that determines the potential dynamics of the influence of trend wave movements on the market. The indicator is based on the value of moving averages corrected by the standard deviation. The indicator is displayed as a main dash-dotted moving average and a signal solid moving average. The signal moving average is colored blue or red depending on what type of trend is currently observed in the market. The indicator also draws inhibition levels - blue a
Signal Strength Meter
Naim El Hajj
4 (5)
The Signal Strength Meter is a Multi-Currency, Dual Timeframe Interactive Indicator, which calculates the strength of buy and sell signals, and displays a score for each symbol on a display board. Get a 7-Day Free Trial Version:  Click  Here  (Full Access to The Indicator for 7 Days) Check Video Below For Complete Demonstration, and User Manual here . Key Features: Allows you to see multiple currency signals from one chart Analyses the signals from more than a dozen classic indicators Identif
이 제품의 구매자들이 또한 구매함
Gann Made Easy
Oleg Rodin
4.8 (116)
Gann Made Easy 는 mr.의 이론을 사용하여 최고의 거래 원칙을 기반으로 하는 전문적이고 사용하기 쉬운 Forex 거래 시스템입니다. W.D. 간. 이 표시기는 Stop Loss 및 Take Profit Levels를 포함하여 정확한 BUY 및 SELL 신호를 제공합니다. PUSH 알림을 사용하여 이동 중에도 거래할 수 있습니다. 구매 후 연락주세요! 내 거래 팁과 훌륭한 보너스 지표를 무료로 공유하겠습니다! 아마도 Gann 거래 방법에 대해 이미 여러 번 들었을 것입니다. 일반적으로 Gann의 이론은 초보자 거래자뿐만 아니라 이미 거래 경험이 있는 사람들에게도 매우 복잡한 것입니다. Gann의 거래 방식은 이론적으로 적용하기 쉽지 않기 때문입니다. 나는 그 지식을 연마하고 Forex 지표에 최고의 원칙을 적용하기 위해 몇 년을 보냈습니다. 표시기는 적용하기가 매우 쉽습니다. 차트에 첨부하고 간단한 거래 권장 사항을 따르기만 하면 됩니다. 지표는 지속적으로 시장 분석 작업
Gold Stuff
Vasiliy Strukov
4.86 (253)
Gold Stuff는 금을 위해 특별히 설계된 추세 지표이며 모든 금융 상품에서도 사용할 수 있습니다. 표시기가 다시 그려지지 않고 지연되지 않습니다. 권장 기간 H1. 표시기에서 완전 자동 Expert Advisor EA Gold Stuff를 작동합니다. 내 프로필에서 찾을 수 있습니다. 설정 및 개인 보너스를 받으려면 구매 후 즉시 저에게 연락하십시오!   강력한 지원 및 트렌드 스캐너 표시기의 무료 사본을 받으실 수 있습니다. 메시지를 보내주세요. 나!   설정 화살표 그리기 - 켜기 끄기. 차트에 화살표 그리기. 경고 - 가청 경고를 끕니다. 이메일 알림 - 켜기 끄기. 이메일 알림. Puch-notification - 켜기 끄기. 푸시 알림. 다음으로 색 영역을 조정합니다. Gold Stuff는 금을 위해 특별히 설계된 추세 지표이며 모든 금융 상품에서도 사용할 수 있습니다. 표시기가 다시 그려지지 않고 지연되지 않습니다. 권장 기간 H1. 표시기에서 완전 자동
Enigmera
Ivan Stefanov
5 (7)
ENIGMERA: 시장의 핵심 중요: MQL5.com의 데모는 Strategy Tester에서 실행되며 Enigmera의 기능을 완전히 반영하지 못할 수 있습니다. 설명, 스크린샷 및 비디오를 확인하여 자세한 내용을 확인하십시오. 질문이 있으면 언제든지 메시지를 보내주세요! 인디케이터의 코드는 완전히 다시 작성되었습니다. 버전 3.0은 새로운 기능을 추가하고 인디케이터가 처음 출시된 이후 누적된 버그를 수정했습니다. 소개 이 인디케이터 및 거래 시스템은 금융 시장에 대한 주목할 만한 접근 방식입니다. ENIGMERA는 프랙탈 주기를 사용하여 정확하게 지원 및 저항 수준을 계산합니다. 실제 축적 단계를 보여주고 방향과 목표를 제공합니다. 트렌드와 수정 모두에서 작동하는 시스템입니다. 작동 방식 인디케이터의 대부분의 기능은 차트 왼쪽에 있는 버튼을 통해 제어되며, 이를 통해 다양한 시장 상황에 빠르게 대응할 수 있습니다. 버튼 ON/OFF – 인디케이터 전체를 표시하거나 숨깁니다.
M1 Arrow
Oleg Rodin
5 (17)
시장의 두 가지 기본 원칙에 기반한 일중 전략. 알고리즘은 추가 필터를 사용하여 거래량 및 가격 파동 분석을 기반으로 합니다. 지표의 지능형 알고리즘은 두 가지 시장 요인이 하나로 결합될 때만 신호를 제공합니다. 지표는 더 높은 시간 프레임의 데이터를 사용하여 M1 차트에서 특정 범위의 파도를 계산합니다. 그리고 파동을 확인하기 위해 지표는 볼륨 분석을 사용합니다. 이 표시기는 준비된 거래 시스템입니다. 트레이더가 필요로 하는 모든 것은 신호를 따르는 것입니다. 또한 지표는 자신의 거래 시스템의 기초가 될 수 있습니다. 거래는 분 차트에서만 수행됩니다. 지표가 MTF 원리를 사용한다는 사실에도 불구하고 지표 알고리즘은 가능한 한 안정적입니다. 구매 후 반드시 저에게 편지를 보내주세요! 내 거래 설정 및 권장 사항을 공유하겠습니다!
Scalper Inside PRO
Alexey Minkov
4.76 (63)
!SPECIAL SALE! An exclusive indicator that utilizes an innovative algorithm to swiftly and accurately determine the market trend. The indicator automatically calculates opening, closing, and profit levels, providing detailed trading statistics. With these features, you can choose the most appropriate trading instrument for the current market conditions. Additionally, you can easily integrate your own arrow indicators into Scalper Inside Pro to quickly evaluate their statistics and profitability
탁월한 기술적 지표인 Grabber를 소개합니다. 이 도구는 즉시 사용 가능한 “올인원(All-Inclusive)” 트레이딩 전략으로 작동합니다. 하나의 코드 안에 강력한 시장 기술 분석 도구, 매매 신호(화살표), 알림 기능, 푸시 알림이 통합되어 있습니다. 이 인디케이터를 구매하신 모든 분들께는 다음의 항목이   무료로   제공됩니다: Grabber 유틸리티: 오픈 포지션을 자동으로 관리하는 도구 단계별 영상 매뉴얼: 설치, 설정, 그리고 실제 거래 방법을 안내 맞춤형 세트 파일: 인디케이터를 빠르게 자동 설정하여 최고의 성과를 낼 수 있도록 도와줍니다 다른 전략은 이제 잊어버리세요! Grabber만이 여러분을 새로운 트레이딩의 정점으로 이끌어 줄 수 있습니다. Grabber 전략의 주요 특징: 거래 시간 프레임: M5부터 H4까지 거래 가능한 자산: 어떤 자산이든 사용 가능하지만, 제가 직접 테스트한 종목들을 추천드립니다 (GBPUSD, GBPCAD, GBPCHF, AUDCAD
Dynamic Forex28 Navigator
Bernhard Schweigert
5 (5)
Dynamic Forex28 Navigator - 차세대 외환 거래 도구. 현재 49% 할인. Dynamic Forex28 Navigator는 오랫동안 인기 있는 지표의 진화형으로, 세 가지의 힘을 하나로 결합했습니다. 고급 통화 Strength28 지표(695개 리뷰) + 고급 통화 IMPULSE with ALERT(520개 리뷰) + CS28 콤보 신호(보너스). 지표에 대한 자세한 정보 https://www.mql5.com/en/blogs/post/758844 차세대 Strength 지표는 무엇을 제공합니까?  원래 지표에서 좋아했던 모든 것이 새로운 기능과 더 높은 정확도로 강화되었습니다. 주요 기능: 독점적인 통화 Strength 공식.  모든 시간대에 걸쳐 부드럽고 정확한 강도선. 추세와 정확한 진입을 식별하는 데 이상적입니다. 역동적인 시장 피보나치 수준(시장 피보나치).  이 지표에만 있는 고유한 기능. 가격 차트가 아닌 통화 강도에 피보나치가 적용됩니다.
Scalper Vault
Oleg Rodin
5 (29)
Scalper Vault 는 성공적인 스캘핑에 필요한 모든 것을 제공하는 전문 스캘핑 시스템입니다. 이 표시기는 외환 및 바이너리 옵션 거래자가 사용할 수 있는 완전한 거래 시스템입니다. 권장 시간 프레임은 M5입니다. 시스템은 추세 방향으로 정확한 화살표 신호를 제공합니다. 또한 상단 및 하단 신호와 Gann 시장 수준을 제공합니다.  이 시스템은 사용하기가 매우 쉽습니다. 원하는 시장 지역의 화살표만 따라가면 됩니다. 엑시트는 가격이 적정 수준에 도달하거나 시장의 고점 또는 저점 신호가 나타날 때 수행됩니다.  표시기는 PUSH 알림을 포함한 모든 유형의 경고를 제공합니다. 인디케이터 구매 후 연락주세요. 내 개인 거래 권장 사항과 훌륭한 보너스 지표를 무료로 공유합니다! 나는 당신에게 행복하고 유익한 거래를 기원합니다!
FX Volume
Daniel Stein
4.59 (34)
FX Volume: 브로커 시각에서 바라보는 진짜 시장 심리 간단 요약 트레이딩 접근 방식을 한층 더 향상시키고 싶으신가요? FX Volume 는 소매 트레이더와 브로커의 포지션을 실시간으로 파악할 수 있게 해 줍니다. 이는 COT 같은 지연된 보고서보다 훨씬 빠릅니다. 꾸준한 수익을 추구하는 분이든, 시장에서 더 깊은 우위를 원하시는 분이든, FX Volume 을 통해 대규모 불균형을 찾아내고, 돌파 여부를 확인하며 리스크 관리를 정교화할 수 있습니다. 지금 시작해 보세요! 실제 거래량 데이터가 의사결정을 어떻게 혁신할 수 있는지 직접 경험해 보시기 바랍니다. 1. 트레이더에게 FX Volume이 매우 유익한 이유 탁월한 정확도를 지닌 조기 경보 신호 • 다른 사람들보다 훨씬 앞서, 각 통화쌍을 매수·매도하는 트레이더 수를 거의 실시간으로 파악할 수 있습니다. • FX Volume 은 여러 리테일 브로커에서 추출한 실제 거래량 데이터를 종합해 명확하고 편리한 형태로 제공하는
Trend Screener
STE S.S.COMPANY
4.78 (93)
트렌드 표시기, 트렌드 트레이딩 및 필터링을 위한 획기적인 고유 솔루션, 하나의 도구 안에 내장된 모든 중요한 트렌드 기능! Forex, 상품, 암호 화폐, 지수 및 주식과 같은 모든 기호/도구에 사용할 수 있는 100% 다시 칠하지 않는 다중 시간 프레임 및 다중 통화 표시기입니다. 기간 한정 특가: 지원 및 저항 스크리너 지표는 단 100달러에 평생 제공됩니다. (원래 가격 50 달러) (제안 연장) Trend Screener는 차트에 점이 있는 화살표 추세 신호를 제공하는 효율적인 지표 추세 추종 지표입니다. 추세 분석기 표시기에서 사용할 수 있는 기능: 1. 트렌드 스캐너. 2. 최대 이익 분석이 있는 추세선. 3. 추세 통화 강도 측정기. 4. 경고가 있는 추세 반전 점. 5. 경고가 있는 강력한 추세 점. 6. 추세 화살표 Trend Screener Indicator가 있는 일일 분석 예, 일일 신호 성능...등은 여기에서 찾을 수 있습니다.   여기를 클릭하십시오. L
Golden Trend Indicator
Noha Mohamed Fathy Younes Badr
4.9 (10)
Golden Trend indicator  is The best indicator for predicting trend movement this indicator never lags and never repaints and never back paints    and give  arrow buy and sell    before the candle appear  and it will help you and  will make your trading decisions clearer its work on all currencies and  gold and crypto and all time frame This unique  indicator uses very secret algorithms to catch the  trends, so you can trade using this indicator and see the trend clear on charts  manual guide and
FX Power MT4 NG
Daniel Stein
4.94 (18)
FX Power: 통화 강세 분석으로 더 스마트한 거래 결정을 개요 FX Power 는 어떤 시장 상황에서도 주요 통화와 금의 실제 강세를 이해하기 위한 필수 도구입니다. 강한 통화를 매수하고 약한 통화를 매도함으로써 FX Power 는 거래 결정을 단순화하고 높은 확률의 기회를 발견합니다. 트렌드를 따르거나 극단적인 델타 값을 사용해 반전을 예측하고자 한다면, 이 도구는 귀하의 거래 스타일에 완벽히 적응합니다. 단순히 거래하지 말고, FX Power 로 더 스마트하게 거래하세요. 1. FX Power가 거래자에게 매우 유용한 이유 통화와 금의 실시간 강세 분석 • FX Power 는 주요 통화와 금의 상대적 강세를 계산하고 표시하여 시장 역학에 대한 명확한 통찰력을 제공합니다. • 어떤 자산이 앞서고 있고 어떤 자산이 뒤처지는지 모니터링하여 보다 현명한 거래 결정을 내릴 수 있습니다. 포괄적인 멀티 타임프레임 뷰 • 단기, 중기 및 장기 타임프레임에서 통화와 금의 강세를
Apollo Secret Trend
Oleg Rodin
5 (6)
Apollo Secret Trend는 모든 쌍과 시간대의 추세를 찾는 데 사용할 수 있는 전문적인 추세 지표입니다. 지표는 거래를 선호하는 쌍이나 기간에 관계없이 시장 동향을 감지하는 데 사용할 수 있는 주요 거래 지표가 될 수 있습니다. 표시기의 특수 매개변수를 사용하여 개인 거래 스타일에 맞게 신호를 조정할 수 있습니다. 표시기는 PUSH 알림을 포함한 모든 유형의 경고를 제공합니다. 표시기의 신호는 다시 칠하지 마십시오! 제공된 스크린샷에서 과매수/과매도 오실레이터 표시기와 함께 Apollo Secret Trend 표시기를 볼 수 있습니다. 이 표시기는 제가 절대적으로 무료로 제공합니다. 구매 후 두 번째 과매수 및 과매도 오실레이터 표시기를 무료로 받으려면 저에게 연락하십시오! 또한 시스템 사용 방법에 대한 지침도 제공합니다. 나는 또한 당신에게 큰 보너스를 공유 할 것입니다!
- Lifetime update free Contact me for instruction, add group and any questions! Related Products:  Bitcoin Expert , Gold Expert - Non-repaint - I just sell my products in Elif Kaya profile, any other websites are stolen old versions, So no any new updates or support. Introduction The breakout and retest strategy is traded support and resistance levels. it involves price breaking through a previous level.  The break and retest strategy is designed to help traders do two main things, the first is
Algo Pumping MT4
Ihor Otkydach
5 (2)
PUMPING STATION – 당신만을 위한 올인원(All-in-One) 전략 PUMPING STATION은 당신의 외환 거래를 더욱 흥미롭고 효과적으로 바꿔줄 혁신적인 인디케이터입니다. 단순한 보조 도구가 아니라, 강력한 알고리즘을 갖춘 완전한 거래 시스템으로서 보다 안정적인 트레이딩을 시작할 수 있도록 도와줍니다. 이 제품을 구매하시면 다음의 혜택을   무료로   받으실 수 있습니다: 전용 설정 파일: 자동 설정으로 최대의 퍼포먼스를 제공합니다. 단계별 동영상 가이드: PUMPING STATION 전략으로 거래하는 법을 배워보세요. Pumping Utility: PUMPING STATION과 함께 사용하도록 설계된 반자동 거래 봇으로, 거래를 더욱 쉽고 편리하게 만들어줍니다. ※ 구매 후 바로 저에게 메시지를 보내주세요. 추가 자료에 대한 접근 권한을 제공해드립니다. PUMPING STATION은 어떻게 작동하나요? 트렌드 컨트롤: 시장의 추세 방향을 즉시 파악합니다. 추세는
Easy Breakout
Mohamed Hassan
5 (10)
After your purchase, feel free to contact me for more details on how to receive a bonus indicator called VFI, which pairs perfectly with Easy Breakout for enhanced confluence!   Easy Breakout is a powerful price action trading system built on one of the most popular and widely trusted strategies among traders: the Breakout strategy ! This indicator delivers crystal-clear Buy and Sell signals based on breakouts from key support and resistance zones. Unlike typical breakout indicators, it levera
TPSproTREND PrO
Roman Podpora
4.68 (25)
VERSION MT5        —        ИНСТРУКЦИЯ RUS           —        INSTRUCTIONS  ENG 주요 기능: 렌더링 없이 정확한 입력 신호! 신호가 나타나면 관련성은 유지됩니다! 이는 신호를 제공한 후 변경하여 예금 자금 손실을 초래할 수 있는 다시 그리기 지표와의 중요한 차이점입니다. 이제 더 큰 확률과 정확도로 시장에 진입할 수 있습니다. 화살표가 나타난 후 목표에 도달(이익실현)하거나 반전 신호가 나타날 때까지 캔들을 색칠하는 기능도 있습니다. STOP LOSS / TAKE PROFIT 구역 표시 진입점 검색 시 시각적 명확성을 높이기 위해 시장 진입을 위한 최적 지점이 검색되는 BUY/SELL 영역을 초기에 표시하는 모듈을 만들었습니다. 정지 손실 수준 작업을 위한 추가 지능형 논리는 시간이 지남에 따라 크기를 줄이는 데 도움이 되므로 거래에 들어갈 때 초기 위험을 줄이는 데 도움이 됩니다(move sl). 더 높은 기간의 MI
Gold Venamax MT4
Sergei Linskii
5 (1)
Gold Venamax   - 이것은 최고의 주식 기술 지표입니다. 지표 알고리즘은 자산의 가격 변동을 분석하고 변동성과 잠재적 진입 영역을 반영합니다.   표시기 기능: 이것은 편안하고 수익성 있는 거래를 위한 매직과 두 개의 추세 화살표 블록을 갖춘 슈퍼 지표입니다. 블록 전환을 위한 빨간색 버튼이 차트에 표시됩니다. 매직은 표시기 설정에서 설정되므로 서로 다른 블록을 표시하는 두 개의 차트에 표시기를 설치할 수 있습니다. Gold Venamax는 서로 다른 화살표 버퍼(GV 및 SD)를 사용하여 두 개의 차트에 배치할 수 있습니다. 이렇게 하려면 설정에서 다른 Magic을 선택해야 합니다. 예를 들어 하나는 Magic = 999이고 다른 하나는 Magic = 666입니다. 다음으로 차트의 빨간색 버튼으로 화살표 버퍼를 선택할 수 있습니다. 입력하기에 가장 좋은 신호 = 두 버퍼(GV 및 SD)의 신호 화살표 + 세 MA 라인(빨간색 또는 파란색)의 방향을 따릅니다 + TMA
Volatility Trend System - a trading system that gives signals for entries. The volatility system gives linear and point signals in the direction of the trend, as well as signals to exit it, without redrawing and delays. The trend indicator monitors the direction of the medium-term trend, shows the direction and its change. The signal indicator is based on changes in volatility and shows market entries. The indicator is equipped with several types of alerts. Can be applied to various trading ins
현재 20% 할인 ! 초보자 또는 전문가 트레이더를 위한 최고의 솔루션! 이 대시보드 소프트웨어는 28개의 통화 쌍에서 작동합니다. 2가지 주요 지표(Advanced Currency Strength 28 및 Advanced Currency Impulse)를 기반으로 합니다. 전체 Forex 시장에 대한 훌륭한 개요를 제공합니다. 고급 통화 강도 값, 통화 이동 속도 및 모든(9) 시간대의 28 Forex 쌍에 대한 신호를 보여줍니다. 추세 및/또는 스캘핑 기회를 정확히 파악하기 위해 차트의 단일 지표를 사용하여 전체 시장을 볼 수 있을 때 거래가 어떻게 개선될지 상상해 보십시오! 잠재적인 거래를 식별하고 확인하면서 강력한 통화와 약한 통화를 더욱 쉽게 식별할 수 있도록 이 지표에 기능을 내장했습니다. 이 표시기는 통화의 강세 또는 약세가 증가 또는 감소하는지 여부와 모든 시간대에서 수행되는 방식을 그래픽으로 보여줍니다. 추가된 새로운 기능은 현재 시장 조건 변화에 적응하는
Lux Trend
Mohamed Hassan
5 (3)
After purchase, please contact me to get your trading tips + more information for a great bonus!   Lux Trend is a professional strategy based on using Higher Highs and Lower Highs to identify and draw Trendline Breakouts! Lux Trend  utilizes two Moving Averages to confirm the overall trend direction before scanning the market for high-quality breakout opportunities, ensuring more accurate and reliable trade signals. This is a proven trading system used by real traders worldwide, demonstrating
TPSpro RFI Levels
Roman Podpora
4.85 (27)
지침        러시아   -         영어       표시기와 함께 사용하는 것이 좋습니다   .       -       TPSpro   트렌드 프로 -   MT4 버전         거래에서 핵심 요소는 거래 상품을 매수 또는 매도하기로 결정하는 구역 또는 수준입니다. 주요 업체가 시장에서 자신의 존재를 숨기려는 시도에도 불구하고, 그들은 필연적으로 흔적을 남깁니다. 우리의 과제는 이러한 흔적을 식별하고 올바르게 해석하는 방법을 배우는 것이었습니다. 주요 기능:: 판매자와 구매자를 위한 활성 영역을 표시합니다! 이 지표는 매수 및 매도를 위한 모든 올바른 초기 임펄스 레벨/존을 보여줍니다. 진입점 검색이 시작되는 이러한 레벨/존이 활성화되면 레벨의 색상이 바뀌고 특정 음영으로 채워집니다. 또한 상황을 보다 직관적으로 이해하기 위해 화살표가 나타납니다. 더 높은 시간대의 레벨/존 표시(MTF 모드) 더 높은 시간 간격을 사용하여 레벨/존을 표시하는 기능을 추가했습니다.
IX Power MT4
Daniel Stein
4.75 (8)
IX Power: 지수, 원자재, 암호화폐 및 외환 시장 통찰력을 발견하세요 개요 IX Power 는 지수, 원자재, 암호화폐 및 외환 시장의 강도를 분석할 수 있는 다목적 도구입니다. FX Power 는 모든 가용 통화 쌍 데이터를 사용하여 외환 쌍에 대해 가장 높은 정확도를 제공하는 반면, IX Power 는 기초 자산 시장 데이터에만 초점을 맞춥니다. 이로 인해 IX Power 는 비외환 시장에 이상적이며, 다중 쌍 분석이 필요하지 않은 간단한 외환 분석에도 신뢰할 수 있는 도구입니다. 모든 차트에서 매끄럽게 작동하며, 거래 결정을 향상시키기 위한 명확하고 실행 가능한 통찰력을 제공합니다. 1. IX Power가 트레이더에게 유용한 이유 다양한 시장 강도 분석 • IX Power 는 지수, 원자재, 암호화폐 및 외환 심볼의 강도를 계산하여 각 시장에 맞는 통찰력을 제공합니다. • US30, WTI, 금, 비트코인 또는 통화 쌍과 같은 자산을 모니터링하여 거래 기회를 발견
Introduction to X3 Chart Pattern Scanner X3 Cherart Pattern Scanner is the non-repainting and non-lagging indicator detecting X3 chart patterns including Harmonic pattern, Elliott Wave pattern, X3 patterns, and Japanese Candlestick patterns. Historical patterns match with signal patterns. Hence, you can readily develop the solid trading strategy in your chart. More importantly, this superb pattern scanner can detect the optimal pattern of its kind. In addition, you can switch on and off individu
FX Dynamic: 맞춤형 ATR 분석으로 변동성과 트렌드를 파악하세요 개요 FX Dynamic 는 Average True Range(ATR) 계산을 활용하여 트레이더에게 일간 및 일중 변동성에 대한 뛰어난 인사이트를 제공하는 강력한 도구입니다. 80%, 100%, 130%와 같은 명확한 변동성 임계값을 설정함으로써 시장이 평소 범위를 초과할 때 빠르게 경고를 받고, 유망한 수익 기회를 재빨리 식별할 수 있습니다. FX Dynamic 는 브로커의 시간대를 인식하거나 수동으로 조정할 수 있으며, 변동성 측정 기준을 일관되게 유지하며, MetaTrader 플랫폼과 완벽하게 연동되어 실시간 분석을 지원합니다. 1. FX Dynamic이 트레이더에게 매우 유용한 이유 실시간 ATR 인사이트 • 하루 및 일중 변동성을 한눈에 모니터링하세요. ATR의 80%, 100%, 130% 임계값이 도달 또는 초과되면, 시장의 중요한 지점에 있음을 알 수 있습니다. • 변동성이 완전히 폭발하기
Currency Strength Wizard
Oleg Rodin
4.86 (49)
통화 강도 마법사는 성공적인 거래를 위한 올인원 솔루션을 제공하는 매우 강력한 지표입니다. 표시기는 여러 시간 프레임의 모든 통화 데이터를 사용하여 이 또는 해당 외환 쌍의 힘을 계산합니다. 이 데이터는 특정 통화의 힘을 확인하는 데 사용할 수 있는 사용하기 쉬운 통화 지수 및 통화 전력선의 형태로 표시됩니다. 필요한 것은 거래하려는 차트에 표시기를 부착하는 것뿐입니다. 표시기는 거래하는 통화의 실제 강세를 보여줍니다. 지표는 또한 추세와 거래할 때 유리하게 사용할 수 있는 구매 및 판매 거래량 압력의 극한값을 보여줍니다. 지표는 또한 피보나치에 기반한 가능한 대상을 보여줍니다. 표시기는 PUSH 알림을 포함한 모든 유형의 알림을 제공합니다. 구매 후 연락주세요. 나는 당신과 거래 팁을 공유하고 당신에게 무료로 훌륭한 보너스 지표를 줄 것입니다! 나는 당신에게 행복하고 유익한 거래를 기원합니다!
Gold Trend 4
Sergei Linskii
금 추세   - 좋은 주식 기술 지표입니다. 인디케이터 알고리즘은 자산의 가격 움직임을 분석하고 변동성과 잠재적 진입 구간을 반영합니다. 최고의 지표 신호: - 매도 = 빨간색 히스토그램 + 빨간색 숏 포인터 + 같은 방향의 노란색 신호 화살표. - 매수 = 파란색 히스토그램 + 파란색 롱 포인터 + 같은 방향의 아쿠아 신호 화살표. 인디케이터의 장점 1. 표시기는 높은 정확도로 신호를 생성합니다. 2. 확인된 화살표 신호는 추세가 바뀔 때만 다시 그릴 수 있습니다. 3. 모든 브로커의 메타트레이더 4 거래 플랫폼에서 거래할 수 있습니다. 4. 모든 자산(통화, 금속, 암호화폐, 주식, 지수 등)을 거래할 수 있습니다. 5. H1 차트주기(중기 트레이딩)에서 거래하는 것이 좋습니다. 6. 지표 설정에서 개별 매개 변수(TF, 색상 등)를 변경할 수 있으므로 각 트레이더가 지표를 쉽게 사용자 지정할 수 있습니다. 7. 이 보조지표는 독립적인 트레이딩 시스템뿐만 아니라 트레
Supply Demand Analyzer
Suvashish Halder
5 (6)
Supply Demand Analyzer is an advanced trading indicator meticulously designed for the precise identification, analysis, and management of supply and demand zones. By integrating real-time data and advanced algorithms, this tool enables traders to recognize market phases, price movements, and structural patterns with unparalleled accuracy. It simplifies complex market dynamics into actionable insights, empowering traders to anticipate market behavior, identify trading opportunities, and make info
Support Resistance screnner
STE S.S.COMPANY
4.94 (36)
Support And Resistance Screener는 하나의 지표 안에 여러 도구를 제공하는 MetaTrader에 대한 하나의 레벨 지표입니다. 사용 가능한 도구는 다음과 같습니다. 1. 시장 구조 스크리너. 2. 완고한 후퇴 영역. 3. 약세 후퇴 영역. 4. 일일 피벗 포인트 5. 주간 피벗 포인트 6. 월간 피벗 포인트 7. 고조파 패턴과 볼륨에 기반한 강력한 지지와 저항. 8. 은행 수준 구역. LIMITED TIME OFFER : HV 지원 및 저항 표시기는 50 $ 및 평생 동안만 사용할 수 있습니다. ( 원래 가격 125$ ) 메타트레이더 백테스터 제한 없이 인디케이터를 사용하시겠습니까? 데모 버전을 다운로드하려면 여기를 클릭하십시오. 주요 특징들 고조파 및 볼륨 알고리즘을 기반으로 하는 강력한 지원 및 저항 영역. Harmonic 및 Volume 알고리즘을 기반으로 한 강세 및 약세 풀백 영역. 시장 구조 스크리너 일간, 주간 및 월간 피벗 포인트. 문서 모
캔들의 종가를 예측하는 지표입니다. 지표는 주로 D1 차트에서 사용하기 위한 것이. 이 지표는 전통적인 외환 거래와 바이너리 옵션 거래 모두에 적합합니다. 지표는 독립형 거래 시스템으로 사용하거나 기존 거래 시스템에 추가로 사용할 수 있습니다. 이 표시기는 현재 양초를 분석하여 양초 본체 내부의 특정 강도 요인과 이전 양초의 매개변수를 계산합니다. 따라서 지표는 시장 움직임의 추가 방향과 현재 양초의 종가를 예측합니다. 이 방법 덕분에 지표는 단기 및 중장기 거래 모두에 적합합니다. 지표를 사용하면 시장 상황을 분석하는 동안 지표가 생성할 잠재적 신호의 수를 설정할 수 있습니다. 표시기 설정에는 이를 위한 특별한 매개변수가 있습니다. 또한 인디케이터는 새로운 신호에 대해 차트의 메시지 형태, 이메일 및 PUSH 알림 형태로 알릴 수 있습니다. 구매 후 저에게 꼭 써주세요! 나는 당신에게 지표와 거래에 대한 나의 추천을 줄 것입니다! 또한 보너스를 받으세요!
제작자의 제품 더 보기
Trend Catcher with Alert MT5
Issam Kassas
4.71 (85)
트렌드 캐쳐: 알림 인디케이터와 함께 하는 트렌드 캐쳐 전략은 시장 트렌드와 잠재적인 진입 및 체크 포인트를 식별하는 데 도움이 되는 다목적 기술 분석 도구입니다. 이는 시장 상황에 적응하여 트렌드 방향을 명확하게 시각적으로 표현하는 동적 트렌드 캐쳐 전략을 제공합니다. 트레이더는 선호도와 위험 허용도에 맞게 매개변수를 사용자 정의할 수 있습니다. 이 인디케이터는 트렌드 식별을 지원하고 잠재적인 반전을 신호로 제공하며 트레일링 스탑 메커니즘으로 작동하며 실시간 경고를 제공하여 신속한 시장 대응을 돕습니다. 특징: - 트렌드 식별: 상승 트렌드와 하락 트렌드를 신호합니다. - 트렌드 반전: 양봉 색상이 상승에서 하락으로 변경되거나 그 반대의 경우 잠재적인 반전을 경고합니다. - 실시간 경고: 새로운 트렌드 식별을 위한 경고를 생성합니다. 추천사항: - 통화 및 페어: EURUSD, AUDUSD, XAUUSD 등... - 시간 프레임: H1. - 계정 유형: 모든 ECN 계정
FREE
지원 및 저항 수준 찾기 도구: 지원 및 저항 수준 찾기는 거래에서 기술적 분석을 향상시키기 위해 설계된 고급 도구입니다. 동적 지원 및 저항 수준을 갖추고 있어 차트에서 새로운 키포인트가 펼쳐짐에 따라 실시간으로 적응하여 동적이고 반응이 빠른 분석을 제공합니다. 독특한 다중 시간대 기능을 통해 사용자는 원하는 시간대에서 다양한 시간대의 지원 및 저항 수준을 표시할 수 있으며, 5분 차트에 일일 수준을 표시하는 등 세밀한 시각을 제공합니다. 역사적 데이터 세트를 포함한 스마트 알고리즘을 사용하여 다른 S&R 지표와 차별화되는 포괄적인 분석을 보장합니다. 수준을 감지할 때 다중 매개변수 계산을 사용하여 정확성을 높입니다. 사용자는 지원 및 저항 수준의 색상을 개별적으로 사용자 정의하여 개인화된 시각적 경험을 만들 수 있습니다. 도구에는 가격이 중요한 수준에 접근할 때 거래자에게 알림 기능이 포함되어 시기적절한 결정을 돕습니다. 숨기기 및 표시 버튼과 수준의 가시성을 빠르게 전환하기
FREE
거래 포지션 및 백테스팅 도구: "거래 포지션 및 백테스팅 도구"는 "리스크 리워드 비율 도구"로도 알려진 포괄적이고 혁신적인 지표로, 기술적 분석과 거래 전략을 향상시키기 위해 설계되었습니다. 리스크 도구는 외환 거래에서 효과적인 리스크 관리를 위한 포괄적이고 사용하기 쉬운 솔루션입니다. 입찰 가격, 손실 중지 (SL) 및 이익 중지 (TP)를 포함한 거래 포지션을 미리 볼 수 있어 다가올 거래에 대한 투명한 개요를 제공합니다. 사용자 친화적인 패널은 자동 잔액 및 사용자 정의 잔액 옵션과 함께 자동 로트 및 리스크 계산을 제공합니다. 시장 매수 및 매도, 바이 스톱 및 세일 스톱 주문을 포함한 다양한 거래 미리보기를 지원합니다. 이 도구는 구매 및 판매 설정과 함께 차트 어디서나 매우 사용자 정의 가능한 움직임을 제공하는 고급 리스크 리워드 비율 기능을 포함하고 있습니다. 거래 정보의 스마트한 표시는 개방용 로트 크기, 스톱 로스, TP 및 주문 유형과 같은 중요한 세부 정보
FREE
우선적으로, 이 거래 도구는 전문적인 거래에 이상적인 비-다시 그리기 및 지연되지 않는 지표입니다.  온라인 강좌, 사용자 매뉴얼 및 데모. 스마트 가격 액션 컨셉트 인디케이터는 신규 및 경험 많은 트레이더 모두에게 매우 강력한 도구입니다. Inner Circle Trader Analysis 및 Smart Money Concepts Trading Strategies와 같은 고급 거래 아이디어를 결합하여 20가지 이상의 유용한 지표를 하나로 결합합니다. 이 인디케이터는 스마트 머니 컨셉트에 중점을 두어 대형 기관의 거래 방식을 제공하고 이동을 예측하는 데 도움을 줍니다.  특히 유동성 분석에 뛰어나 기관이 어떻게 거래하는지 이해하는 데 도움을 줍니다. 시장 트렌드를 예측하고 가격 변동을 신중하게 분석하는 데 탁월합니다. 귀하의 거래를 기관 전략에 맞추어 시장의 동향에 대해 더 정확한 예측을 할 수 있습니다. 이 인디케이터는 시장 구조를 분석하고 중요한 주문 블록을 식별하고 다양
트레이딩 세션 시간 인디케이터: "트레이딩 세션 시간 인디케이터"는 외환 시장의 다양한 거래 세션에 대한 이해를 높이기 위해 설계된 강력한 기술 분석 도구입니다. 이 시스템에 통합된 인디케이터는 도쿄, 런던 및 뉴욕을 포함한 주요 세션의 개장 및 마감 시간에 대한 중요한 정보를 제공합니다. 자동 시간대 조정을 통해 이 인디케이터는 전 세계 트레이더를 대상으로 하여 고유의 거래 일정을 최적화하고 저활동 시간을 피할 수 있습니다. 시장 심리, 피크 변동성 시기 및 중첩 세션에 대한 통찰력을 제공하여 일중 트레이더가 전략과 일치하는 정확한 결정을 내릴 수 있도록 지원합니다. 사용자 정의 가능한 디스플레이를 통해 사용자 경험을 개인화할 수 있으며, 해당 데이터를 활용한 스마트 트레이딩 계획은 향상된 거래 결과를 가져올 수 있습니다. 저활동 시간을 인식하여 과다 거래를 피하고 품질 높은 기회에 집중함으로써 트레이더가 이 인디케이터를 통해 거래 여정을 최적화할 수 있습니다. 특징: -
FREE
지원 및 저항 수준 찾기 도구: 지원 및 저항 수준 찾기는 거래에서 기술적 분석을 향상시키기 위해 설계된 고급 도구입니다. 동적 지원 및 저항 수준을 갖추고 있어 차트에서 새로운 키포인트가 펼쳐짐에 따라 실시간으로 적응하여 동적이고 반응이 빠른 분석을 제공합니다. 독특한 다중 시간대 기능을 통해 사용자는 원하는 시간대에서 다양한 시간대의 지원 및 저항 수준을 표시할 수 있으며, 5분 차트에 일일 수준을 표시하는 등 세밀한 시각을 제공합니다. 역사적 데이터 세트를 포함한 스마트 알고리즘을 사용하여 다른 S&R 지표와 차별화되는 포괄적인 분석을 보장합니다. 수준을 감지할 때 다중 매개변수 계산을 사용하여 정확성을 높입니다. 사용자는 지원 및 저항 수준의 색상을 개별적으로 사용자 정의하여 개인화된 시각적 경험을 만들 수 있습니다. 도구에는 가격이 중요한 수준에 접근할 때 거래자에게 알림 기능이 포함되어 시기적절한 결정을 돕습니다. 숨기기 및 표시 버튼과 수준의 가시성을 빠르게 전환하기
FREE
거래 포지션 및 백테스팅 도구: "거래 포지션 및 백테스팅 도구"는 "리스크 리워드 비율 도구"로도 알려진 포괄적이고 혁신적인 지표로, 기술적 분석과 거래 전략을 향상시키기 위해 설계되었습니다. 리스크 도구는 외환 거래에서 효과적인 리스크 관리를 위한 포괄적이고 사용하기 쉬운 솔루션입니다. 입찰 가격, 손실 중지 (SL) 및 이익 중지 (TP)를 포함한 거래 포지션을 미리 볼 수 있어 다가올 거래에 대한 투명한 개요를 제공합니다. 사용자 친화적인 패널은 자동 잔액 및 사용자 정의 잔액 옵션과 함께 자동 로트 및 리스크 계산을 제공합니다. 시장 매수 및 매도, 바이 스톱 및 세일 스톱 주문을 포함한 다양한 거래 미리보기를 지원합니다. 이 도구는 구매 및 판매 설정과 함께 차트 어디서나 매우 사용자 정의 가능한 움직임을 제공하는 고급 리스크 리워드 비율 기능을 포함하고 있습니다. 거래 정보의 스마트한 표시는 개방용 로트 크기, 스톱 로스, TP 및 주문 유형과 같은 중요한 세부 정보
FREE
Description:  The "Trend Finder Multi Time Frames multi pairs" indicator is a new technical analysis tool designed to assist traders in identifying and confirming trends across multiple timeframes and multiple pairs at the same time. By combining the strengths of various timeframes, this indicator offers a comprehensive view of the market's direction, helping traders make more informed decisions. Features: Multi-Timeframe Analysis: The indicator analyzes trends on different timeframes (e.g., M1
Description:  First of all Its worth emphasizing here that the Trend Breakout Catcher is  Non-Repainting,  Non-Redrawing    and  Non-Lagging  Indicator, Which makes it ideal from both manual and robot trading. The Trend Breakout Catcher Indicator employs a sophisticated algorithm designed to predict trends early and generate timely Buy and Sell signals at the onset of a breakout. Utilizing a smart calculation based on numerous elements, the indicator forms a robust and redundant system to detec
Get FREE Advanced Online Course and Learn About Our Advanced Trading System, Link in the Bio!  Click Here.  Our Mission and Vision:   Why Am I Even Here? Here is The Deal Brother, We Offer:Premium Quality Indicators: The Highest Quality Possible Algorithms. Unlimited Activations: Can be used on Unlimited number of Computers, MT4s and MT5s for lifetime. Inexpensive Prices: 30$ is the lowest price possible, Knowing that more than 50% of our Indicators are 100% FREE. But Why Am I telling You this?
Description:  For a comprehensive understanding of our indicators, we invite you to explore the entire Q&A section within this MQL5 blog post   here . The "Currency Strength Meter Strategy" Indicator is a cutting-edge technical analysis tool that offers traders a unique perspective on the forex market. By analyzing the relative strength of different currencies, this indicator provides valuable insights into the market's dynamics, allowing traders to make informed decisions. Understanding Curren
Description:  For a comprehensive understanding of our indicators, we invite you to explore the entire Q&A section within this MQL5 blog post   here . The "Candlestick Pattern Finder with Alerts and Hide Button" is a sophisticated technical analysis tool designed to elevate your trading experience by identifying key candlestick patterns in the market. This powerful indicator offers valuable insights into price action, enabling you to make well-informed trading decisions. Unlock Candlestick Insi
Description:  For a comprehensive understanding of our indicators, we invite you to explore the entire Q&A section within this MQL5 blog post   here . The Stochastic Cross Alert Indicator is a valuable technical analysis tool that helps traders with better signals for identifying potential trend reversals and momentum shifts. Designed to work seamlessly on various financial instruments, this indicator provides real-time alerts and customizable parameters, making it a versatile addition to your
Price Alert Panel MT5
Issam Kassas
5 (5)
Description:  For a comprehensive understanding of our indicators, we invite you to explore the entire Q&A section within this MQL5 blog post   here . The "Moving Average Lines Crossover with Alert" is a valuable technical analysis tool designed to help traders identify potential trend reversals and trading opportunities. Seamlessly integrated into your trading platform, this indicator empowers you with essential data to make well-informed trading decisions. Spot Trend Reversals: Utilize the pow
FREE
Spread And Candle Timer
Issam Kassas
4.33 (9)
Description:  For a comprehensive understanding of our indicators, we invite you to explore the entire Q&A section within this MQL5 blog post   here . The "Show TP and SL Values" Indicator is a valuable technical analysis tool designed to enhance your trading experience by displaying the  (TP) and  (SL) levels directly on your chart. This simple yet effective tool provides traders with crucial information, allowing for better decision-making and risk management. Key Features: TP and SL Display:
FREE
A Simple Visual Indication of the Trading Sessions Times. This Indicator will help you Visualize the Trading sessions and take advantage of the session precise timing to trade at the open of each session where there might be more liquidity. This Indicator is FREE, So pls Dont forget to leave a 5 * stars Review, This Will help me create new Ideas and Indicators and Upload them to the Market. More Professional and useful Indicators and tools here:  https://www.mql5.com/en/users/dubaiforexgroup/sel
FREE
Description:  For a comprehensive understanding of our indicators, we invite you to explore the entire Q&A section within this MQL5 blog post   here . The Moving Average 5EMA Indicator is a valuable tool designed to provide comprehensive insights into market trends and potential entry and exit points. It incorporates five exponential moving average (EMA) lines, each representing the average price over different periods. This powerful combination offers a deeper understanding of price movements a
FREE
Description:  The Range Breakout Catcher Indicator is a powerful tool known for its non-repainting, non-redrawing, and non-lagging capabilities, making it suitable for both manual and robot trading. This indicator utilizes a smart algorithm to calculate ranges and generate early signals for Buy and Sell positions at the breakout of these ranges, facilitating the capture of trends during ranging consolidations. The range calculation involves a comprehensive system based on various elements, prov
Price Alert Panel MT4
Issam Kassas
4.69 (13)
Get FREE Advanced Online Course and Learn About Our Advanced Trading System, Link in the Bio!  Click Here.  Our Mission and Vision: Why Am I Even Here?Here is The Deal Brother, We Offer: Premium Quality Indicators: The Highest Quality Possible Algorithms. Unlimited Activations: Can be used on Unlimited number of Computers, MT4s and MT5s for lifetime. Inexpensive Prices: 30$ is the lowest price possible, Knowing that more than 50% of our Indicators are 100% FREE. But Why Am I telling You this?
FREE
Show TP and SL Values
Issam Kassas
4.6 (10)
Description:  For a comprehensive understanding of our indicators, we invite you to explore the entire Q&A section within this MQL5 blog post   here . The "Show TP and SL Values" Indicator is a valuable technical analysis tool designed to enhance your trading experience by displaying the  (TP) and  (SL) levels directly on your chart. This simple yet effective tool provides traders with crucial information, allowing for better decision-making and risk management. Key Features: TP and SL Display:
FREE
Description:  For a comprehensive understanding of our indicators, we invite you to explore the entire Q&A section within this MQL5 blog post   here . The "VWAP Indicator Strategy" is a cutting-edge technical analysis tool designed to provide traders with a competitive advantage in the financial markets. By incorporating the Volume Weighted Average Price (VWAP) indicator, this tool offers valuable insights into market trends, price levels, and potential turning points. Understanding the VWAP Ind
Description:  For a comprehensive understanding of our indicators, we invite you to explore the entire Q&A section within this MQL5 blog post   here . The "Live Account Statistics" Indicator is a powerful technical analysis tool that provides real-time insights into the performance of your trading account. With this indispensable tool, you can access crucial account statistics, such as balance, equity, drawdown, and more, allowing you to make data-driven trading decisions. Key Features: Real-Ti
FREE
Get FREE Advanced Online Course and Learn About Our Advanced Trading System, Link in the Bio!  Click Here.  Our Mission and Vision:   Why Am I Even Here?    Here is The Deal Brother, We Offer:Premium Quality Indicators: The Highest Quality Possible Algorithms. Unlimited Activations: Can be used on Unlimited number of Computers, MT4s and MT5s for lifetime. Inexpensive Prices: 30$ is the lowest price possible, Knowing that more than 50% of our Indicators are 100% FREE. But Why Am I telling You th
Description:  For a comprehensive understanding of our indicators, we invite you to explore the entire Q&A section within this MQL5 blog post   here . The "VWAP Indicator Strategy" is a cutting-edge technical analysis tool designed to provide traders with a competitive advantage in the financial markets. By incorporating the Volume Weighted Average Price (VWAP) indicator, this tool offers valuable insights into market trends, price levels, and potential turning points. Understanding the VWAP Ind
Description:  The "ABC Pattern Strategy With Fibonacci" Indicator is a sophisticated technical analysis tool meticulously designed to recognize and leverage the power of the ABC chart patterns in combination with Fibonacci levels. This cutting-edge strategy empowers traders to make well-informed decisions in the dynamic forex market. By making spotting ABC patterns on price charts an easy task, the indicator offers insights into potential trend reversals or continuations. It seamlessly incorpora
High Spread Alert MT5
Issam Kassas
5 (2)
Description:  For a comprehensive understanding of our indicators, we invite you to explore the entire Q&A section within this MQL5 blog post   here . The "High Spread Alert" Indicator is a valuable tool for traders, providing real-time information about spread fluctuations in the forex market. As a technical analysis tool, it helps traders make informed decisions by alerting them to periods of high spread, which can impact trading conditions and execution. Key Features: Spread Monitoring: The
FREE
High Spread Alert MT4
Issam Kassas
5 (3)
Description:  For a comprehensive understanding of our indicators, we invite you to explore the entire Q&A section within this MQL5 blog post   here . The "High Spread Alert" Indicator is a valuable tool for traders, providing real-time information about spread fluctuations in the forex market. As a technical analysis tool, it helps traders make informed decisions by alerting them to periods of high spread, which can impact trading conditions and execution. Key Features: Spread Monitoring: The i
FREE
A Simple Visual Indication of the Trading Sessions Times. This Indicator will help you Visualize the Trading sessions and take advantage of the session precise timing to trade at the open of each session where there might be more liquidity. This Indicator is FREE, So pls Dont forget to leave a 5 * stars Review, This Will help me create new Ideas and Indicators and Upload them to the Market. More Professional and useful Indicators and tools here:  https://www.mql5.com/en/users/dubaiforexgroup/sel
FREE
Description:  For a comprehensive understanding of our indicators, we invite you to explore the entire Q&A section within this MQL5 blog post   here . The "Candlestick Pattern Finder with Alerts and Hide Button" is a sophisticated technical analysis tool designed to elevate your trading experience by identifying key candlestick patterns in the market. This powerful indicator offers valuable insights into price action, enabling you to make well-informed trading decisions. Unlock Candlestick Insi
필터:
리뷰 없음
리뷰 답변