CandlesPeriodMT5
//--- input parameters
input ENUM_TIMEFRAMES InpPeriod = PERIOD_D1; // Period
input int InpBandsShift = 15; // Shift
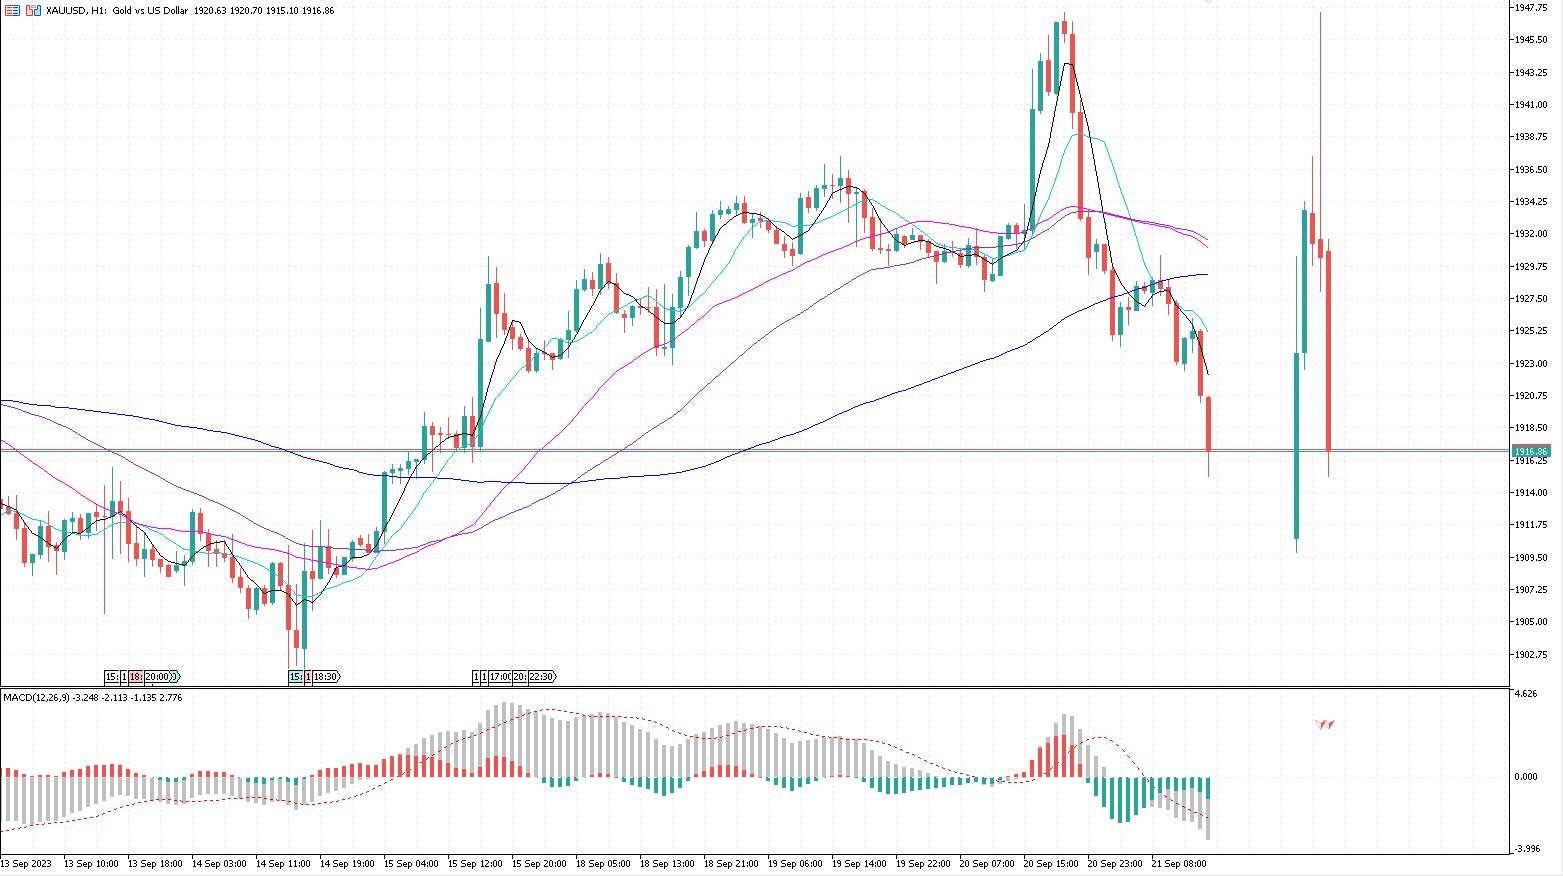
아이콘에 기타 임의의 주기 촛불 그림의 수신선을 표시하는 지표는 시장 추세를 효율적으로 분석할 수 있으며, 더욱 효과적이고, 더욱 간결하며, 더욱 직관적이다.
당신의 구매와 사용에 감사드리며, 더 좋은 건의가 있으면 댓글로 남겨 주십시오. 저는 가장 먼저 회답할 것입니다. 여기서 당신이 시장에서 충분한 돈을 번 것을 축하합니다.
아이콘에 기타 임의의 주기 촛불 그림의 수신선을 표시하는 지표는 시장 추세를 효율적으로 분석할 수 있으며, 더욱 효과적이고, 더욱 간결하며, 더욱 직관적이다.
당신의 구매와 사용에 감사드리며, 더 좋은 건의가 있으면 댓글로 남겨 주십시오. 저는 가장 먼저 회답할 것입니다. 여기서 당신이 시장에서 충분한 돈을 번 것을 축하합니다.