• 미리보기
  • 리뷰
  • 코멘트

ZHL Channel

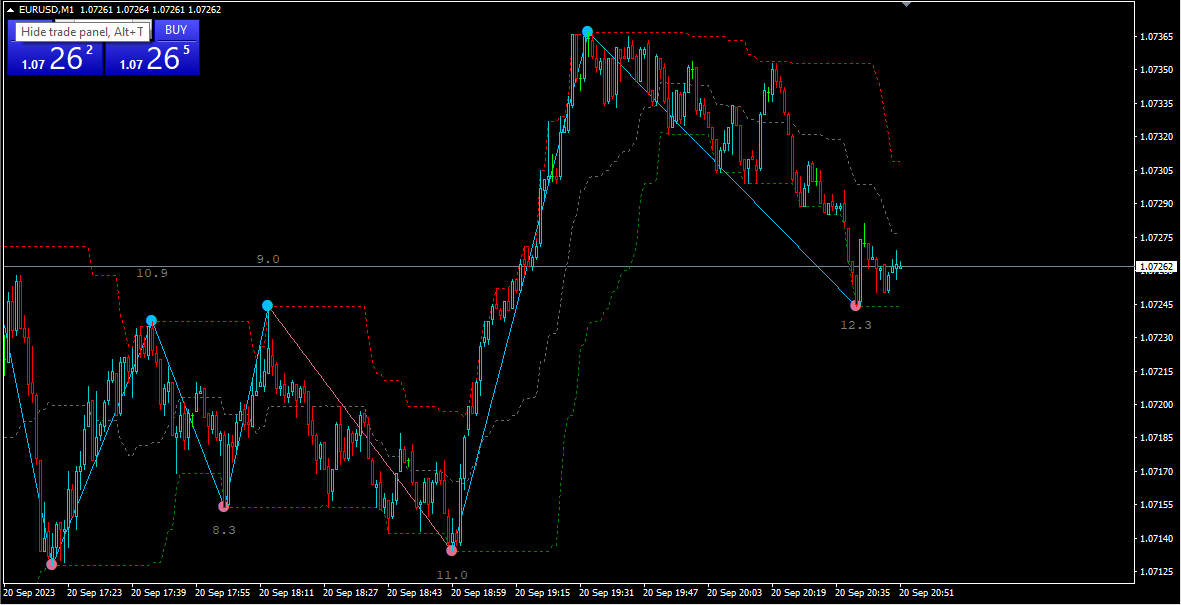
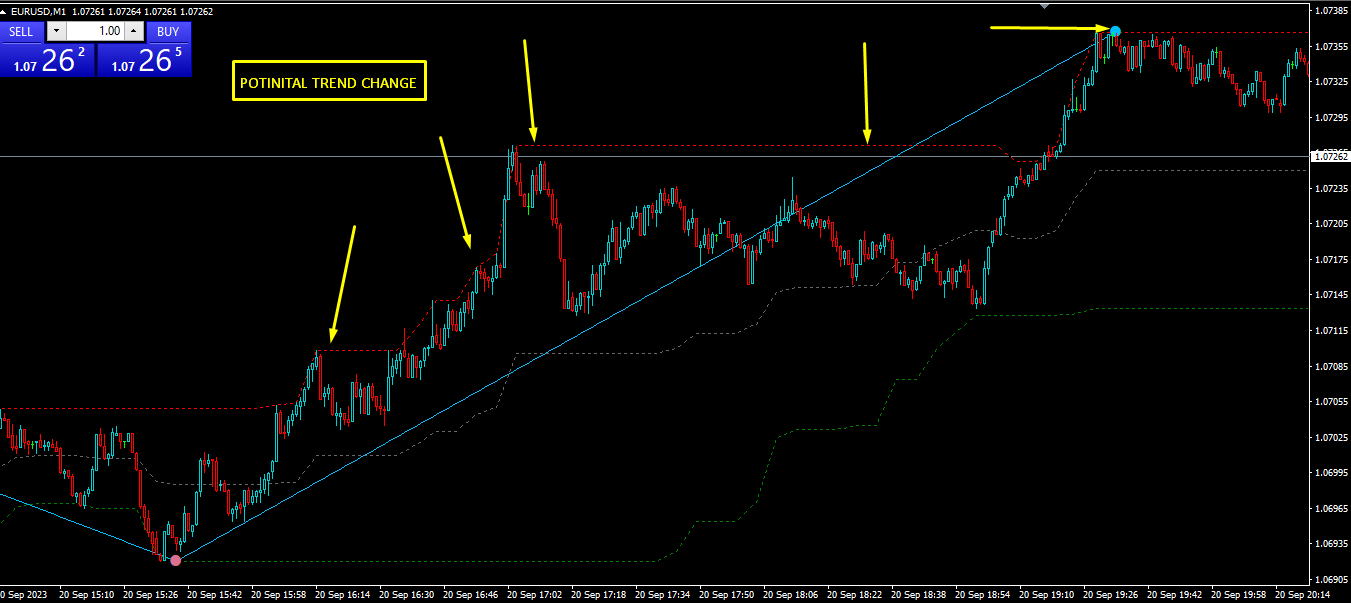
지그재그 표시기를 기반으로 하는 지그재그 고저 채널 표시기는 거래자에게 추세 변화를 알리는 도구이며 매우 유용합니다.
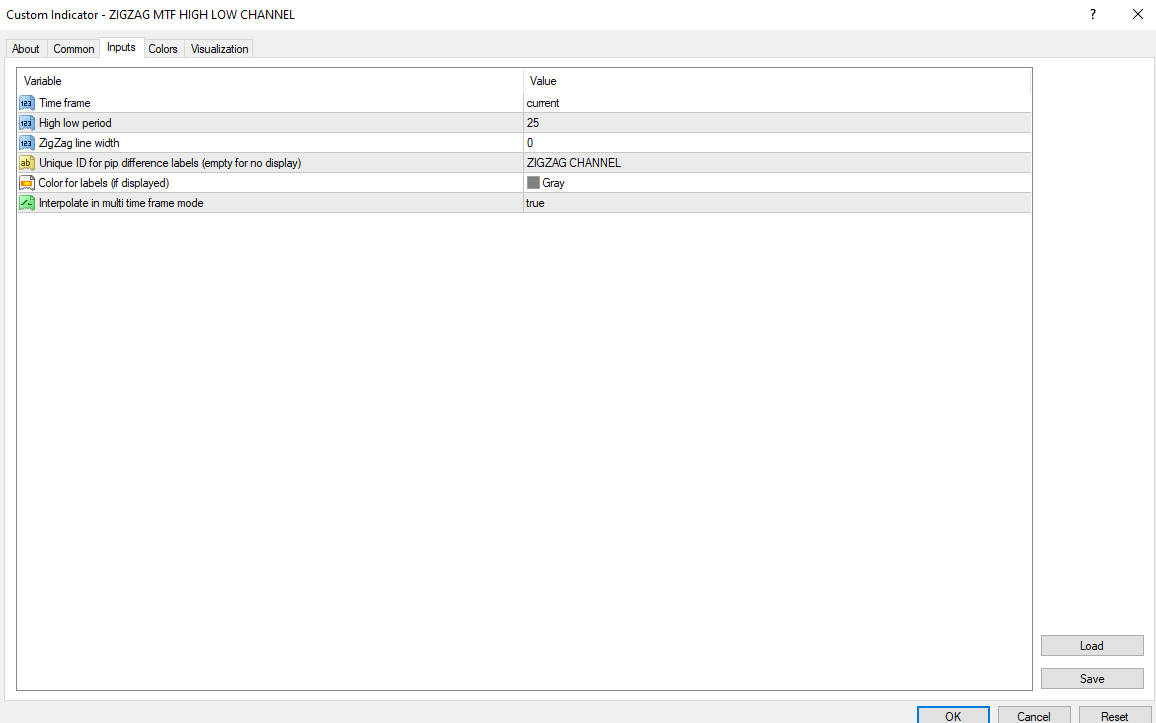
현재 추세의 변화에 ​​대한 조기 경고를 제공하므로 지표에는 더 높거나 낮은 시간대를 거래할 수 있는 다중 시간대 옵션이 있습니다.
현재 시간대의 채널, 이 표시기는 시스템/전략에 추가되며 거래를 위해 독립형으로 사용할 수 있지만 사용을 권장합니다.
그것은 당신의 무기고에 추가됩니다.
===========================

===========================

===========================

========================================

=====

=
추천 제품
FiboZag
Andriy Sydoruk
Indicator FiboZag - transfer the indicator to the chart and the Fibonacci levels will be built automatically on the last ZigZag turn. The main advantage lies in the correct construction of Fibonacci levels and markup of price levels. Simple, visual and effective use. The indicator is not redrawn and does not lag. Works on all currency pairs and on all timeframes.
Trend MA Candles
Claus Dietrich
4.14 (7)
COLORED TREND MA / MACD CANDLES draw MA Candles above/below Moving Average in a single color draw MA as a leading Line like a Supertrend draw MA as a Channel => MA High and Low draw MACD Candles above and below 0 and Signal-Line Your  Advantage: a simple view of the trend direction a simple view over the higher trend direction a calmer chart for the eye clear rules can be defined Settings: Bars to process : 6000 is my default, this value is up to you Value Quick-Set : pre-Settings MACD 12 / 26
FREE
Trend Gap Indicator
Roberto Alexander Quan
A Gap often occurs when the price moves with "strength" in a given direction (either up or down).  This Gap is formed when, in looking at 3 consecutive candles, the wicks of the 1st and 3rd candles do not overlap.  When this happens, the indicator creates a rectangle where the Gap is located. It identifies a zone where the price could potentially go back to (mitigation).   The Gap/rectangle is mitigated when the price returns and completely covers the rectangle. Note that the indicator also show
VR Pivot
Vladimir Pastushak
VR Pivot is an indicator of key pivot points. Pivot points are a special type of support and resistance levels that are used to determine the strongest price zones. Professional traders use pivot levels to determine prices at which there is a high probability of a price reversal. The levels are calculated using special mathematical formulas, which include the closing, opening, high, and low prices of the previous time period. The most effective is the daily period. It is important to note that a
Trend Guardian Pro - Advanced Trend Prediction Indicator Trend Guardian Pro is the result of collaborative work by a team of professional mathematicians, analysts, and traders. The indicator is based on years of market data analysis and employs cutting-edge mathematical modeling techniques for early detection of potential trend changes. Key Features: Early prediction   - the indicator analyzes multiple market factors to identify signs of trend changes before they become apparent Comprehensive an
Introducing the Consecutive Green/Red Candle Alert Indicator for MT4 - Your Trend Spotting Companion! Are you ready to take your trading to the next level? We present the Consecutive Green/Red Candle Alert Indicator, a powerful tool designed to help you spot trends and potential reversals with ease. Whether you're a new trader looking for clarity in the market or an experienced pro seeking additional confirmation, this indicator is your trusted companion. Key Features of the Consecutive Green/Re
FREE
PLUTO MASTER TURTLE (Binary Option)   The indicator allows you to trade binary options. The recommended timeframe is М5 and the expiration time is 5 minutes. The indicator works on any currency pairs. Trading time is not limited. A possible signal is specified as a arrow above/under a candle. If the arrow remains on the previous candle, you can enter the trade immediately. Arrows are not re-painted! The trading strategy is based on the correlation of the statistical RSI, STO and Candlestick body
TrendPlus
Sivakumar Subbaiya
4.07 (14)
Trend Plus   Trendplus  Indicator   Time Frame: Suitable for any time frame.  Purpose: Trend Prediction. Blue and red candle indicate the buy and sell call respectively. Buy: When the blue candle is formed buy call is initiated. close the buy trades when the next red candle will formed.   Sell: When the Red candle is formed Sell call is initiated. close the Sell trades when the next blue candle will formed.   Happy trade!!
FREE
Supertrend Fakeout MT4
Duc Hoan Nguyen
5 (1)
Special offer : ALL TOOLS , just $35 each! New tools   will be   $30   for the   first week   or the   first 3 purchases !  Trading Tools Channel on MQL5 : Join my MQL5 channel to update the latest news from me Supertrend Fakeout 지표는 기존의 Supertrend 지표를 개선한 버전으로, 더 신뢰할 수 있는 추세 신호를 제공하도록 설계되었습니다. Fakeout Index Limit 와 Fakeout ATR Mult 와 같은 고급 기능을 통합하여 단기 가격 변동이나 시장 노이즈로 인해 발생하는 잘못된 추세 반전을 필터링하는 데 도움을 줍니다. MT5 버전에 대해 자세히 알아보기:  Supertrend Fakeout MT5 다른 제품 보기:   모든 제품 작동 원리 Supertrend Fakeout 지표는
FREE
Are you tired of drawing trendlines every time you're analyzing charts? Or perhaps you would like more consistency in your technical analysis. Then this is for you. This indicator will draw trend lines automatically when dropped on a chart. How it works Works similar to standard deviation channel found on mt4 and mt5. It has 2 parameters: 1. Starting Bar 2. Number of bars for calculation The   starting bar   is the bar which drawing of the trend lines will begin, while the   number of bars for c
FREE
MACD in MA
Nikolaos Pantzos
iMACD in iMA is indicator to change color in iMA if iMACD is upper of zero (up trend) or lower of zero (down trend). It is a useful tool to track when the upside and the downside iMACD on iMA. You can to get source code from here . Parameters MA_Periods — Period for iMA. MA_Method — Method for iMA. MACD_FastEMA — Fast EMA for MACD. MACD_SlowEMA — Slow EMA for MACD. MACD_SignalSMA — SMA signal for MACD. MACD_ApliedPrice — Price used for MACD. BarsCount — How many bars will show the line. Revers
FREE
RaysFX   EMA  Crossover Scopri i potenziali punti di inversione del mercato con l’indicatore di Crossover EMA di RaysFX. Questo indicatore utilizza una combinazione di due medie mobili esponenziali (EMA) - una più veloce e una più lenta - per identificare i possibili punti di ingresso e uscita. Caratteristiche principali : Due EMA : Utilizza una EMA più veloce e una più lenta per catturare i movimenti di mercato a breve e lungo termine. Segnali di crossover : Genera un segnale quando l’EMA più v
FREE
SC MTF Stochastic MT4
Krisztian Kenedi
4.33 (9)
Highly configurable Stochastic indicator. Features: Highly customizable alert functions (at levels, crosses, direction changes via email, push, sound, popup) Multi timeframe ability Color customization (at levels, crosses, direction changes) Linear interpolation and histogram mode options Works on strategy tester in multi timeframe mode (at weekend without ticks also) Adjustable Levels Parameters: Stochastic Timeframe:  You can set the lower/higher timeframes for Stochastic. Stochastic  Bar Sh
FREE
Pin Bars
Yury Emeliyanov
5 (2)
주요 목적:"핀 바"는 금융 시장 차트에서 핀 바를 자동으로 감지하도록 설계되었습니다. 핀 바는 특징적인 몸체와 긴 꼬리를 가진 촛불로,추세 반전 또는 교정을 신호 할 수 있습니다. 작동 원리:표시기는 차트의 각 촛불을 분석하여 촛불의 몸,꼬리 및 코의 크기를 결정합니다. 미리 정의 된 매개 변수에 해당하는 핀 막대가 감지되면 표시기는 핀 막대의 방향(강세 또는 약세)에 따라 위 또는 아래 화살표로 차트에 표시합니다. 매개 변수: 꼬리의 길이와 핀 바의 몸체 크기 사이의 최소 비율을 정의합니다. "코"와 핀 바의 꼬리 사이의 최대 허용 비율을 설정합니다. 화살표 크기-표시된 핀 막대와 차트에서 핀 막대를 가리키는 화살표 사이의 거리를 정의합니다. 신청:"핀 바"표시기는 잠재적 인 추세 반전 지점을 식별하고 시장 또는 가까운 위치에 진입하기 위해 신호를 생성하는 데 사용할 수 있습니다. 올바르게 사용하고 다른 기술 지표 및 분석 방법과 결합하면이 지표는 거래 결과를 향상시킬 수
FREE
Super Auto Fibonacci
Muhammed Emin Ugur
Discover the power of precision and efficiency in your trading with the " Super Auto Fibonacci " MT4 indicator. This cutting-edge tool is meticulously designed to enhance your technical analysis, providing you with invaluable insights to make informed trading decisions. Key Features: Automated Fibonacci Analysis: Say goodbye to the hassle of manual Fibonacci retracement and extension drawing. "Super Auto Fibonacci" instantly identifies and plots Fibonacci levels on your MT4 chart, saving you tim
FREE
This indicator works on MT4 and is very easy to use. When you receive a signal from it, you wait for that candle with the signal to close and you enter your trade at the beginning of the next new candle . A red arrow means sell and a green arrow means buy. All arrows comes with Alert  like for easy identification of trade signal. Are you okay with that? 1 minute candle 1 minute expire
Head and Shoulders Pattern Indicator - Your Key to Recognizing Trend Reversals Unlock the power of pattern recognition with the "Head and Shoulders Pattern Indicator." This cutting-edge tool, designed for MetaTrader, is your trusted ally in identifying one of the most powerful chart patterns in technical analysis. Whether you're a novice or an experienced trader, this indicator simplifies the process of spotting the Head and Shoulders pattern, allowing you to make informed trading decisions. Key
FREE
The AP Blocks Trend Signal Indicator is a visual, easy to handle non repainting indicator which helps you to determine the beginning of a trend and enter a trade accordingly. Three Blocks show you the trend on different timeframes (ranges in case of renko). If all blocks have the same color at the end of the candle, then you are ready to enter a trade! The usage is very easy: 1. Check the 3 Block colors of the previous Bar. 2. If all 3 are blue => enter long (market) 3. If all 3 are red => en
LordChannel
Igor Pereira Calil
LordChannel is an indicator for META TRADER 4 for all forex pairs and financial market metals. The indicator is used to make detections of high/low channels, implementing a technical analysis on possible breakouts and making correct order entries. LordChannel sends signals such as buy and sell in the graphical analysis, it is important to emphasize that the importance of these signals are safe in TIME FRAMES M30, H1, H4. The indicator was created for using bullish/downtrend channels to compl
MOR Smart Gap
Vitaliy Sendyaev
The indicator finds and visualizes price gaps, which often can be used as support and resistance levels. It can display levels from different timeframes on one chart. Inputs Value Label - show/hide the timeframe of constructed levels TimeFrame - select timeframe to draw levels from DrawRangeDay - the length of the level in days DrawRangeHour - the length of the level in hours GapSizeForDrawing - a level will be drawn if gap is equal to or larger than this level in points CountDays - the number
SR indicator
Alexander Chertnik
SR is a support and resistance indicator, it shows major highs and lows by different colors. The color of a level is changing if the last high or low are touching it. After the closing of a bar above or below level, it will delete it. extern inputs: loop for candles / colors / drawing time *This indicator signal is not perfect and have to be used with other market analysis and confirmations.
FREE
Stochastic Arrow
Anton Iudakov
4.5 (4)
The indicator has combined 5 popular strategies. Draws an arrow after confirming a signal for the selected strategy. There are signal alerts. Doesn't redraw its values. I recommend watching my advisor -   Night Zen EA 5 strategies. The main line crosses the signal line. The main line crosses the signal line in the oversold (for buy) / overbought (for sell) zones. The main line enters the oversold (for sell) / overbought (for buy) zones . The main line comes out of the oversold (for buy ) / over
FREE
Pivot Points MT4
KEENBASE SOFTWARE SOLUTIONS
KT Pivot Points automatically plots the daily, weekly, and monthly pivot levels on a chart with the precise calculation based on the latest data. Pivot points is a widely used indicator in technical analysis, particularly in the Forex market. Features Send alerts when the price touches the pivot level.  It offers complete customization for each kind of pivot level.   Shows daily, weekly, and monthly pivot levels without any fuss. It uses minimum CPU resources for faster calculation. Compatible
Extremum Reverse Bar
Yurij Izyumov
2.8 (5)
This indicator has been created for finding the probable reversal points of the symbol price. A small candlestick reversal pattern is used it its operation in conjunction with a filter of extremums. The indicator is not redrawn! If the extremum filter is disabled, the indicator shows all points that have a pattern. If the extremum filter is enabled, the condition works – if the history Previous bars 1 candles back contains higher candles and they are farther than the Previous bars 2 candle, such
FREE
Sm Ichimoku Scanner
Steeve Christian Martol
5 (4)
Multi Time Frame Indicator acts as a Scanner based on the Ichimoku Trading System. The outcome is displayed on a board. This helps you to make "at a glance" a mental picture of the System without having to open the chart. Up to 10 Currencies can be watched. Scanned elements And Legend "KUMO Futur" - Green : The Kumo Futur is Bullish. "KUMO Futur" - Red : The Kumo Futur is Bearish. "PRICE Cross KJ" - Green : The Price is Above the Kijun Sen.  "PRICE Cross KJ" - Red : The Price is Below the Kijun
FREE
Free automatic fibonacci
Tonny Obare
4.67 (48)
Free automatic Fibonacci is an indicator that automatically plots a Fibonacci retracement based on the number of bars you select on the BarsToScan setting in the indicator. The Fibonacci is automatically updated in real time as new highest and lowest values appears amongst the selected bars. You can select which level values to be displayed in the indicator settings. You can also select the color of the levels thus enabling the trader to be able to attach the indicator several times with differe
FREE
Heiken Ashi Button
Lee Teik Hong
4.75 (4)
Heiken Ashi Button Heiken-Ashi , often spelled Heikin-Ashi, is a Japanese word that means "Average Bar." The Heiken-Ashi approach can be used in conjunction with candlestick charts to spot market trends and forecast future prices. It's useful for making candlestick charts easier to read and analysing patterns. Traders can use Heiken-Ashi charts to determine when to stay in trades while the trend continues and close trades when the trend reverses. The majority of earnings are made when markets a
FREE
Introduction This indicator detects volume spread patterns for buy and sell opportunity. The patterns include demand and supply patterns. You might use each pattern for trading. However, these patterns are best used to detect the demand zone (=accumulation area) and supply zone (=distribution area). Demand pattern indicates generally potential buying opportunity. Supply pattern indicates generally potential selling opportunity. These are the underlying patterns rather than direct price action. T
FREE
Round Levels mw
DMITRII GRIDASOV
MT4용 외환 지표 "라운드 레벨" - 지표 "라운드 레벨"은 지지/저항을 고려하는 트레이더에게 반드시 필요한 보조 지표입니다. - 라운드 레벨은 가격에 매우 중요합니다. 가격은 라운드 레벨에서 매우 자주 반등합니다. - H4, D1 시간 프레임에는 1000포인트 단계를 사용합니다. - H1 및 그 이하 시간 프레임에는 500포인트 단계를 사용합니다(일중 거래). - 라운드 레벨은 또한 이익 실현(라운드 레벨 앞) 및 SL(라운드 레벨 뒤)을 할당하는 데 좋습니다. - 이러한 레벨은 특히 가격이 횡보하고 평평할 때 매우 강합니다. // 더 많은 훌륭한 전문가 자문가 및 지표는 여기에서 확인할 수 있습니다: https://www.mql5.com/en/users/def1380/seller 이 MQL5 웹사이트에서만 제공되는 오리지널 제품입니다.
ITS FREE I Recommend   www.CoinexxBroker.com  as a great broker and the one I personally use Asia session 1:00 to 9:00 (6pm est to 2 am est) Eur means London Session 10:00 to 18:00 (3 am est to 11 am est) USA means New York Session 15:00 to 23:00 (8 am est to 4 pm est) Session indicator highlights the start of each trading session. You can show all sessions or edit the settings to only show the hours you want highlighted  (Asia) means Asian Session ,(Eur)  means London Session , (USA) means New
FREE
이 제품의 구매자들이 또한 구매함
Gann Made Easy
Oleg Rodin
4.79 (109)
Gann Made Easy 는 mr.의 이론을 사용하여 최고의 거래 원칙을 기반으로 하는 전문적이고 사용하기 쉬운 Forex 거래 시스템입니다. W.D. 간. 이 표시기는 Stop Loss 및 Take Profit Levels를 포함하여 정확한 BUY 및 SELL 신호를 제공합니다. PUSH 알림을 사용하여 이동 중에도 거래할 수 있습니다. 구매 후 연락주세요! 내 거래 팁과 훌륭한 보너스 지표를 무료로 공유하겠습니다! 아마도 Gann 거래 방법에 대해 이미 여러 번 들었을 것입니다. 일반적으로 Gann의 이론은 초보자 거래자뿐만 아니라 이미 거래 경험이 있는 사람들에게도 매우 복잡한 것입니다. Gann의 거래 방식은 이론적으로 적용하기 쉽지 않기 때문입니다. 나는 그 지식을 연마하고 Forex 지표에 최고의 원칙을 적용하기 위해 몇 년을 보냈습니다. 표시기는 적용하기가 매우 쉽습니다. 차트에 첨부하고 간단한 거래 권장 사항을 따르기만 하면 됩니다. 지표는 지속적으로 시장 분석 작업
Dynamic Forex28 Navigator
Bernhard Schweigert
5 (4)
Dynamic Forex28 Navigator - 차세대 외환 거래 도구. 현재 49% 할인. Dynamic Forex28 Navigator는 오랫동안 인기 있는 지표의 진화형으로, 세 가지의 힘을 하나로 결합했습니다. 고급 통화 Strength28 지표(695개 리뷰) + 고급 통화 IMPULSE with ALERT(520개 리뷰) + CS28 콤보 신호(보너스). 지표에 대한 자세한 정보 https://www.mql5.com/en/blogs/post/758844 차세대 Strength 지표는 무엇을 제공합니까?  원래 지표에서 좋아했던 모든 것이 새로운 기능과 더 높은 정확도로 강화되었습니다. 주요 기능: 독점적인 통화 Strength 공식.  모든 시간대에 걸쳐 부드럽고 정확한 강도선. 추세와 정확한 진입을 식별하는 데 이상적입니다. 역동적인 시장 피보나치 수준(시장 피보나치).  이 지표에만 있는 고유한 기능. 가격 차트가 아닌 통화 강도에 피보나치가 적용됩니다.
-   Real price is 80$   - 40% Discount ( It is 49$ now ) - Lifetime update free Contact me for instruction, add group and any questions! Related Products:  Bitcoin Expert , Gold Expert - Non-repaint - I just sell my products in Elif Kaya profile, any other websites are stolen old versions, So no any new updates or support. Introduction The breakout and retest strategy is traded support and resistance levels. it involves price breaking through a previous level.  The break and retest strategy is
Scalper Inside PRO
Alexey Minkov
4.75 (61)
!SPECIAL SALE!  An exclusive indicator that utilizes an innovative algorithm to swiftly and accurately determine the market trend. The indicator automatically calculates opening, closing, and profit levels, providing detailed trading statistics. With these features, you can choose the most appropriate trading instrument for the current market conditions. Additionally, you can easily integrate your own arrow indicators into Scalper Inside Pro to quickly evaluate their statistics and profitability
FX Levels MT4
Daniel Stein
5 (2)
FX Levels: 모든 시장을 위한 뛰어난 정확도의 지지와 저항 간단 요약 통화쌍, 지수, 주식, 원자재 등 어떤 시장이든 믿을 만한 지지·저항 레벨을 찾고 싶나요? FX Levels 는 전통적인 “Lighthouse” 기법과 첨단 동적 접근을 결합해, 거의 보편적인 정확성을 제공합니다. 실제 브로커 경험을 반영하고, 자동화된 일별 업데이트와 실시간 업데이트를 결합함으로써 FX Levels 는 가격 반전 포인트를 파악하고, 수익 목표를 설정하며, 자신 있게 트레이드를 관리할 수 있게 돕습니다. 지금 바로 시도해 보세요—정교한 지지/저항 분석이 어떻게 여러분의 트레이딩을 한 단계 끌어올릴 수 있는지 직접 확인하세요! 1. FX Levels가 트레이더에게 매우 유용한 이유 뛰어난 정확도의 지지·저항 존 • FX Levels 는 다양한 브로커 환경에서도 거의 동일한 존을 생성하도록 설계되어, 데이터 피드나 시간 설정 차이로 인한 불일치를 해소합니다. • 즉, 어떤 브로커를 사용하
IX Power MT4
Daniel Stein
4.67 (6)
IX Power: 지수, 원자재, 암호화폐 및 외환 시장 통찰력을 발견하세요 개요 IX Power 는 지수, 원자재, 암호화폐 및 외환 시장의 강도를 분석할 수 있는 다목적 도구입니다. FX Power 는 모든 가용 통화 쌍 데이터를 사용하여 외환 쌍에 대해 가장 높은 정확도를 제공하는 반면, IX Power 는 기초 자산 시장 데이터에만 초점을 맞춥니다. 이로 인해 IX Power 는 비외환 시장에 이상적이며, 다중 쌍 분석이 필요하지 않은 간단한 외환 분석에도 신뢰할 수 있는 도구입니다. 모든 차트에서 매끄럽게 작동하며, 거래 결정을 향상시키기 위한 명확하고 실행 가능한 통찰력을 제공합니다. 1. IX Power가 트레이더에게 유용한 이유 다양한 시장 강도 분석 • IX Power 는 지수, 원자재, 암호화폐 및 외환 심볼의 강도를 계산하여 각 시장에 맞는 통찰력을 제공합니다. • US30, WTI, 금, 비트코인 또는 통화 쌍과 같은 자산을 모니터링하여 거래 기회를 발견
FX Power MT4 NG
Daniel Stein
4.94 (18)
FX Power: 통화 강세 분석으로 더 스마트한 거래 결정을 개요 FX Power 는 어떤 시장 상황에서도 주요 통화와 금의 실제 강세를 이해하기 위한 필수 도구입니다. 강한 통화를 매수하고 약한 통화를 매도함으로써 FX Power 는 거래 결정을 단순화하고 높은 확률의 기회를 발견합니다. 트렌드를 따르거나 극단적인 델타 값을 사용해 반전을 예측하고자 한다면, 이 도구는 귀하의 거래 스타일에 완벽히 적응합니다. 단순히 거래하지 말고, FX Power 로 더 스마트하게 거래하세요. 1. FX Power가 거래자에게 매우 유용한 이유 통화와 금의 실시간 강세 분석 • FX Power 는 주요 통화와 금의 상대적 강세를 계산하고 표시하여 시장 역학에 대한 명확한 통찰력을 제공합니다. • 어떤 자산이 앞서고 있고 어떤 자산이 뒤처지는지 모니터링하여 보다 현명한 거래 결정을 내릴 수 있습니다. 포괄적인 멀티 타임프레임 뷰 • 단기, 중기 및 장기 타임프레임에서 통화와 금의 강세를
FX Volume
Daniel Stein
4.59 (34)
FX Volume: 브로커 시각에서 바라보는 진짜 시장 심리 간단 요약 트레이딩 접근 방식을 한층 더 향상시키고 싶으신가요? FX Volume 는 소매 트레이더와 브로커의 포지션을 실시간으로 파악할 수 있게 해 줍니다. 이는 COT 같은 지연된 보고서보다 훨씬 빠릅니다. 꾸준한 수익을 추구하는 분이든, 시장에서 더 깊은 우위를 원하시는 분이든, FX Volume 을 통해 대규모 불균형을 찾아내고, 돌파 여부를 확인하며 리스크 관리를 정교화할 수 있습니다. 지금 시작해 보세요! 실제 거래량 데이터가 의사결정을 어떻게 혁신할 수 있는지 직접 경험해 보시기 바랍니다. 1. 트레이더에게 FX Volume이 매우 유익한 이유 탁월한 정확도를 지닌 조기 경보 신호 • 다른 사람들보다 훨씬 앞서, 각 통화쌍을 매수·매도하는 트레이더 수를 거의 실시간으로 파악할 수 있습니다. • FX Volume 은 여러 리테일 브로커에서 추출한 실제 거래량 데이터를 종합해 명확하고 편리한 형태로 제공하는
Gold Venamax MT4
Sergei Linskii
5 (1)
Gold Venamax   - 이것은 최고의 주식 기술 지표입니다. 지표 알고리즘은 자산의 가격 변동을 분석하고 변동성과 잠재적 진입 영역을 반영합니다.   표시기 기능: 이것은 편안하고 수익성 있는 거래를 위한 매직과 두 개의 추세 화살표 블록을 갖춘 슈퍼 지표입니다. 블록 전환을 위한 빨간색 버튼이 차트에 표시됩니다. 매직은 표시기 설정에서 설정되므로 서로 다른 블록을 표시하는 두 개의 차트에 표시기를 설치할 수 있습니다. Gold Venamax는 서로 다른 화살표 버퍼(GV 및 SD)를 사용하여 두 개의 차트에 배치할 수 있습니다. 이렇게 하려면 설정에서 다른 Magic을 선택해야 합니다. 예를 들어 하나는 Magic = 999이고 다른 하나는 Magic = 666입니다. 다음으로 차트의 빨간색 버튼으로 화살표 버퍼를 선택할 수 있습니다. 입력하기에 가장 좋은 신호 = 두 버퍼(GV 및 SD)의 신호 화살표 + 세 MA 라인(빨간색 또는 파란색)의 방향을 따릅니다 + TMA
Scalper Vault
Oleg Rodin
5 (28)
Scalper Vault 는 성공적인 스캘핑에 필요한 모든 것을 제공하는 전문 스캘핑 시스템입니다. 이 표시기는 외환 및 바이너리 옵션 거래자가 사용할 수 있는 완전한 거래 시스템입니다. 권장 시간 프레임은 M5입니다. 시스템은 추세 방향으로 정확한 화살표 신호를 제공합니다. 또한 상단 및 하단 신호와 Gann 시장 수준을 제공합니다.  이 시스템은 사용하기가 매우 쉽습니다. 원하는 시장 지역의 화살표만 따라가면 됩니다. 엑시트는 가격이 적정 수준에 도달하거나 시장의 고점 또는 저점 신호가 나타날 때 수행됩니다.  표시기는 PUSH 알림을 포함한 모든 유형의 경고를 제공합니다. 인디케이터 구매 후 연락주세요. 내 개인 거래 권장 사항과 훌륭한 보너스 지표를 무료로 공유합니다! 나는 당신에게 행복하고 유익한 거래를 기원합니다!
Advanced Supply Demand
Bernhard Schweigert
4.91 (294)
현재 33% 할인! 초보자나 전문 트레이더를 위한 최고의 솔루션! 이 보조지표는 우리가 다수의 독창적 기능과 새로운 공식을 통합한 독특하고 고품질이며 저렴한 거래 도구입니다. 이 업데이트를 통해 이중 시간대를 표시할 수 있습니다. 더 높은 TF를 표시할 수 있을 뿐만 아니라 차트 TF와 더 높은 TF 모두를 표시할 수 있습니다: 중첩 영역 표시. 모든 Supply Demand 트레이더들이 좋아할 것입니다. :) 중요한 정보 공개 Advanced Supply Demand의 잠재력을 극대화하려면 다음을 방문하십시오. https://www.mql5.com/ko/blogs/post/720245   진입 또는 목표의 명확한 트리거 포인트를 정확히 찾아냄으로 해서 거래가 어떻게 개선될지 상상해 보십시오. 새로운 알고리즘을 기반으로 매수자와 매도자 간의 잠재적인 불균형을 훨씬 더 쉽게 분간할 수 있습니다. 왜냐하면 가장 강한 공급영역과 가장 강한 수요 영역과 과거에 어떻게 진행 되었는지를(이전
Currency Strength Exotics
Bernhard Schweigert
4.87 (31)
현재 20% 할인! 초보자 또는 전문가 트레이더를 위한 최고의 솔루션! 이 표시기는 Exotic Pairs Commodities, Indexes 또는 Futures와 같은 기호에 대한 통화 강도를 표시하는 데 특화되어 있습니다. 금, 은, 석유, DAX, US30, MXN, TRY, CNH 등의 진정한 통화 강도를 보여주기 위해 9번째 줄에 모든 기호를 추가할 수 있습니다. 이것은 독특하고 고품질이며 저렴한 거래 도구입니다. 우리는 많은 독점 기능과 새로운 공식을 통합했습니다. 새로운 추세 또는 스캘핑 기회의 정확한 트리거 포인트를 정확히 찾아낼 수 있기 때문에 거래가 어떻게 개선될지 상상해 보십시오. 사용 설명서: 여기를 클릭 https://www.mql5.com/en/blogs/post/708876 모든 시간대에 작동합니다. TREND를 빠르게 확인할 수 있습니다! 새로운 기본 알고리즘을 기반으로 설계되어 잠재적인 거래를 더욱 쉽게 식별하고 확인할 수 있습니다. 8개의
Easy Breakout
Mohamed Hassan
5 (9)
After your purchase, feel free to contact me for more details on how to receive a bonus indicator called VFI, which pairs perfectly with Easy Breakout for enhanced confluence!   Easy Breakout is a powerful price action trading system built on one of the most popular and widely trusted strategies among traders: the Breakout strategy ! This indicator delivers crystal-clear Buy and Sell signals based on breakouts from key support and resistance zones. Unlike typical breakout indicators, it levera
Chart Patterns All in One
Davit Beridze
4.68 (19)
"Chart Patterns All in One"을 데모 모드에서 사용해보고 보너스를 받아보세요. 데모 모드에서 사용해본 후 메시지를 보내주시면 보너스를 드립니다. 구매 후 댓글을 남기시면 고품질의 인디케이터 8개를 보너스로 받으실 수 있습니다. Chart Patterns All-in-One 지표는 트레이더가 기술 분석에서 흔히 사용되는 다양한 차트 패턴을 시각화하는 데 도움을 줍니다. 이 지표는 잠재적인 시장 움직임을 식별하는 데 도움이 되지만, 수익성을 보장하지는 않습니다. 구매 전에 데모 모드에서 지표를 테스트하는 것이 좋습니다. 현재 할인 : "Chart Patterns All in One" 지표 50% 할인 중. 포함된 패턴 : 1-2-3 패턴 : 세 가지 주요 지점(고점 또는 저점)을 사용하여 시장 반전을 감지합니다. 매수 : 연속된 두 저점 이후, 이전 고점보다 낮은 고점이 발생할 때. 매도 : 연속된 두 고점 이후, 이전 저점보다 높은 저점이 발생할 때. 시각화 :
System Trend Pro
Aleksandr Makarov
5 (2)
System Trend Pro - This is the best trend trading indicator!!! You can get this indicator for free -  Quantum Entry PRO The indicator no repaint!!!   The indicator has   MTF   mode, which adds confidence to trading on the trend (   no repaint   ). How to trade? Everything is very simple, we wait for the first signal (big arrow), then wait for the second signal (small arrow) and enter the market in the direction of the arrow. (See screens 1 and 2.) Exit on the opposite signal or take 20-30 pips
Golden Trend Indicator
Noha Mohamed Fathy Younes Badr
4.9 (10)
Golden Trend indicator  is The best indicator for predicting trend movement this indicator never lags and never repaints and never back paints    and give  arrow buy and sell    before the candle appear  and it will help you and  will make your trading decisions clearer its work on all currencies and  gold and crypto and all time frame This unique  indicator uses very secret algorithms to catch the  trends, so you can trade using this indicator and see the trend clear on charts  manual guide and
우선적으로, 이 거래 도구는 전문적인 거래에 이상적인 비-다시 그리기 및 지연되지 않는 지표입니다.  온라인 강좌, 사용자 매뉴얼 및 데모. 스마트 가격 액션 컨셉트 인디케이터는 신규 및 경험 많은 트레이더 모두에게 매우 강력한 도구입니다. Inner Circle Trader Analysis 및 Smart Money Concepts Trading Strategies와 같은 고급 거래 아이디어를 결합하여 20가지 이상의 유용한 지표를 하나로 결합합니다. 이 인디케이터는 스마트 머니 컨셉트에 중점을 두어 대형 기관의 거래 방식을 제공하고 이동을 예측하는 데 도움을 줍니다.  특히 유동성 분석에 뛰어나 기관이 어떻게 거래하는지 이해하는 데 도움을 줍니다. 시장 트렌드를 예측하고 가격 변동을 신중하게 분석하는 데 탁월합니다. 귀하의 거래를 기관 전략에 맞추어 시장의 동향에 대해 더 정확한 예측을 할 수 있습니다. 이 인디케이터는 시장 구조를 분석하고 중요한 주문 블록을 식별하고 다양한
Trend Screener
STE S.S.COMPANY
4.78 (93)
트렌드 표시기, 트렌드 트레이딩 및 필터링을 위한 획기적인 고유 솔루션, 하나의 도구 안에 내장된 모든 중요한 트렌드 기능! Forex, 상품, 암호 화폐, 지수 및 주식과 같은 모든 기호/도구에 사용할 수 있는 100% 다시 칠하지 않는 다중 시간 프레임 및 다중 통화 표시기입니다. 기간 한정 특가: 지원 및 저항 스크리너 지표는 단 100달러에 평생 제공됩니다. (원래 가격 50 달러) (제안 연장) Trend Screener는 차트에 점이 있는 화살표 추세 신호를 제공하는 효율적인 지표 추세 추종 지표입니다. 추세 분석기 표시기에서 사용할 수 있는 기능: 1. 트렌드 스캐너. 2. 최대 이익 분석이 있는 추세선. 3. 추세 통화 강도 측정기. 4. 경고가 있는 추세 반전 점. 5. 경고가 있는 강력한 추세 점. 6. 추세 화살표 Trend Screener Indicator가 있는 일일 분석 예, 일일 신호 성능...등은 여기에서 찾을 수 있습니다.   여기를 클릭하십시오. L
Legacy of Gann
Pavel Zamoshnikov
4.83 (12)
The indicator very accurately determines the levels of the possible end of the trend and profit fixing. The method of determining levels is based on the ideas of W.D.Gann, using an algorithm developed by his follower Kirill Borovsky. Extremely high reliability of reaching levels (according to K. Borovsky  - 80-90%) Indispensable for any trading strategy – every trader needs to determine the exit point from the market! Precisely determines targets on any timeframes and any instruments (forex, met
TPSpro RFI Levels
Roman Podpora
4.85 (26)
지침        러시아   -         영어       표시기와 함께 사용하는 것이 좋습니다   .       -       TPSpro   트렌드 프로 -   MT4 버전         거래에서 핵심 요소는 거래 상품을 매수 또는 매도하기로 결정하는 구역 또는 수준입니다. 주요 업체가 시장에서 자신의 존재를 숨기려는 시도에도 불구하고, 그들은 필연적으로 흔적을 남깁니다. 우리의 과제는 이러한 흔적을 식별하고 올바르게 해석하는 방법을 배우는 것이었습니다. 주요 기능:: 판매자와 구매자를 위한 활성 영역을 표시합니다! 이 지표는 매수 및 매도를 위한 모든 올바른 초기 임펄스 레벨/존을 보여줍니다. 진입점 검색이 시작되는 이러한 레벨/존이 활성화되면 레벨의 색상이 바뀌고 특정 음영으로 채워집니다. 또한 상황을 보다 직관적으로 이해하기 위해 화살표가 나타납니다. 더 높은 시간대의 레벨/존 표시(MTF 모드) 더 높은 시간 간격을 사용하여 레벨/존을 표시하는 기능을 추가했습니다.
Gold Stuff
Vasiliy Strukov
4.86 (247)
Gold Stuff는 금을 위해 특별히 설계된 추세 지표이며 모든 금융 상품에서도 사용할 수 있습니다. 표시기가 다시 그려지지 않고 지연되지 않습니다. 권장 기간 H1. 표시기에서 완전 자동 Expert Advisor EA Gold Stuff를 작동합니다. 내 프로필에서 찾을 수 있습니다. 설정 및 개인 보너스를 받으려면 구매 후 즉시 저에게 연락하십시오!   강력한 지원 및 트렌드 스캐너 표시기의 무료 사본을 받으실 수 있습니다. 메시지를 보내주세요. 나!   설정 화살표 그리기 - 켜기 끄기. 차트에 화살표 그리기. 경고 - 가청 경고를 끕니다. 이메일 알림 - 켜기 끄기. 이메일 알림. Puch-notification - 켜기 끄기. 푸시 알림. 다음으로 색 영역을 조정합니다. Gold Stuff는 금을 위해 특별히 설계된 추세 지표이며 모든 금융 상품에서도 사용할 수 있습니다. 표시기가 다시 그려지지 않고 지연되지 않습니다. 권장 기간 H1. 표시기에서 완전 자동
Bull versus Bear
Mohamed Hassan
4.47 (17)
Send us a message after your purchase to receive more information on how to get your  BONUS  for FREE  that works in great combination with Bull vs Bear ! Bull versus Bear is an easy-to-use Forex indicator that gives traders clear and accurate signals based on clear trend retests . Forget about lagging indicators or staring at charts for hours because  Bull vs Bear provides real-time entries with no lag and no repaint, so you can trade with confidence. Bull vs Bear  helps you enter trades durin
Advanced Currency IMPULSE with ALERT
Bernhard Schweigert
4.9 (484)
현재 31% 할인!! 초보자 또는 전문가 트레이더를 위한 최고의 솔루션! 이 지표는 우리가 독점 기능과 비밀 공식을 통합했기 때문에 독특하고 고품질이며 저렴한 거래 도구입니다. 단 하나의 차트로 28개 통화 쌍 모두에 대한 경고를 제공합니다. 새로운 추세 또는 스캘핑 기회의 정확한 트리거 포인트를 정확히 찾아낼 수 있기 때문에 거래가 어떻게 개선될지 상상해 보십시오! 새로운 기본 알고리즘을 기반으로 구축되어 잠재적인 거래를 훨씬 더 쉽게 식별하고 확인할 수 있습니다. 이는 통화의 강세 또는 약세가 가속되는지 여부를 그래픽으로 표시하고 가속 속도를 측정하기 때문입니다. 자동차의 속도계처럼 생각하면 됩니다. 가속화할 때 Forex 시장에서 동일한 일이 분명히 더 빠르게 발생합니다. 즉, 반대 방향으로 가속화되는 통화를 페어링하면 잠재적으로 수익성 있는 거래를 식별한 것입니다. 통화 모멘텀의 수직선과 화살표가 거래를 안내합니다! 역동적인 Market Fibonacci 23 레벨은
PZ Harmonacci Patterns
PZ TRADING SLU
3.17 (6)
Trade smarter, not harder: Empower your trading with Harmonacci Patterns Special Offer: Purchase now to receive free bonuses worth $165! (Read more for details) This is arguably the most complete harmonic price formation auto-recognition indicator you can find for the MetaTrader Platform. It detects 19 different patterns, takes fibonacci projections as seriously as you do, displays the Potential Reversal Zone (PRZ) and finds suitable stop-loss and take-profit levels. [ Installation Guide | Upda
Automated Trendlines
Georgios Kalomoiropoulos
5 (16)
추세선은 외환 거래에서 기술적 분석의 가장 필수적인 도구입니다. 불행히도, 대부분의 거래자는 올바르게 그리지 않습니다. 자동 추세선 표시기는 시장의 추세 움직임을 시각화하는 데 도움이 되는 진지한 거래자를 위한 전문 도구입니다. 추세선 강세 추세선과 약세 추세선에는 두 가지 유형이 있습니다. 상승 추세에서 Forex 추세선은 가격 움직임의 가장 낮은 스윙 포인트를 통해 그려집니다. 최소 두 개의 "최저 저점"을 연결하면 추세선이 생성됩니다. 하락 추세에서 추세선은 가격 움직임의 가장 높은 스윙 포인트를 통해 그려집니다. 최소 두 개의 "최고 최고점"을 연결하면 추세선이 생성됩니다. 추세선이 깨질 때? 강세 추세선은 약세 양초가 강세 추세선 아래에서 닫히고 양초의 고점이 추세선 위에 있을 때 깨집니다. 약세 추세선은 강세 양초가 약세 추세선 위로 마감되고 양초 저점이 추세선 아래에 있을 때 깨집니다. 추세선이 삭제되면? 강세 추세선은 전체 양초가 강세 추세선 아래에
Advanced Currency Strength28 Indicator
Bernhard Schweigert
4.9 (652)
현재 26% 할인 초보자 또는 전문가 트레이더를 위한 최고의 솔루션! 이 지표는 우리가 독점 기능과 새로운 공식을 통합했기 때문에 독특하고 고품질이며 저렴한 거래 도구입니다. 단 하나의 차트로 28 Forex 쌍의 통화 강도를 읽을 수 있습니다! 새로운 추세 또는 스캘핑 기회의 정확한 트리거 포인트를 정확히 찾아낼 수 있기 때문에 거래가 어떻게 개선될지 상상해 보십시오. 사용 설명서: 여기를 클릭  https://www.mql5.com/en/blogs/post/697384 그것이 첫 번째, 원본입니다! 쓸모없는 지망생 클론을 사지 마십시오. 더 스페셜  강력한 통화 모멘텀을 보여주는 하위 창의 화살표 GAP가 거래를 안내합니다! 기본 또는 호가 통화가 과매도/과매도 영역(외부 시장 피보나치 수준)에 있을 때 개별 차트의 기본 창에 경고 표시가 나타납니다. 통화 강도가 외부 범위에서 떨어질 때 풀백/반전 경고. 교차 패턴의 특별 경고 추세를 빠르게 볼 수 있는 다중 시간
Stratos Pali
Michela Russo
5 (1)
Stratos Pali Indicator   is a revolutionary tool designed to enhance your trading strategy by accurately identifying market trends. This sophisticated indicator uses a unique algorithm to generate a complete histogram, which records when the trend is Long or Short. When a trend reversal occurs, an arrow appears, indicating the new direction of the trend. Important Information Revealed Leave a review and contact me via mql5 message to receive My Top 5 set files for Stratos Pali at no cost! Dow
TPSproTREND PrO
Roman Podpora
4.68 (25)
TPSpro TREND PRO는   시장을 자동으로 분석하여 추세와 각 변화에 대한 정보를 제공할 뿐만 아니라 다시 그리지 않고도 거래에 진입할 수 있는 신호를 제공하는 추세 지표입니다! 지표는 각 양초를 사용하여 개별적으로 분석합니다. 다른 임펄스를 언급합니다 - 업 또는 다운 임펄스. 통화, 암호화폐, 금속, 주식, 지수 거래의 정확한 진입점! 버전 MT5                   표시기에 대한 전체 설명       표시기   와 함께 사용하는 것이 좋습니다   -   RFI LEVELS 주요 기능: 렌더링 없이 정확한 입력 신호! 신호가 나타나면 관련성은 유지됩니다! 이는 신호를 제공한 후 변경하여 예금 자금 손실을 초래할 수 있는 다시 그리기 지표와의 중요한 차이점입니다. 이제 더 큰 확률과 정확도로 시장에 진입할 수 있습니다. 화살표가 나타난 후 목표에 도달(이익실현)하거나 반전 신호가 나타날 때까지 캔들을 색칠하는 기능도 있습니다. STOP LOSS / TAKE
TW Trend Scalper Indicator: The TW Scalper Shoot는 최신 거래 전략과 인공지능 기술을 활용하여 독특한 거래 경험을 제공합니다. 이 제품은 두 가지 뚜렷한 신호 범주를 제공하여 스캘퍼 트레이더의 다양한 요구를 충족합니다. 오늘 이 특별한 제품을 테스트하고 트렌드 스캘퍼가 되는 독특한 경험을 시작하세요. 또한, $37 상당의 제품을 선물로 받으세요. 신호 범주: 1. 장기적이고 안전한 신호: 이러한 신호는 가격 행동 전략(스마트 머니 규칙), 피보나치 수준, 지원 및 저항 수준, 이동 평균을 사용하여 식별됩니다. 이 범주의 신호는 빨간색과 파란색 화살표 및 특정 목표와 함께 표시되어 장기적이고 신뢰할 수 있는 거래를 원하는 트레이더에게 이상적입니다. 2. 스캘핑 신호(전문 스캘퍼용): 앞서 언급한 전략 외에도 이러한 신호는 독점적인 Trade Wizards 지표 공식과 AI 노이즈 감소 방법도 활용합니다. 스캘핑 신호는 신뢰할 수 있는
TrendMaestro
Stefano Frisetti
5 (3)
note: this indicator is for METATRADER4, if you want the version for METATRADER5 this is the link:  https://www.mql5.com/it/market/product/108106 TRENDMAESTRO ver 2.4 TRENDMAESTRO recognizes a new TREND in the bud, he never makes mistakes. The certainty of identifying a new TREND is priceless. DESCRIPTION TRENDMAESTRO identifies a new TREND in the bud, this indicator examines the volatility, volumes and momentum to identify the moment in which there is an explosion of one or more of these data a
제작자의 제품 더 보기
Sure Reversal
Abdulkarim Karazon
5 (1)
SURE REVERSAL is a histogram overbought/oversold type indicator that gives key reversal points that indicates a bull or bear market movment this indicator is fusion between moving average and the rsi indicator ,this indicator is non repainter , and is not delayed . Parameters : Ma period  Ma Method Ma Price Sure Period (Rsi) Sure Price (Rsi) ==============
Supreme HmaSignal
Abdulkarim Karazon
4 (1)
The Supreme HmaSignal indicator is an indicator for trend trading , its main character is the hull moving average colored line , and secondary is buy and sell arrows , arrows are fair but the main focus is on the colored hma , this indicator does not repaint or back paint or delay its signals. if you like this indicator please check my Supreme Trendhisto:   here   , and my Supreme Diamond indicator :   here Parameters:  HMA Period HMA Smoothing HMA Price (close/open) Signal Period (Arrows)
FREE
Supreme StochRsi
Abdulkarim Karazon
Rsi indicator and Stochastic Combined into one indicator , the Supreme StochRsi doesnt repaint / Back-paint / delay. can be used as overbought oversold strategy , or trend following on 50 level cross. if you like this indicator please check my Supreme Trendhisto: here , and my Supreme Diamond indicator : here ========================================================================= Parameters : Stochastic K and D value , Stochastic period Rsi Period Rsi price ====================================
FREE
TMA StochasticLimited
Abdulkarim Karazon
TMA Stochastic is an indicator based on stochastic oscillator and tma bands indicator , this indicator is based on a reversal strategy . Recommended time frame : 15 and above  Recommended settings : lower values for scalping , higher values for swing trading  WORKS ONLY ON EURUSD , GET THE FULL VERSION :  https://www.mql5.com/en/market/product/108378 ======================================================================= Parameters :  tma history : how many bars back to show tma bands on stochas
FREE
Supreme Direction
Abdulkarim Karazon
4 (1)
Supreme Direction is an indicator based on market volatility , the indicator draws a a two lined channel with 2 colors above and below price , this indicator does not repaint or back-paint and signal is not delayed. how to use : long above purple line , short below golden line. Parameters : channel period ========================================================
FREE
Supreme Stoploss
Abdulkarim Karazon
Supreme Stoploss is an indicator for metatrader 4 that is based on the ATR indicator , it gives stoploss/takeprofit as lines drawn above and below the price , this indicator does not repaint/back paint and is not delayed. can be used to determine the stop loss or take profit of a trade using ATR value multiplied by the number set by user. ====================================================================================================== Parameters : ATR SL period : ATR period identity : leave
FREE
Ambitious Dragon EA
Abdulkarim Karazon
5 (1)
Ambitious Dragon EA는 EURUSD 1M 기간 거래를 위해 특별히 설계된 전문 자문입니다. 그 뒤에 있는 논리는 혼합 전략을 사용한 개시 주문을 기반으로 합니다. 이는 EA가 계산된 승패율과 함께 헤징 논리를 사용하므로 EA가 혼합 전략이기 때문에 거래를 개시할지 아니면 건너뛸지 결정한다는 의미입니다. 즉, 공격적인 설정 파일을 사용하면 엄청난 DD를 가질 수 있고 안전 모드 설정을 사용하면 더 나은 DD를 갖게 됩니다. 최소 입금액 : 3000$ ================================== 설정: 혼합 거래:ON/OFF... 매도 후 매수만 개시하고 매수 거래 후 매도를 개시합니다(매도 거래 또는 매수 거래는 연속적으로 실행되지 않음) LOT1: 고정된 로트 크기 오토로트 : ON/OFF 자동 위험: 거래당 최대 로트 증가 TP IN PONTS SL 포인트 -WIN-USD: 지분이 X%에 도달하면 모든 공개 거래를 닫습니다. 시작
Binary Stalker
Abdulkarim Karazon
3.67 (3)
---> 가격이 인상된 후 다음 5명의 구매자에게 10% 할인 <--- 바이너리 스토커는 만료가 있는 모든 바이너리 옵션 브로커에 대해 호출을 보내고 신호를 보내는 adx 기반 표시기입니다. 표시기는 다시 그려지지 않으며 다음을 표시하는 대시보드와 함께 제공됩니다: 1-승률 - 2-승자 - 3- 패자 - 4 - 연속 승자 - 5. 연속 패자, 권장 기간 : 언제든지 호출: 열려 있는 새 캔들에 녹색 점이 표시되고, 만료는 해당 캔들의 끝에 나타납니다. 넣기: 열려 있는 새 캔들에 주황색 점이 표시되고, 만료는 해당 캔들의 끝에 나타납니다. 어떤 경우에는 변동성이 높은 동안 신호가 지연된다는 점에 유의하십시오. 나중에 양초 동안 adx 교차가 발생할 수 있으므로 해당 신호를 건너뛰십시오. ===========================================================================
Bands Sniper
Abdulkarim Karazon
5 (1)
현재 가격으로 10개만 복사하면 이후 가격은 90$가 됩니다. 화살표가 있는 엔벨로프 및 tma를 기반으로 하는 Bands Sniper 표시기는 동적 지지 및 저항을 표시하고 매수 및 매도 화살표로 진입 신호를 제공하므로 다목적 표시기입니다. 기본 설정은 상반기 기준이며 전체 안내는 구매 후 문의하시기 바랍니다. 참가 규정: 매수: 1.양봉 모두 아래에서 캔들 종가          2.양초는 2개의 위쪽 화살표(황금색 화살표와 주황색 화살표)를 사용하여 2개의 밴드 내에서 다시 닫힙니다. 매도: 1. 양봉 모두 위에서 캔들 종가          2.양초는 2개의 아래쪽 화살표(황금색 화살표와 주황색 화살표)를 사용하여 2개의 밴드 내에서 다시 닫힙니다. TP 1 : 중간 밴드 라인 TP 2 : 반대 밴드 화살표 아래 SL 커플 핍 권장 기간은 15분 이상입니다.
SuperOsma Arrow
Abdulkarim Karazon
SuperOsma Arrow는 매수 및 매도 신호를 제공하는 슈퍼트렌드 osma 기반 지표이며, 지표는 다시 그려지지 않으며 신호 통계를 보여주는 대시보드와 함께 제공됩니다. 권장 기간: 15세 이상 매수: 매수 화살표가 열려 있는 막대에 표시되고, 차트에 그려진 대로 tp 및 sl을 설정합니다. 매도: 매도 화살표가 열린 막대에 표시되고, 차트에 그려진 대로 tp 및 sl을 설정합니다. ===============================     대시보드에는 내역 신호 정보가 표시됩니다.     1.승률 %     2.승자는 몇 명인가     3. 패자가 얼마나 많은가     4.연속 우승자 수     5.연패자 수     6. 핍 단위의 이익 ============================     매개변수:     1.슈퍼트렌드 1주기     2.슈퍼 트렌드 1 승수     3. 슈퍼트렌드 2기     4.슈퍼 트렌드 2 승수     5. 슈퍼트렌드 3기
BinaryMartini
Abdulkarim Karazon
macd와의 3ma 교차를 기반으로 하는 바이너리 거래에 대한 지표로, 오픈 바에서 매수 및 매도 신호를 제공하며 다시 칠하거나 다시 칠하지 않습니다. 이 지표는 마틴게일 거래를 위해 만들어졌기 때문에 높은 승률에 초점을 맞추지 않으며, 지표는 연속으로 가장 낮은 손실 신호 수에 중점을 둡니다. 전략 : 최소 예치금은 1000 단위이며, 1 단위로 거래를 시작합니다(거래 규모는 1000 자본당 1 단위입니다) 현재 신호가 손실되면 다음 신호에서 거래 크기를 두 배로 늘립니다. 연속으로 최대 7개의 손실 신호가 있는 표시기 설정만 사용합니다. 지난 10000개의 양초에 대해(x개 양초에 대한 내역 거래를 표시하기 위해 설정에서 입력할 수 있는 숫자입니다) -권장 타이머 프레임 : 모두 - 사용기한 : 운영기간과 동일 매개변수: 1.빠른마 기간 2.빠른 MA형 3.느린마 시대 4..슬로우마타입 5.트렌드 마 시대 6.트렌드 MA타입 7.바 개수(신호 및 백테스트 결과를 표시하는 데 사
Statistic Arrow
Abdulkarim Karazon
3개의 이동 평균 교차 전략을 기반으로 Statistic Arrow는 차트에 그려진 포인트의 tp 및 sl을 사용하여 매수 및 매도 신호를 제공하며, 승률과 종료된 거래 수, 승리한 수, 획득한 수를 보여주는 백 테스트 대시보드와 함께 제공됩니다. 손실, 최종 이익 창출, 표시기는 BAR OPEN의 tp 및 sl 측면을 따라 화살표를 인쇄하고 사전 경고를 제공합니다. ========================================================================================================================== 매개변수는 설정 스크린샷에 표시되고 설명됩니다.
Ambitious Donchian
Abdulkarim Karazon
Ambitious Donchian EA can be downloaded from comment section but it need the ambitious donchian indicator to work. Ambitious Donchian is a Donchian Channel and XO histogram based indicator that gives buy and sell signals in form of up and down arrows with tp and sl as objects on chart. features : 1. Tp and Sl for each signal , the tp and sl can be selected as based on points or ATR value from indicator settings. 2.backtesting dashboard : the dashboard shows the following according to your input
Supreme Arrow
Abdulkarim Karazon
Supreme Arrow는 RSI 및 구분 표시기 전략을 기반으로 하는 mt4용 화살표 표시기입니다. 이 전략은 인기 있는 시장에 적합할 뿐만 아니라 특히 스캘핑에 사용되는 경우 다양한 시장에서도 작동합니다. 권장 기간 : 언제든지 권장 추가 기능: 200 SMA Supreme Arrow 표시기는 다시 칠하거나 다시 칠하지 않으며 신호가 지연되지 않습니다. --------------------------------------------------------------------------------------------------------------------------------------------------
Supreme Channel
Abdulkarim Karazon
TV atr 채널 표시기를 기반으로 하는 Supreme 채널 표시기는 거래자에게 현재 추세의 잠재적 반전에 대한 힌트를 제공하는 동적 지지 및 저항 밴드입니다. 권장 시간 : 15M 이상 권장 설정: 기본값이지만 거래자는 필요에 따라 변경할 수 있습니다. =========================================================== 매개변수: 1. 채널 길이 2. 대역폭(두 채널 라인 사이의 거리) 3.Multiplier(ATR 값 승수) 4. 채널 표시(참/거짓) =========================================================================================
Supreme Diamond
Abdulkarim Karazon
5 (1)
Supreme Diamond는 반전 및 추세 거래 전략을 기반으로 하는 다중 시간대 지표이며 지표는 다시 칠하거나 백 페인트하지 않으며 신호가 지연되지 않으며 지표는 경고와 함께 매수 및 매도 신호를 제공합니다. 표시기에는 (최고의 항목을 다이아몬드로 사용) 입력에서 선택할 수 있는 2가지 신호 모드가 있습니다. true로 설정되면 표시기는 일반 모드 신호를 필터링하고 가능한 최상의 신호를 다이아몬드 신호로 제공합니다. 다이아몬드 모드에서는 다이아몬드 신호를 조정할 수 없습니다. . 일반 모드는 (다이아몬드로 최상의 항목 사용) 입력이 false로 설정된 경우 스크린샷에 표시된 것처럼 밴드 설정과 볼린저 밴드 전략으로 일반 모드가 활성화됩니다. 최상의 성능을 보여주기 때문에 다이아몬드 모드 사용을 적극 권장합니다. 슈프림 다이아몬드 거래 방법: 지표에서 신호를 받으면 거래를 시작하고, sl을 이전 저점/고점으로 설정하고, tp를 최소 RRR 1:1로 설정하세요. 권장 기간 :
Supreme EmaCross
Abdulkarim Karazon
Supreme EmaCross는 두 개의 지수 이동 평균 교차를 기반으로 하는 지표이며, 에마 교차를 기반으로 매수 및 매도 화살표를 생성하고 신호 모양에 대한 경고를 제공하며 표시기가 다시 칠되지 않거나 후면 페인트 및 화살표가 지연되지 않으며 표시기가 빠릅니다. 에마 기간 변경 패널에서는 트레이더가 지표 설정으로 이동하지 않고도 에마의 값을 변경할 수 있으며 패널은 이동 가능합니다. ================================================= ==== 매개변수: 빠른 기간 : 빠른 에마 기간 느린 기간 : 느린 에마 기간 알림 및 경고 설정 에마 라인 켜기/끄기 에마 라인 색상 에마 십자형 화살표 켜기/끄기 에마 십자가 화살표 색상 ================================================= =========
Supreme TrendHisto
Abdulkarim Karazon
Supreme TrendHisto는 하향 및 상향 추세 신호를 제공하는 추세 표시기이며 표시기는 히스토그램 역할을 하며 표시기는 다시 그리기/뒤로 그리기/지연을 수행하지 않습니다. 전략 매수 거래: 히스토그램이 0.65 이상 교차하면 매수 거래가 시작됩니다. 청산의 경우 히스토그램이 0.70 레벨에 도달하면 퇴장하거나 웰에서 퇴장할 수 있습니다. 매도 거래: 히스토그램이 -0.65 아래로 교차하면 매수 거래가 시작됩니다. 청산의 경우 히스토그램이 -0.70 수준에 도달하면 청산하거나 웰에서 청산할 수 있습니다. =============================== 권장 기간 : 언제든지 권장기간 : 기본값 =========================================== 매개변수: 1.지표 기간(스캘핑의 경우 더 낮고 스윙 트레이딩의 경우 높음) 2. 계산 유형(닫기/열기/낮음...등) 3.max bar(표시할 기록 수) 4.빠른 모드(진실 유지
Supreme MaColor
Abdulkarim Karazon
Supreme MaColor is an indicator based on moving average indicator , it gives up and down trend colors and it has different moving averages types and has multi time frame function , this indicator does not repaint/back-paint/delay signal. =================================================================================== Parameters : Timeframe (what time frame to use to draw Supreme Ma) Ma Period  Ma Type Ma Price (close/open...etc) Average Shift (Ma shift) Multi Time frame on/off ===============
Supreme MaChannel
Abdulkarim Karazon
Supreme MaChannel is an indicator based on moving averages , the indicator gives dynamic support and resistance in bands format. Recommended for reversal traders , add it to your reversal strategy. Parameters :  Supreme MA Period : ma periods Supreme MA Price : close/open/high/low..etc Supreme MA Type : Simple/Exponential/Smoothed/Linear Weighted Deviation : bands deviation the distance between the two band lines
Supreme Entry
Abdulkarim Karazon
Supreme Entry is an arrow signal based indicator that give buy and sell signals , the indicator gives buy/sell signals with alert on candle open/close (depends what you set it to be from inputs) . this indicator does not repaint/back-paint and signal is not delayed. Strategy : Open buy same moment buy arrow appear and open sell same moment a sell arrow appear , close on well or on opposite signal . Recommended Time frame : 15 and above this arrow is good as ? : addon to your existing strategy ,
Stoch Arrow
Abdulkarim Karazon
STOCH ARROW is a long short arrow signal type indicator that is based on standard stochastic oscillator this indicator has 3 methods of giving long and short signal that are as follow : 1.whenever stochastic lines cross 2.when a cross happens in overbought and oversold zones (short arrow on overbought zone cross , long arrow on oversold zone cross) 3.when stochastic lines leave overbought and oversold zones (short arrow on leave from overbought zone  , long arrow leave on oversold zone) this ind
Supreme Trend
Abdulkarim Karazon
Supreme Trend is a reversal/continuation type Oscillator type indicator that is based on Moving average and stochastic indicators this indicator can be used in two methods : Reversal Method : short when golden arrow appear after arrows were above upper level (e.g 70) Reversal Method : long when Purple arrow appear after arrows were below lower level (e.g 30) Trend Method : long when arrows cross above 50 level line , short when arrows cross below 50 level line. use higher ma and stochastic peri
TMA Stochastic
Abdulkarim Karazon
TMA 스토캐스틱은 스토캐스틱 오실레이터와 tma 밴드 지표를 기반으로 하는 지표이며, 이 지표는 반전 전략을 기반으로 합니다. 권장 시간대 : 15세 이상 권장 설정 : 스캘핑은 낮은 값, 스윙 트레이딩은 높은 값 ================================================= ====================== 매개변수: tma 히스토리: 확률론적으로 tma 밴드를 표시하기 위해 얼마나 많은 막대가 다시 표시됩니까? K 기간(확률론적) D 기간(확률론적) S 기간(확률론적) TMA 기간 TMA 교대 Extreme tma 편차 : 원거리 대역의 편차 tma 편차 : 내부 밴드의 편차 ----------------------------------------------------------------
FireArrow
Abdulkarim Karazon
FireArrow is an arrow signal based indicator that give buy and sell signals with tp and sl levels , the indicator gives buy/sell signals with alert on candle close along side tp and sl levels on chart for each signal this indicator does not repaint/back-paint and signal is not delayed. Strategy : Open buy same moment buy arrow appear and open sell same moment a sell arrow appear , set tp as drawn on chart along side sl. Recommended Time frame : 15 and above this arrow is good as ? : addon t
MartingaleArrow
Abdulkarim Karazon
Martingale Arrow는 martingale 바이너리 옵션 거래를 위해 설계된 화살표 유형 mt4 표시기입니다. 이 화살표는 바 열기/인트라 바에 인쇄되고 경고를 제공합니다. 사용 방법: 화살표가 나타나는 순간 거래를 개시하세요. 거래가 성공했다면 다음 신호를 기다렸다가 동일한 로트를 거래하세요. 다음 신호에서 거래가 두 배의 로트를 잃고 신호가 승리할 때까지 계속 그렇게 하는 경우 재설정하고 첫 번째 거래 로트로 거래하세요. 권장 기간: 모두 최소 보증금 : 200 단위. 이 표시기 라이브는 다음을 수행하지 않습니다: 다시 칠하기/뒤로 칠하기 ------------------------------------- ------------- 매개변수: 표시 기간: 변경 시 다른 신호를 제공합니다. 지표 가격/유형 과매수/과매도 수준 경고 입력 화살표 스타일 ==========================================
BinarySniperZ
Abdulkarim Karazon
바이너리 스나이퍼(Binary Sniper)는 바이너리 옵션 거래에 대한 매수 및 매도 신호를 제공하는 mt4 지표입니다. 이 지표는 다른 접근 방식을 가지고 있습니다. 바이너리 옵션 거래에 대해 이 표시기는 신호를 다시 그리거나 지연시키지 않습니다. 참가 규정: 1. CALL (BUY) , 빨간색 캔들이 빨간색이 된 후 바이너리 스나이퍼 바 색상이 녹색으로 닫힐 때.(첫 번째 색상 반전) 2. PUT (SELL) , 녹색 캔들이 녹색이 ​​된 후 빨간색으로 바이너리 스나이퍼 막대 색상으로 닫힐 때(첫 번째 색상 반전) . 이 지표는 가격 움직임/거래량 및 캔들 패턴에 적용되므로 설정이 제한됩니다. ============================================
StalkeR Arrow
Abdulkarim Karazon
5 (3)
StalkeR Arrow는 바 오픈/인트라 바에서 매수 및 매도 신호를 제공하는 화살표 표시기입니다. 이 표시기는 가격 행동 패턴 및 프랙탈을 기반으로 합니다. 이 지표는 각 매수 및 매도 신호에 대해 tp와 sl을 제공하며, tp와 sl은 각 신호 위와 아래에 선 형태로 표시되며 새로운 신호가 형성될 때까지 연장됩니다. 이 표시기에는 기록 신호의 승/패 통계를 제공하는 백테스팅 패널/대시보드가 ​​있으며, 이 표시기는 다시 칠하거나 다시 칠하지 않습니다. 매개변수: StalkeR 기간: 화살표 기간, 숫자가 높을수록 더 적은 수의 신호가 제공됩니다. 스프레드: 포인트 단위의 스프레드 값을 사용하여 패널에서 승패를 계산합니다. 정지손실 ATR x : atr 곱셈의 SL 값 Takeprofit ATR x : atr 곱셈의 TP 값 ATR 기간 : tp 및 sl을 기반으로 계산하는 데 사용되는 atr 기간 TP/SL 라인 색상 및 너비 화살표 색상 및 너비 패널
Renko Star
Abdulkarim Karazon
Renko Star는 렌코 차트를 거래하도록 설계된 mt4 화살표 유형 지표입니다. 이 지표에는 거래자에게 승률 및 승리 포인트와 같은 유용한 정보를 알려주는 백테스팅 대시보드가 ​​있으며 atr x 곱셈에서 tp 및 sl도 제공합니다. 바 오픈 또는 인트라 바에 신호가 있고 신호가 제공된 정확한 가격을 표시하는 노란색 표시가 있습니다. 이 표시기를 사용하는 방법은 표시기에 의해 제공된 화살표에 따라 매수 또는 매도를 개시하고 tp를 설정하는 것입니다. 그리고 표시기에 의해 제공된 대로 표시기 설정을 가지고 놀면 더 좋거나 최악의 결과가 나올 수 있으므로 신뢰할 수 있는 대시보드에서 좋은 결과를 얻을 때까지 설정을 변경해야 합니다. 이 표시기는 다시 칠하거나 다시 칠하지 않습니다. 매개변수: atr tp : atr을 기준으로 한 tp 값 atr sl : atr을 기반으로 한 sl 값 atr 기간 별 기간 스타 필터 History : 백테스트할 히스토리의 양 Spread : 계산
SuperEntryx
Abdulkarim Karazon
Super Entry는 ATR 값을 기반으로 변경 및 조정할 수 있는 길고 짧은 신호만 측면 tp 및 sl 수준에 제공하는 올인원 화살표 유형 표시기입니다. 이 표시기는 승률 및 기타 통계를 보여주는 백테스팅 패널을 제공합니다. 어느 정도의 정확도를 기대할 수 있는지 명확하게 보여줍니다. 이 표시기는 다시 칠하거나 다시 칠하지 않으며 신호는 지연 없이 열린 바에 표시됩니다. ========================================================================= 매개변수: 설정: 표시기 tp 및 sl 값과 기록 및 신호 기간 알림 : 알림/이메일/푸치 디스플레이 설정 : 화살표 색상/tp 및 sl 라인 색상 및 너비/화살표 유형 ============================================================
필터:
리뷰 없음
리뷰 답변