Super Trend Trading View 4
- 지표
- Mohammad Taher Halimi Tabrizi
- 버전: 1.0
- 활성화: 5
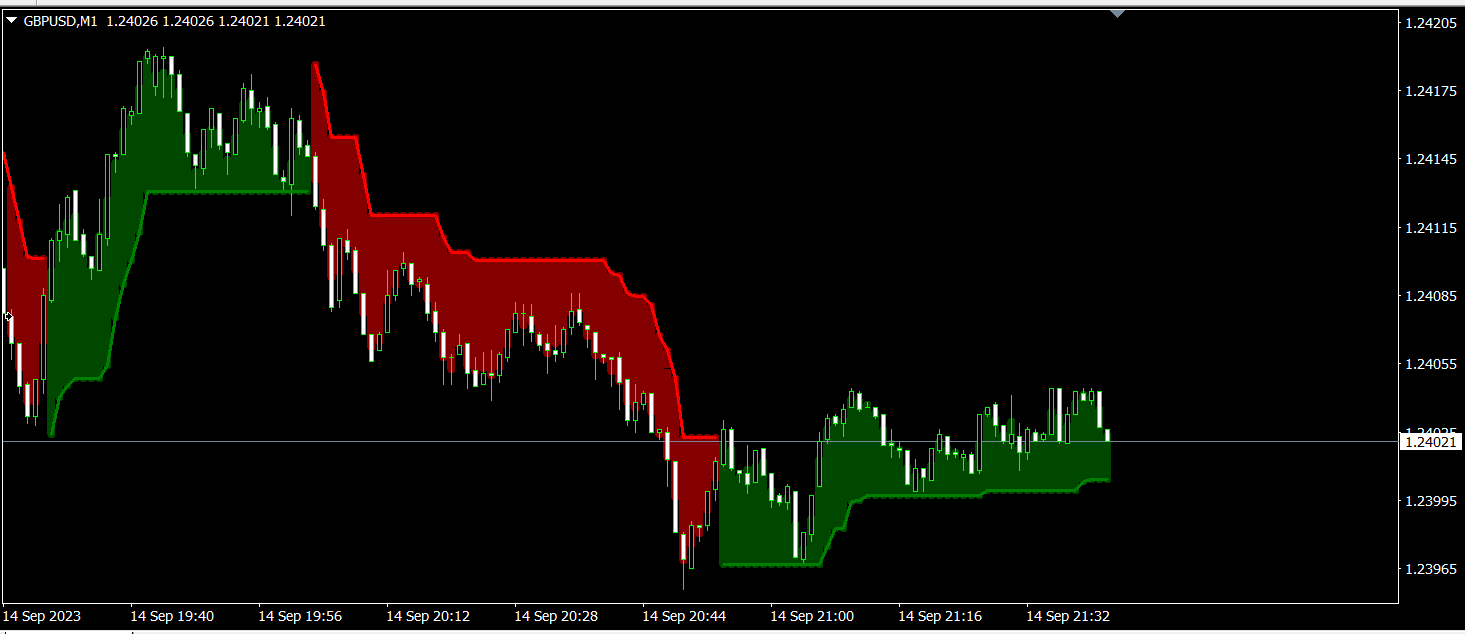
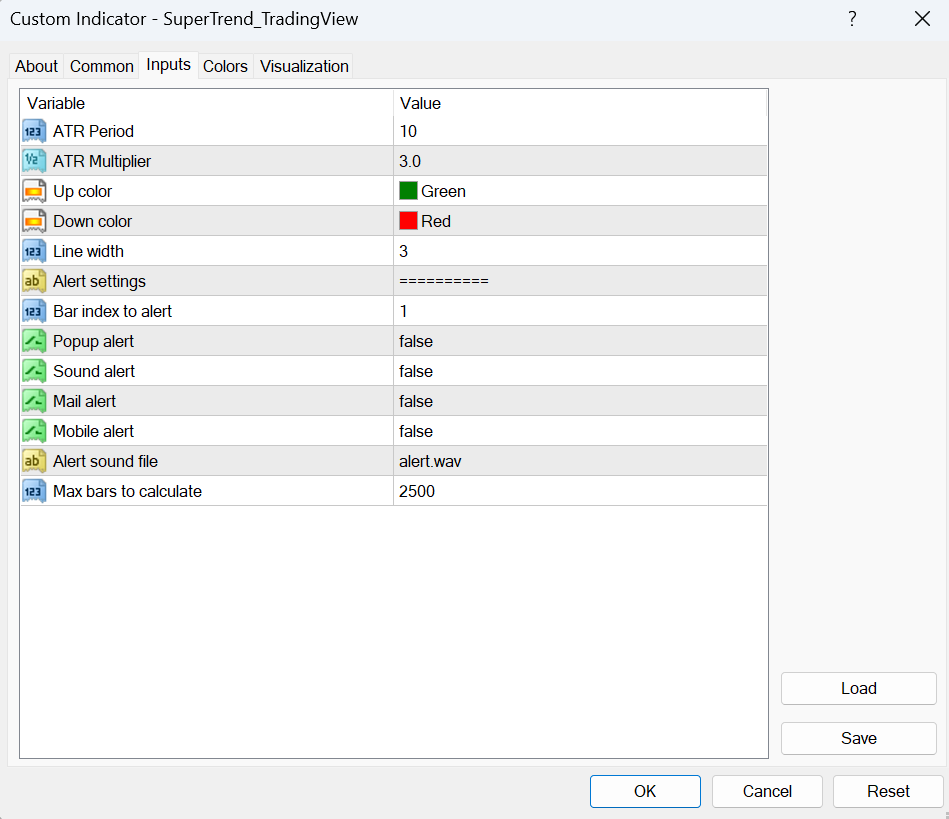
The SuperTrend indicator is a popular technical analysis tool used by traders and investors to identify trends in the price of a financial instrument, such as a stock, currency pair, or commodity. It is primarily used in chart analysis to help traders make decisions about entering or exiting positions in the market.