MostTr
- 지표
- Ahmet Metin Yilmaz
- 버전: 1.0
- 활성화: 5
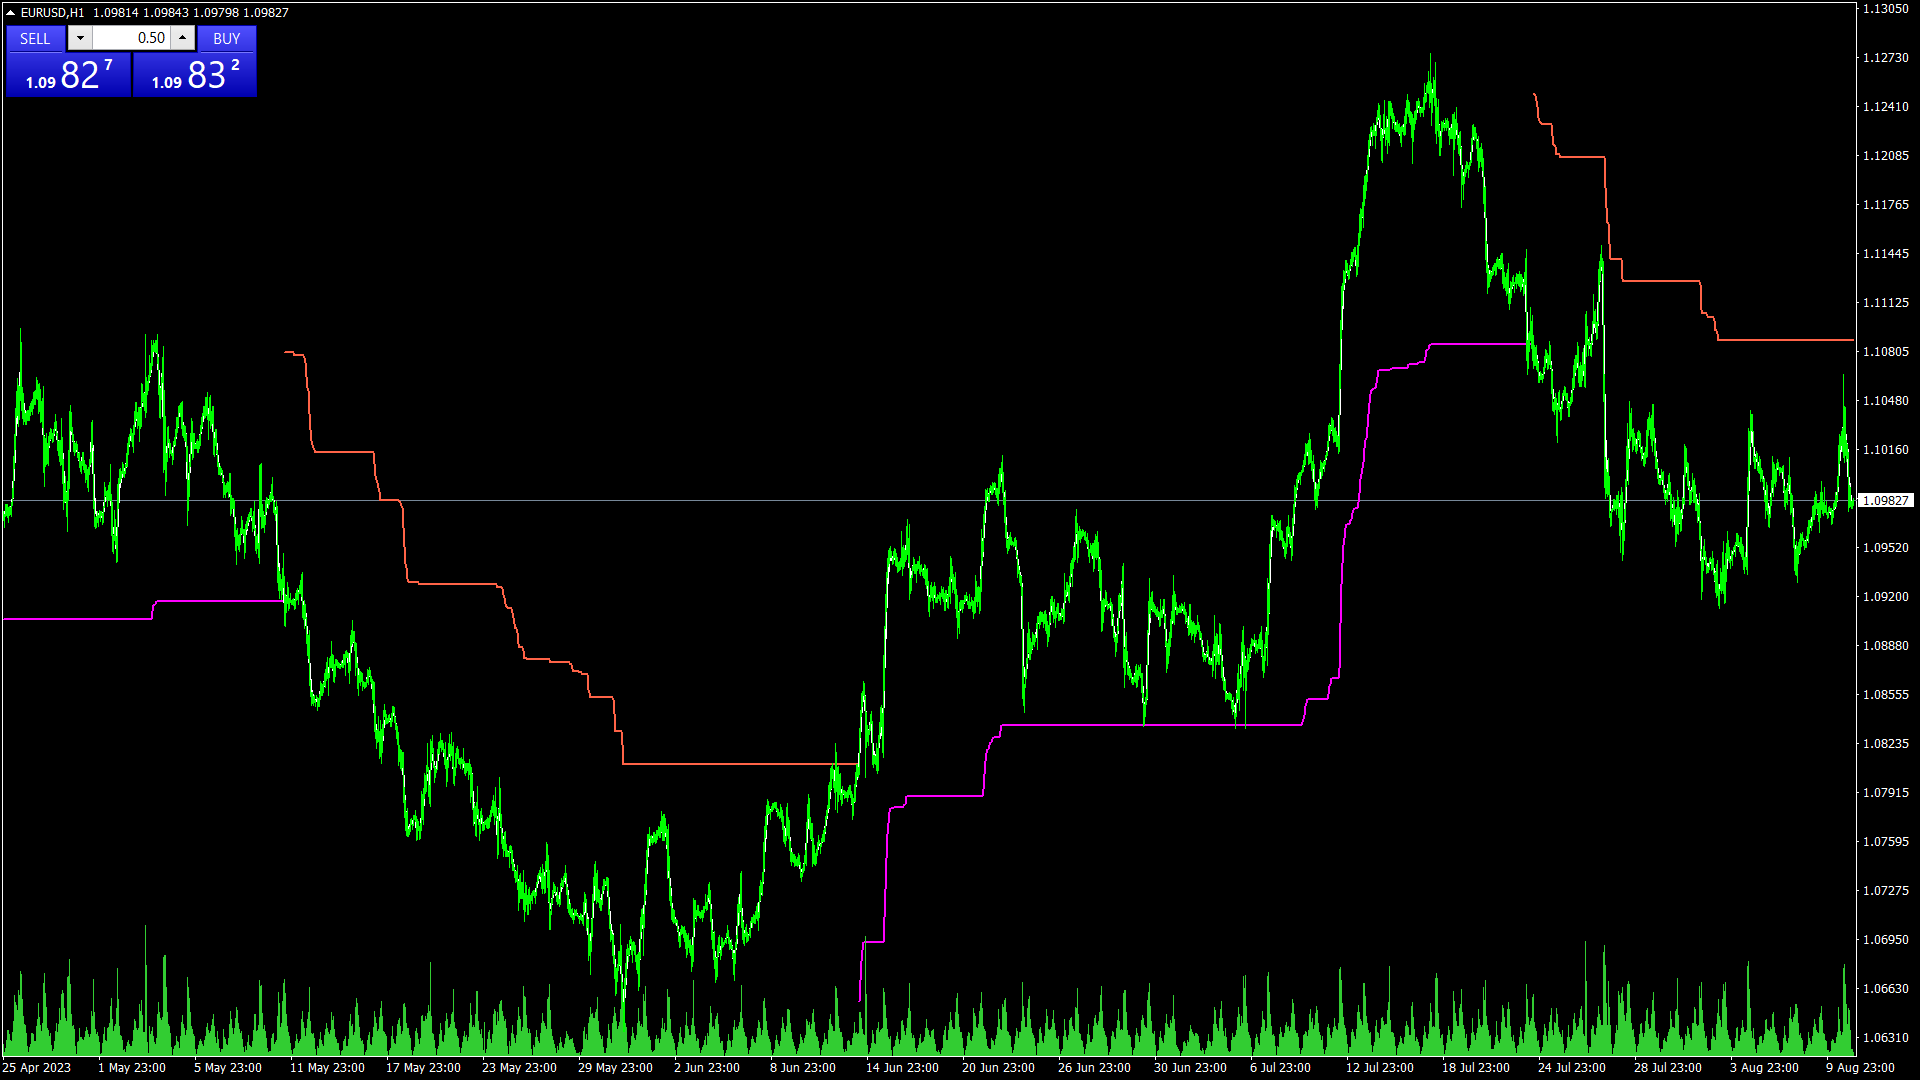
MOST 지표는 다른 플랫폼, 특히 주식 및 지수에 사용되는 매우 인기 있는 지표입니다. 기본은 이동 평균과 고저 수준입니다. 주식과 지수의 경우 백분율 입력을 2로 사용하고 외환 상품의 경우 1 - 1.5로 사용하는 것이 적절할 수 있습니다. 각 악기에 대해 직접 조정할 수 있습니다. 사용하기 쉽고 간단하며 단순한 표시기입니다. 1시간 및 일일 차트에서 더 일반적입니다. 지금은 MT4 플랫폼에 대해서만 편집했는데, 앞으로 MT5에 대한 요청이 있으면 게시하겠습니다.
MOST 지표는 다른 플랫폼, 특히 주식 및 지수에 사용되는 매우 인기 있는 지표입니다. 기본은 이동 평균과 고저 수준입니다. 주식과 지수의 경우 백분율 입력을 2로 사용하고 외환 상품의 경우 1 - 1.5로 사용하는 것이 적절할 수 있습니다. 각 악기에 대해 직접 조정할 수 있습니다. 사용하기 쉽고 간단하며 단순한 표시기입니다. 1시간 및 일일 차트에서 더 일반적입니다. 지금은 MT4 플랫폼에 대해서만 편집했는데, 앞으로 MT5에 대한 요청이 있으면 게시하겠습니다.