Volume Plus and VSA Signals for MT5
- 지표
- Huu Hai Ngo
- 버전: 1.15
- 업데이트됨: 30 4월 2024
- 활성화: 10
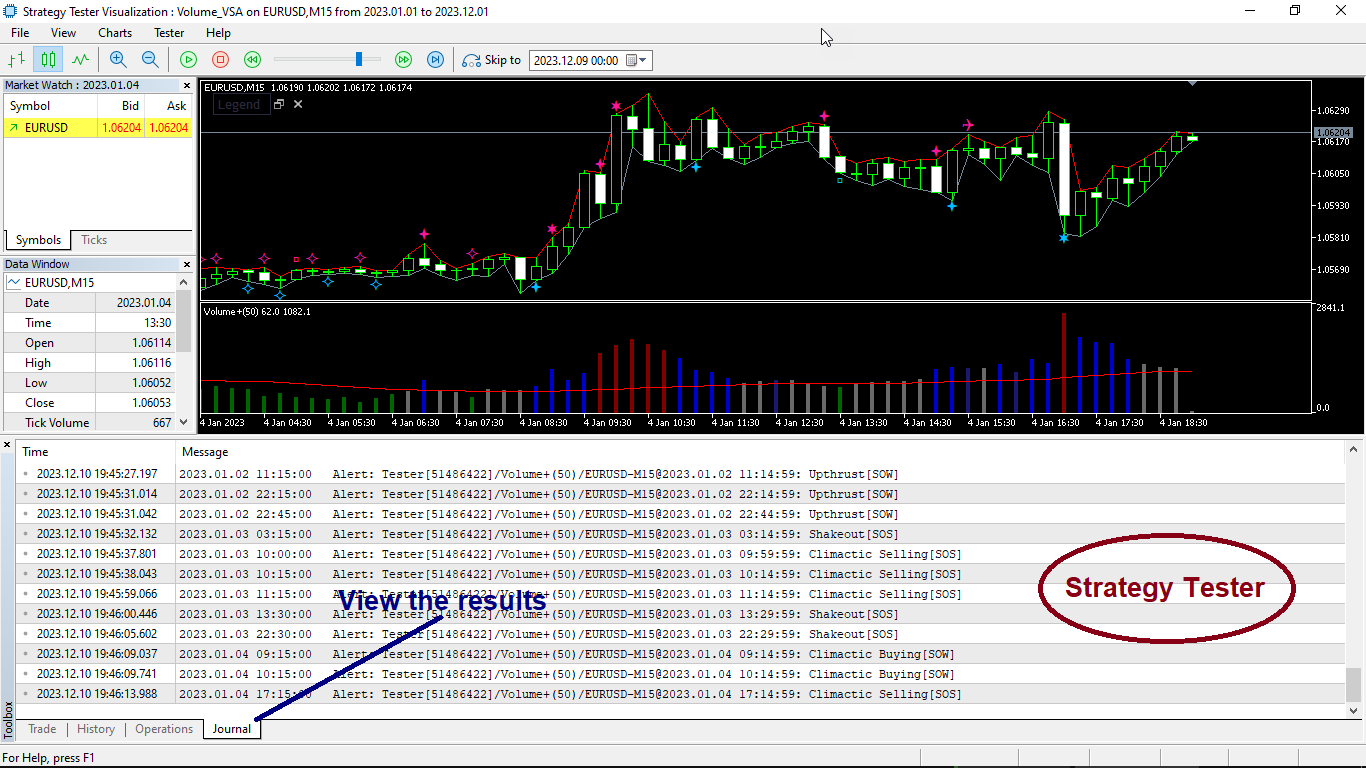
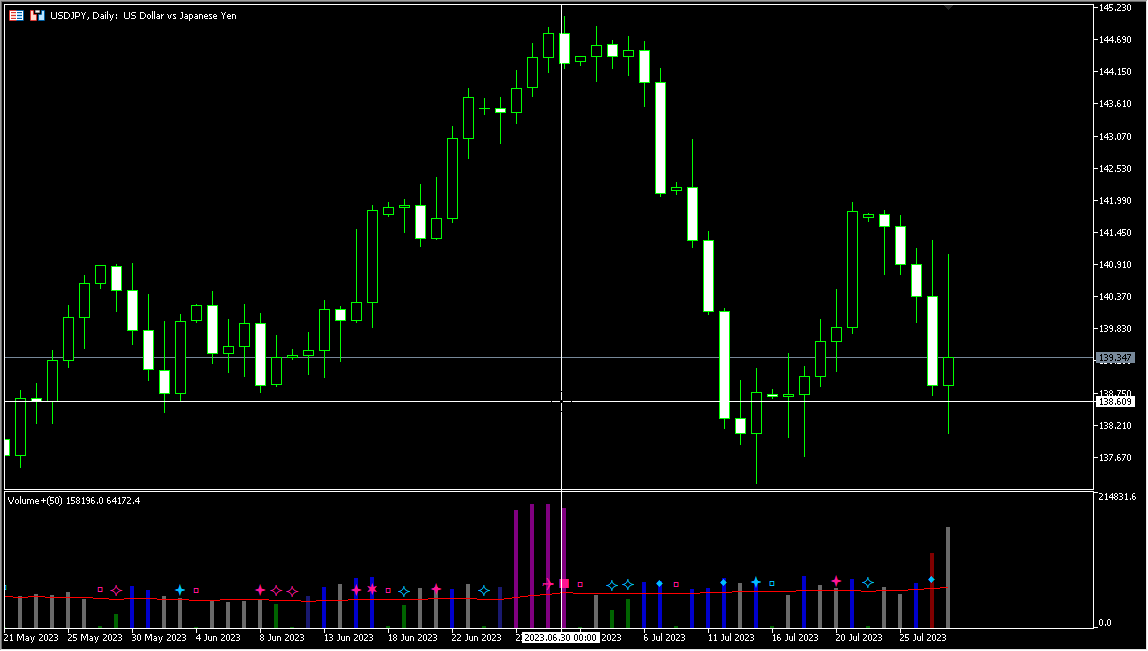
The Volume+ and VSA Signals indicator for MT5 is based on the Volume Spread Analysis (VSA) methodology to provide the signals. The signals are displayed at closing of bars on the main window or subwindow in the form of symbols. The symbols are not repainting.
The indicator produces a signal on an individual bar and this signal is not buy or sell signal. When a minor trend goes in the opposite direction of a major trend, there are sequences of major trend-following signals that give a higher probability of a minor trend change.
What is VSA?
See www.VolumeSpreadAnalysis.com
Features
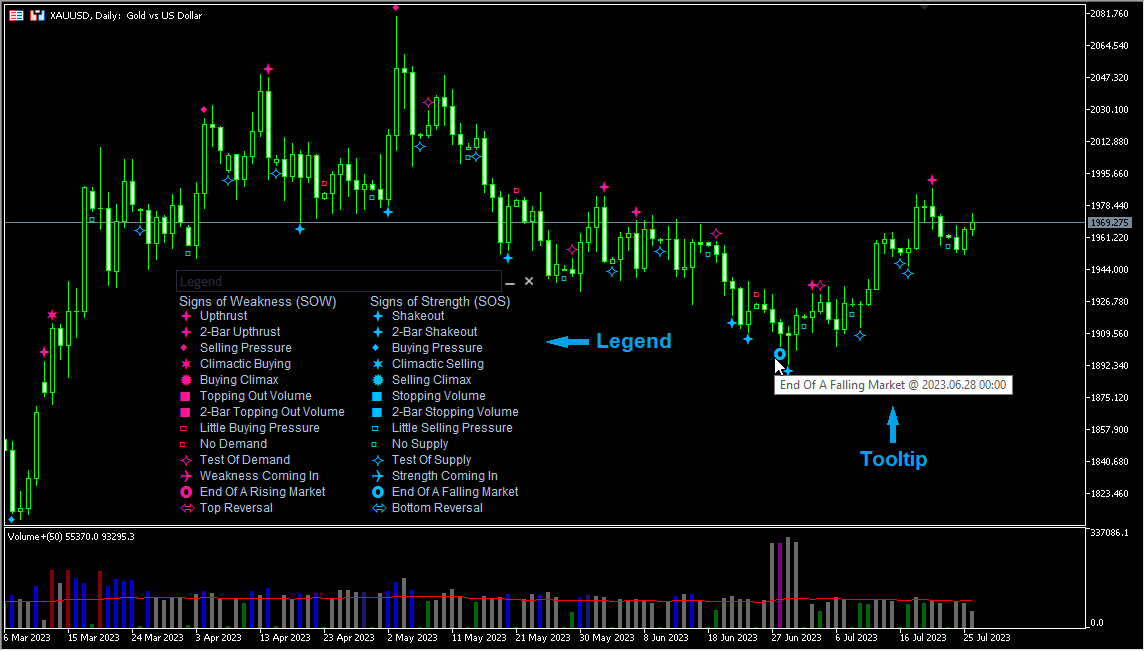
- Each signal has a tooltip that displays the name and time of appearance.
- All types of alerts (sound, pop-up, email, mobile push notification) are available.
- Works with all pairs (forex, metals, indices, stocks, cryptos,...).
- Works on all timeframes (21).
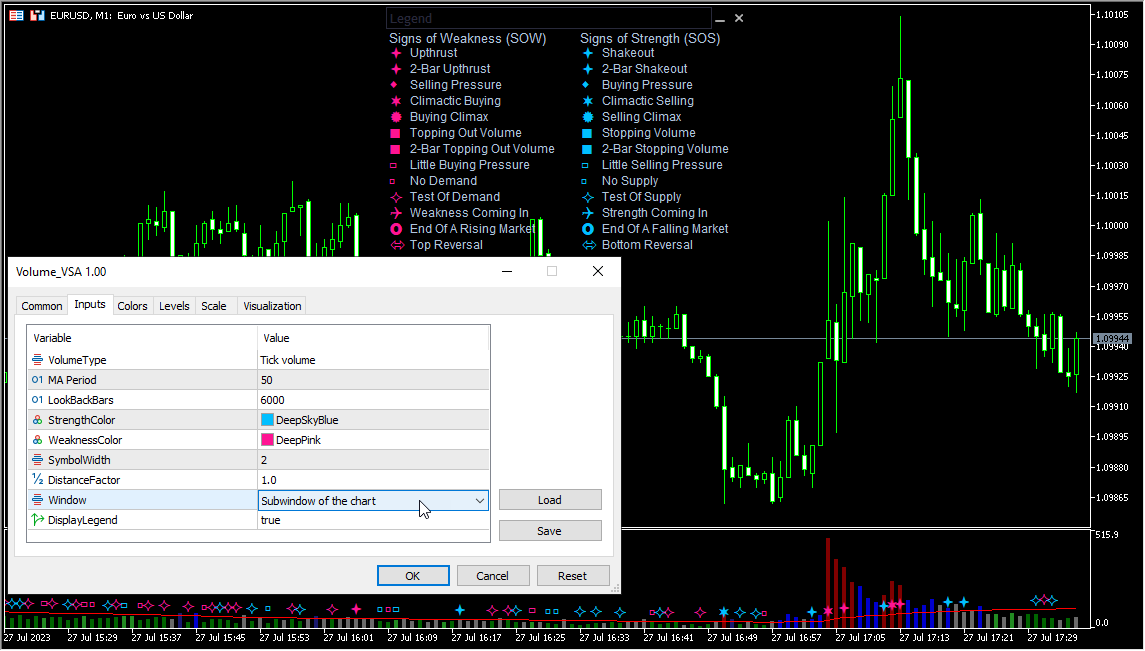
Legend
The legend details are provided in the screenshots.
The indicator contains 13 SOWs (Signs of Weakness) and 13 SOSs (Signs of Strength).
| SOW | SOS |
|---|---|
| Upthrust | Shakeout |
| 2-Bar Upthrust | 2-Bar Shakeout |
| Selling Pressure | Buying Pressure |
| Climactic Buying | Climactic Selling |
| Buying Climax | Selling Climax |
| Topping Out Volume | Stopping Volume |
| 2-Bar Topping Out Volume | 2-Bar Stopping Volume |
| Little Buying Pressure | Little Selling Pressure |
| No Demand | No Supply |
| Test Of Demand | Test Of Supply |
| Weakness Coming In | Strength Coming In |
| End Of A Rising Market | End Of A Falling Market (Bag Holding) |
| Top Reversal | Bottom Reversal |
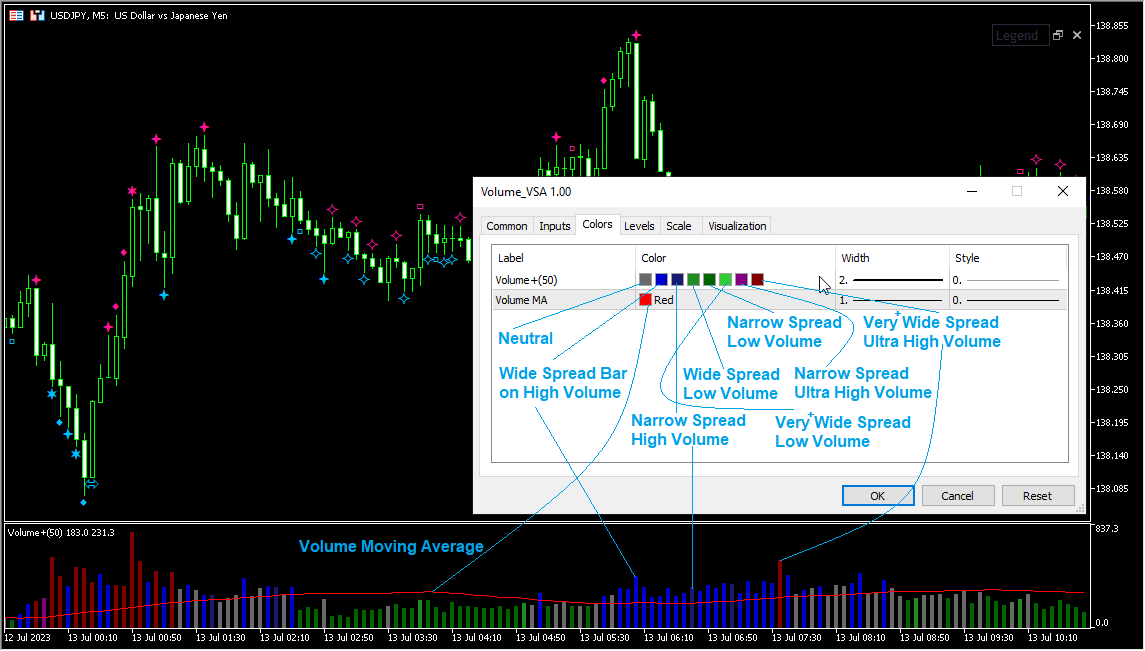
The Volume+ indicator can be effectively used for detecting imbalances in supply and demand. It improves on the typical volume histogram by coloring the bars. Bar colors (colors are customizable):
| Neutral | DimGray |
| Wide Spread Bar on High Volume | MediumBlue |
| Narrow Spread, High Volume | MidnightBlue |
| Wide Spread, Low Volume | ForestGreen |
| Narrow Spread, Low Volume | DarkGreen |
| Very/Ultra Wide Spread, Low Volume | LimeGreen |
| Narrow Spread, Ultra High Volume | Purple |
| Very/Ultra Wide Spread, Ultra High Volume | Maroon |
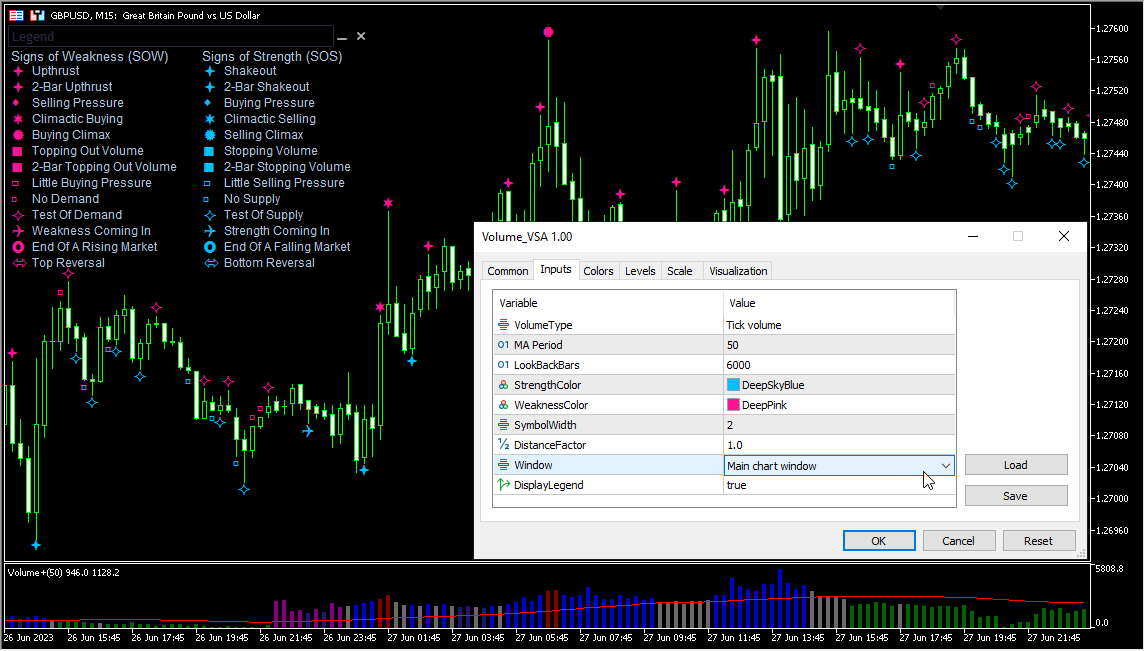
Input parameters
- VolumeType - Volume type (tick or real)
- MA Period - Period for the moving average.
- LookBackBars - Bars to analyze.
- StrengthColor - Color of the SOS symbols.
- WeaknessColor - Color of the SOW symbols.
- SymbolWidth - Width of the symbols.
- DistanceFactor - Distance rate for the symbols .
- Window - Select the window to display the symbols.
- DisplayLegend - Display the legend.
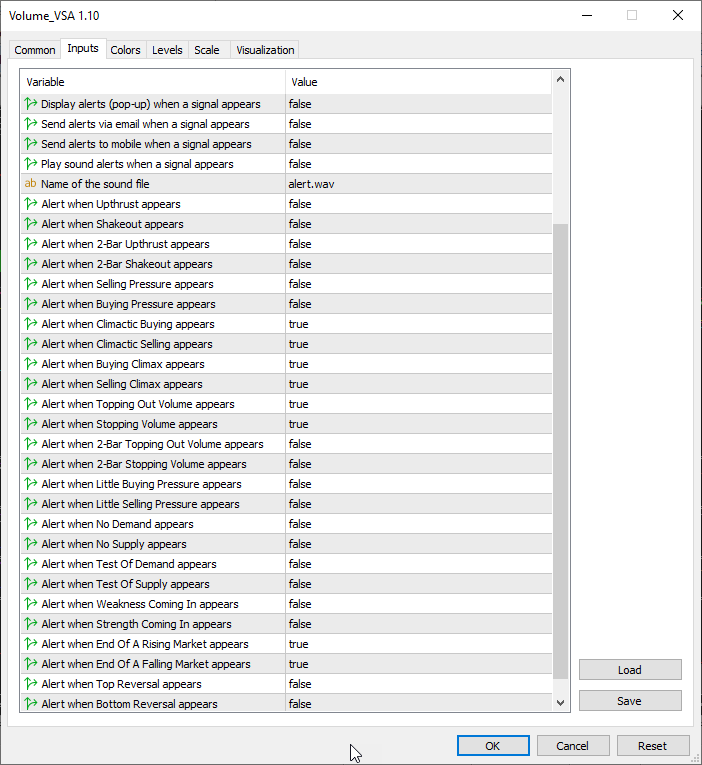
- StrictMode - Use strict conditions to recognize signals.
- Display alerts (pop-up) when a signal appears.
- Send alerts via email when a signal appears.
- Send alerts to mobile when a signal appears.
- Play sound alerts when a signal appears.
- Name of the sound file.
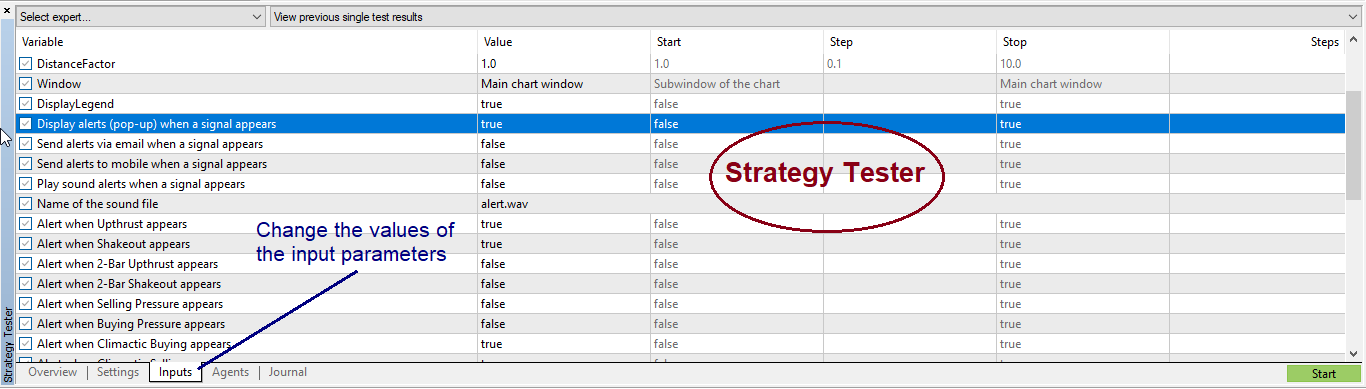
- Select the signals that will be alerted when they appear
- Show/hide signals on the chart.
Thank you for making life easier for VSA traders.