MCP Stochastic strategies panel
- 지표
- Anton Iudakov
- 버전: 1.0
- 활성화: 5
Multicurrency indicator in table format. Signals appear with confirmation, no repaints. In the settings, you can select the number of candles/bars on which the signal will still be displayed so that the trader takes it into account and does not miss it. The indicator works on the current (open) timeframe. Notifications come for an open instrument. In the indicator settings, you can choose 1 of 4 Stochastic strategies
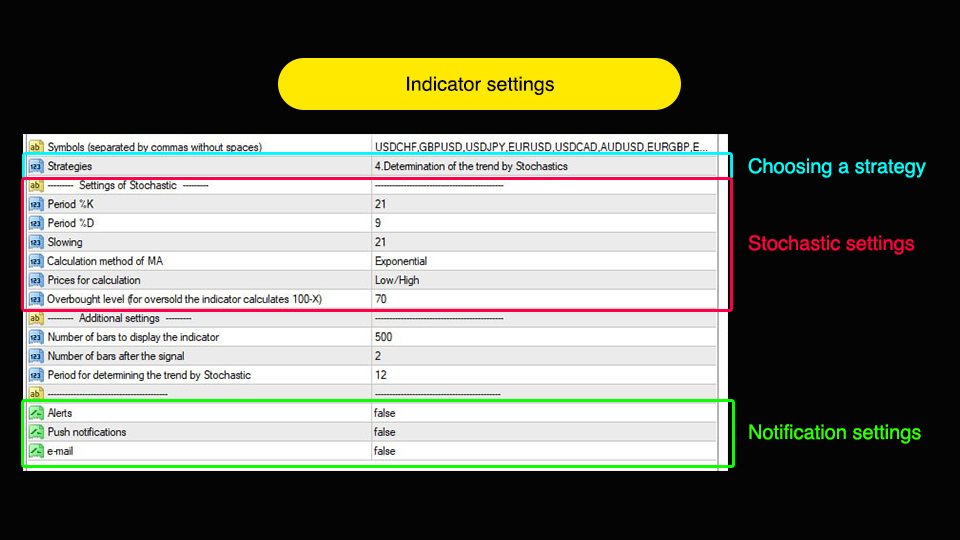
Strategies (represented in screenshots):
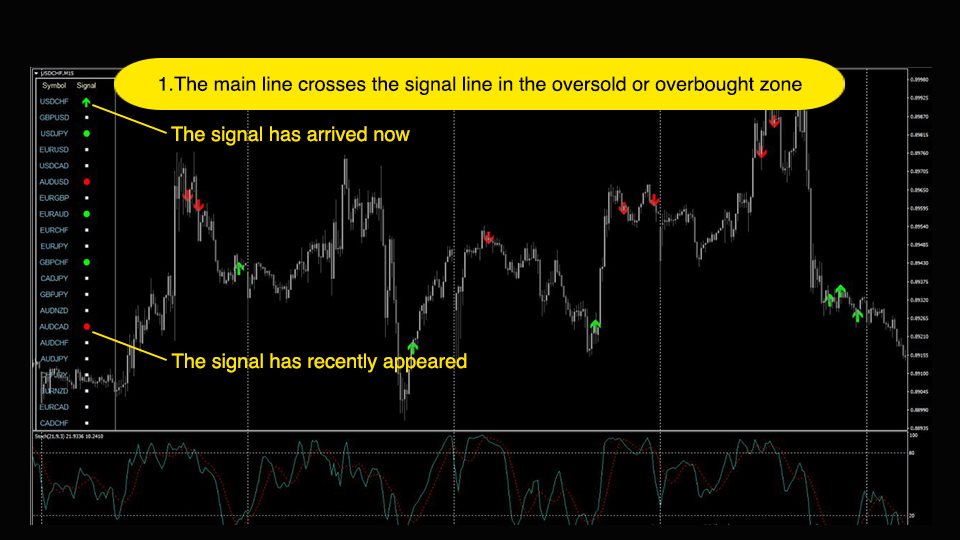
- The main line crosses the signal line in the oversold or overbought zone
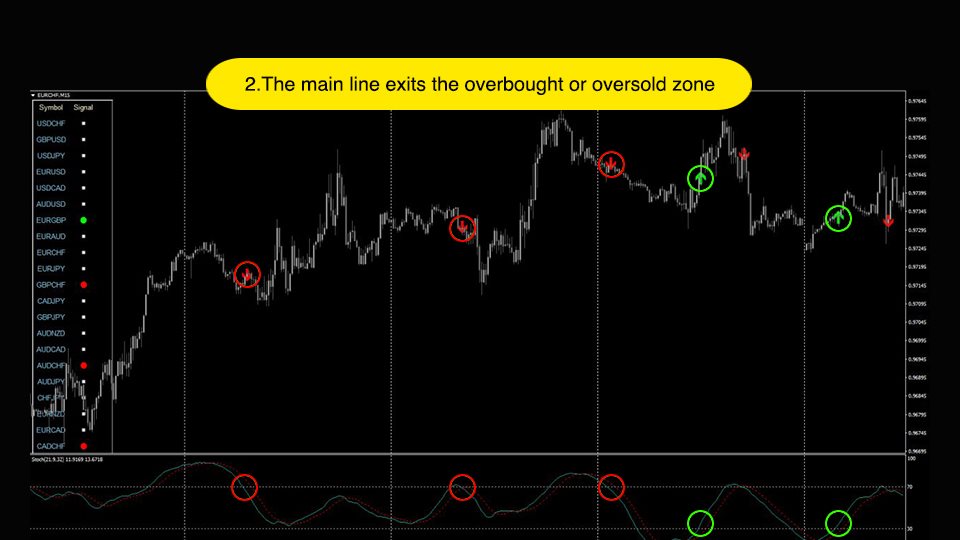
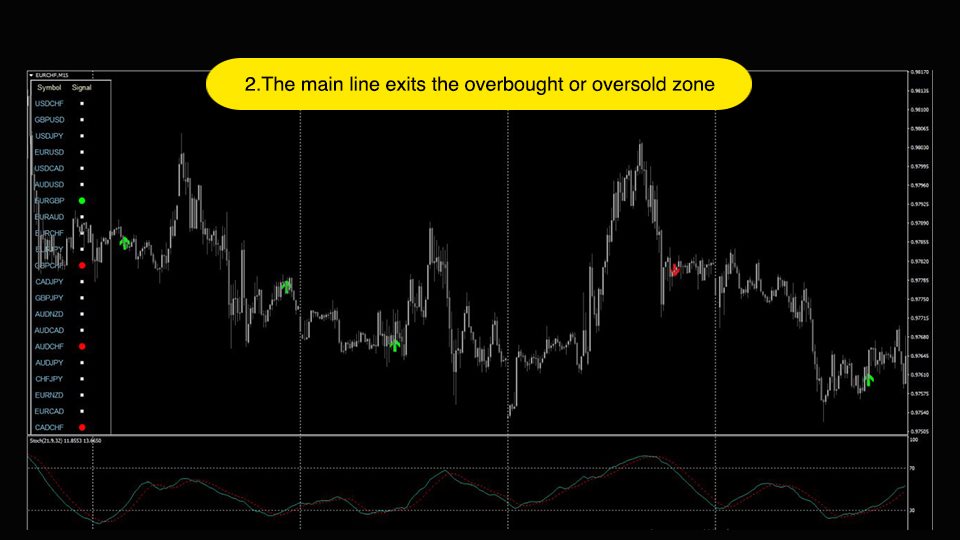
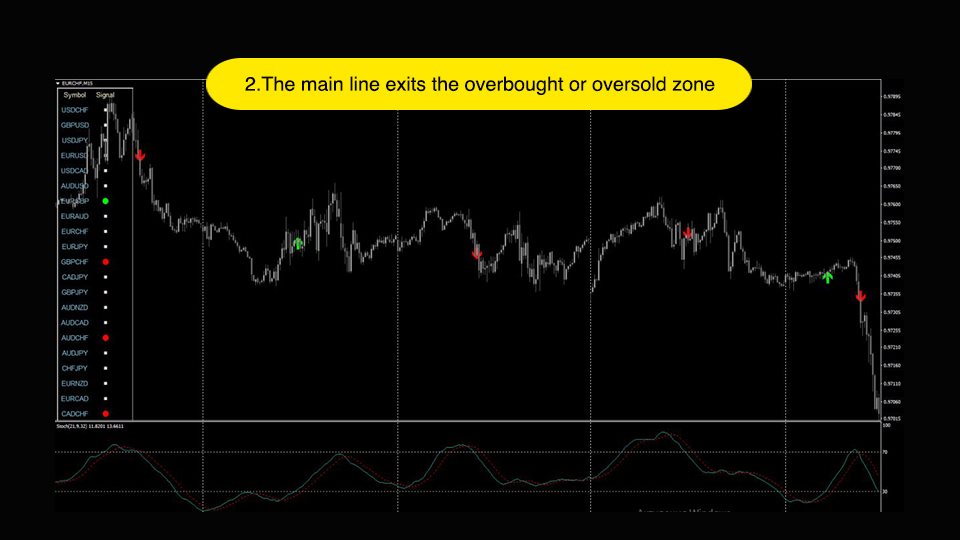
- The main line exits the overbought or oversold zone
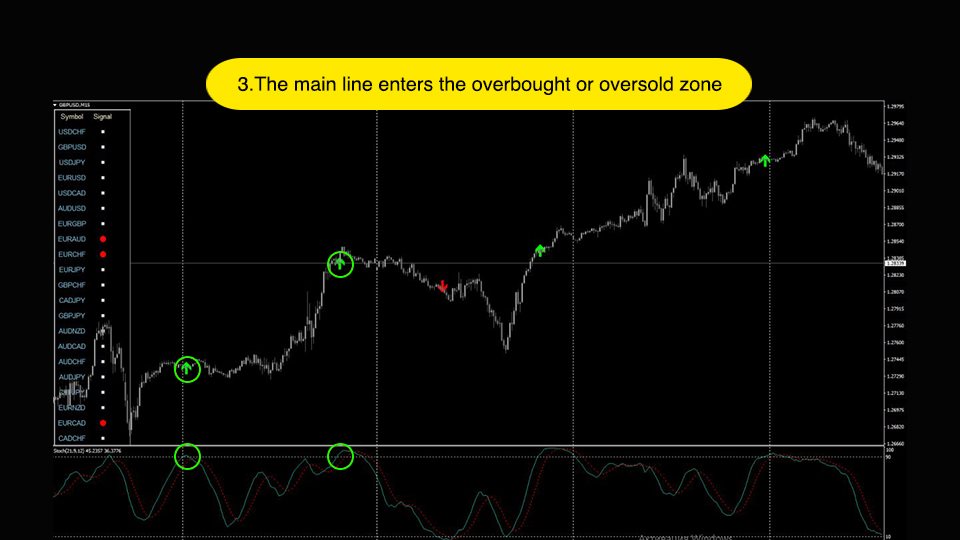
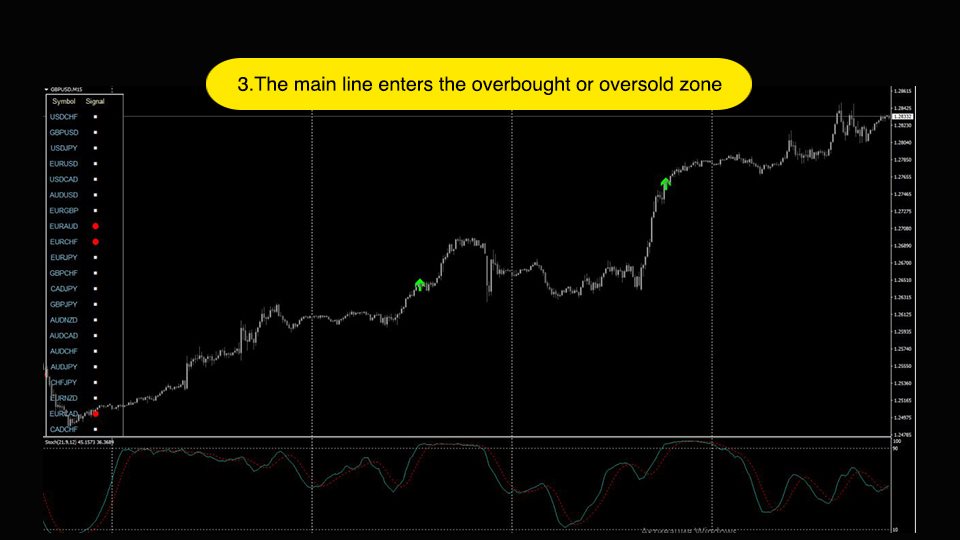
- The main line enters the overbought or oversold zone
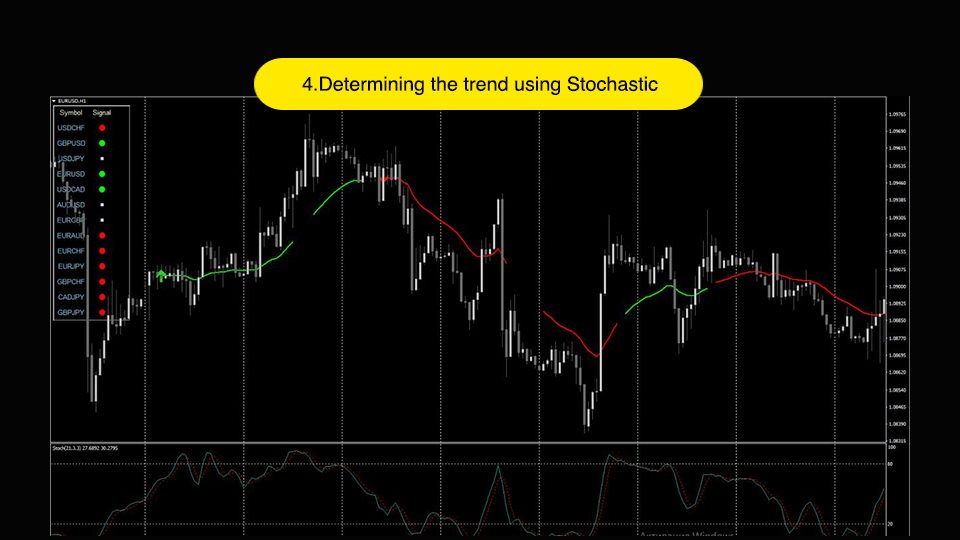
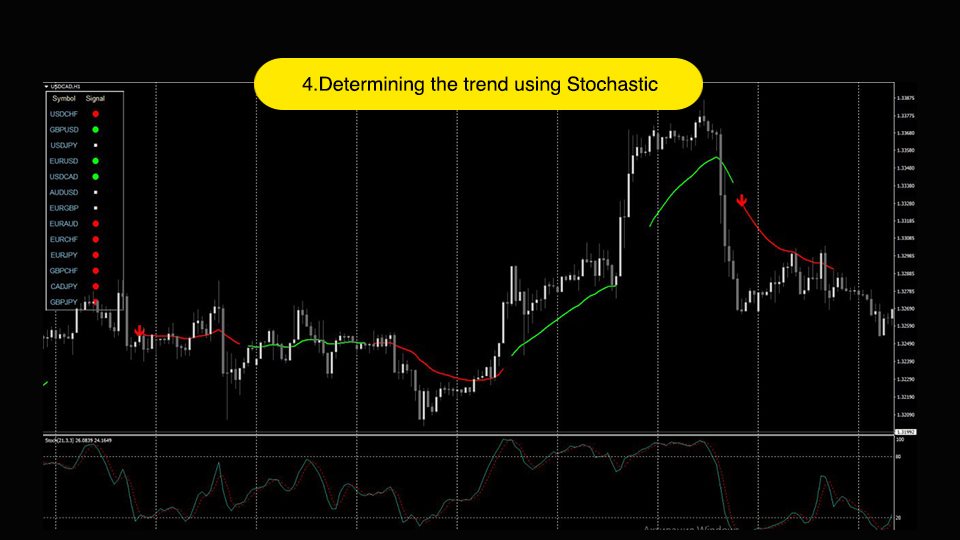
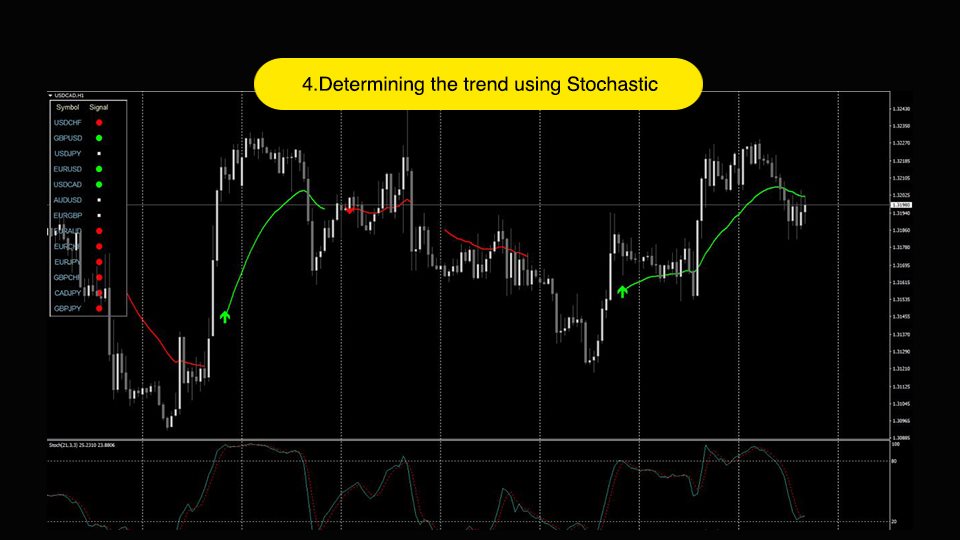
- Determining the trend using Stochastic
| Name | Description |
|---|---|
| Symbols | Tools are listed separated by commas and without spaces. They will appear in the table. |
| Stochastic settings | Stochastic settings. Including the overbought level is indicated there, while the oversold level is calculated automatically. If the overbought level in the settings is 60, the indicator will calculate the oversold level as 100-60 = 40. |
| Number of bars to display | The number of bars to display the indicator on an open chart. |
| Number of bars after the signal | The number of bars on which the signal will still be shown in the table after it appears. The signal in the table is shown by an arrow, then a certain number of bars/candles is shown as a circle of the corresponding color. |
| Period for determining the trend by Stochastic | The period for analyzing the Stochastic line to determine the trend. It is displayed on the graph as a line of the corresponding color. |
| Alerts | Signal presence alert. Arrows do not redraw. |