Average Levels
- 지표
- Makarii Gubaydullin
- 버전: 1.35
- 업데이트됨: 17 7월 2023
- 활성화: 20
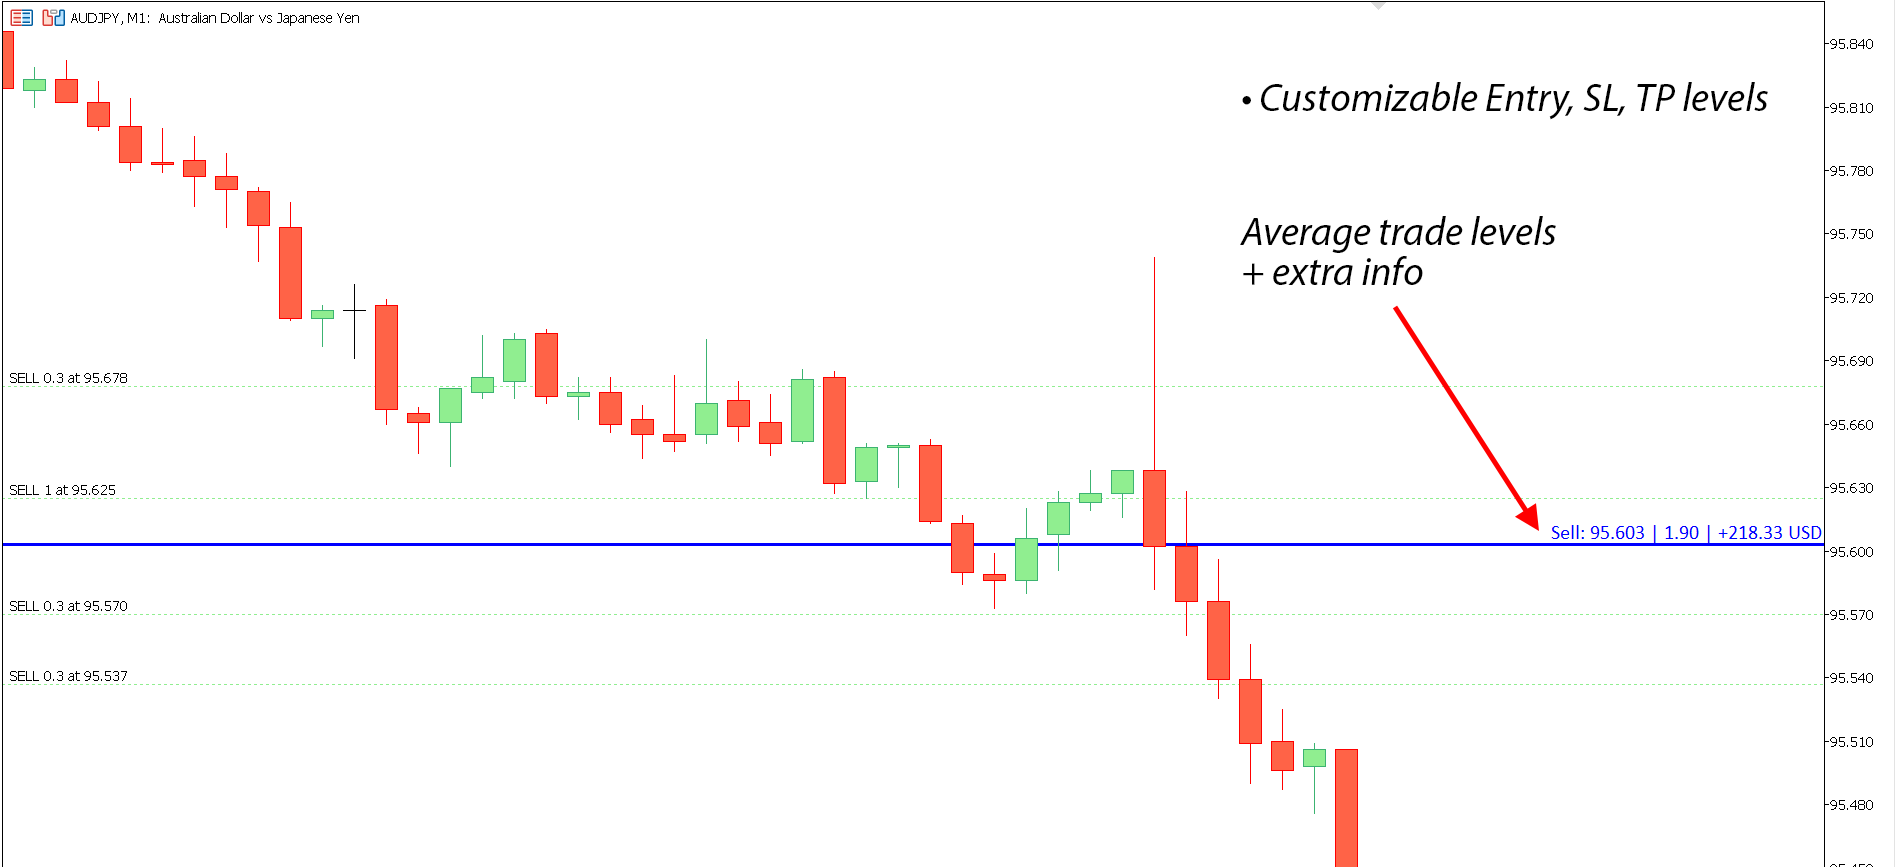
The average Entry, SL and TP levels of all trades on the Symbol.
The levels can be calculated together, or separately for Buy and Sell trades.
You can optionally display additional info: Level price, total Lot size, floating P/L.
The styles and colors of the levels are customizable.
My #1 Utility: includes 65+ functions | Contact me if you have any questions | MT4 version
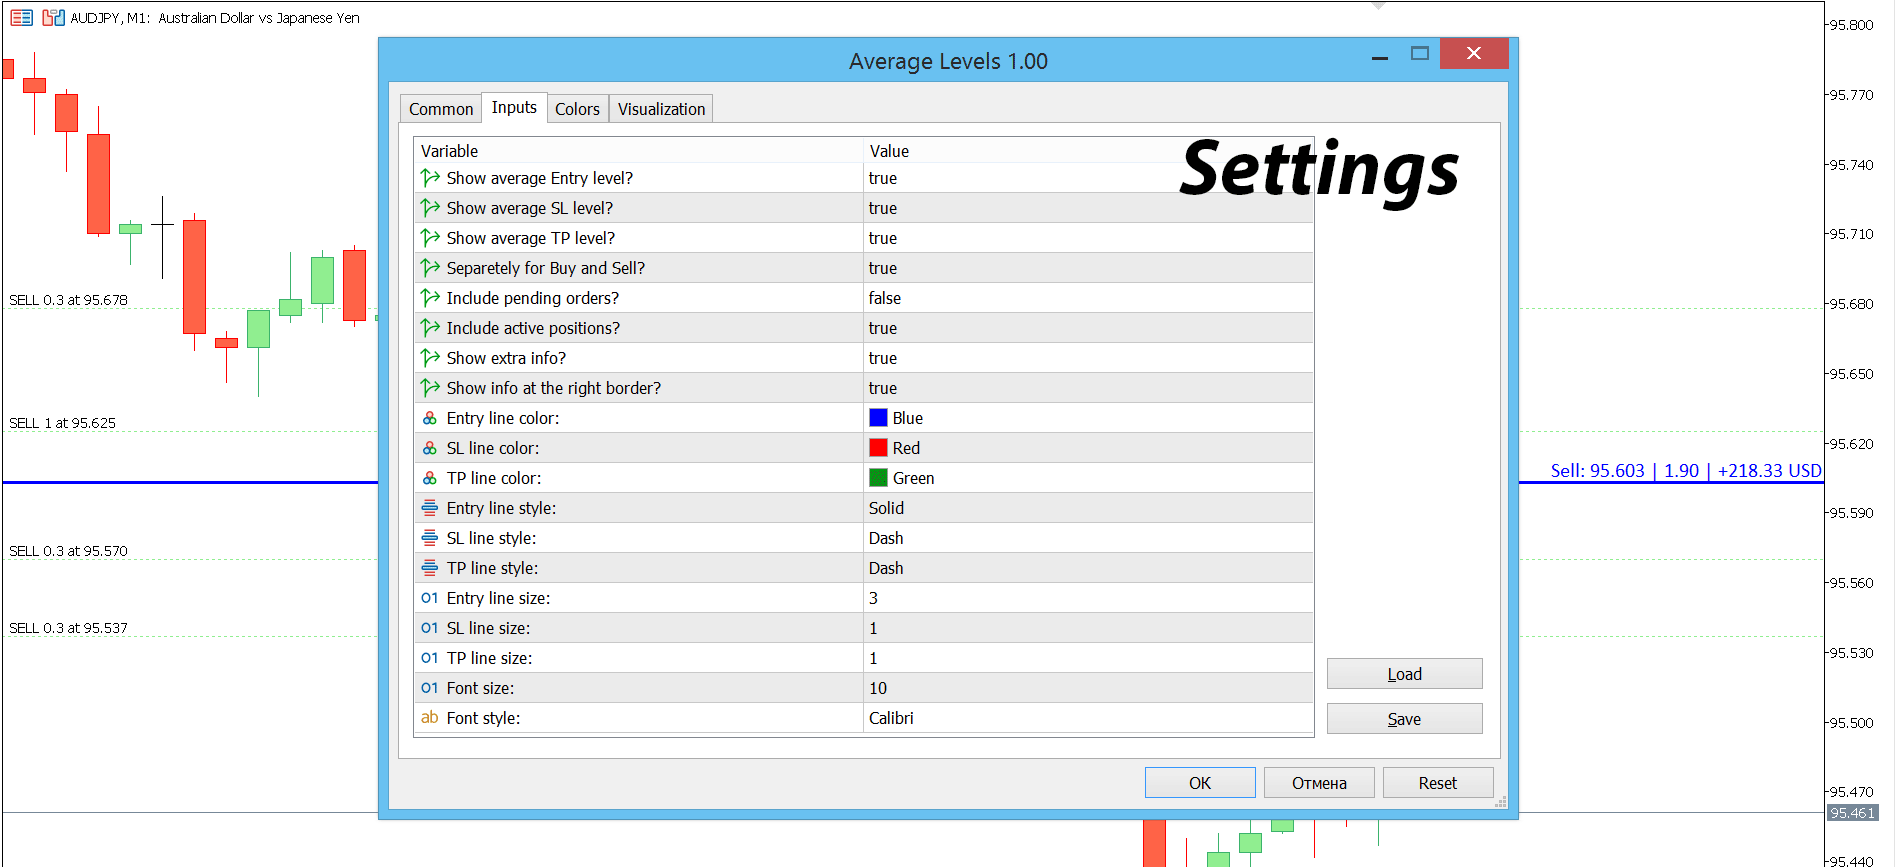
In the settings of the indicator, you can configure:
- Average Entry level: on/off;
- Average SL level: on/off;
- Average TP level: on/off;
- Separetely for Buy and Sell: if 'false' is selected - levels will be caulcated together for Buy and Sell.
- Include pending orders: on/off;
- Include active positions: on/off;
- Show extra info: on/off;
- Show info at the right border? if 'false': extra info wil be displayed at the left border;
- Line and text color: for Entry, SL and TP;
- Line style: for Entry, SL and TP levels;
- Line size: for Entry, SL and TP levels;
- 'Font size', and 'Font style': if 'Show extra info' is enabled.
The program file must be placed in the "Indicators" directory.

Fantastic One.