SFT Stable Swing
- 지표
- Artem Kuzmin
- 버전: 1.0
- 활성화: 5
The indicator allows for quick identification of price reversals by promptly reacting to price impulses and indicating the beginning of a price reversal.
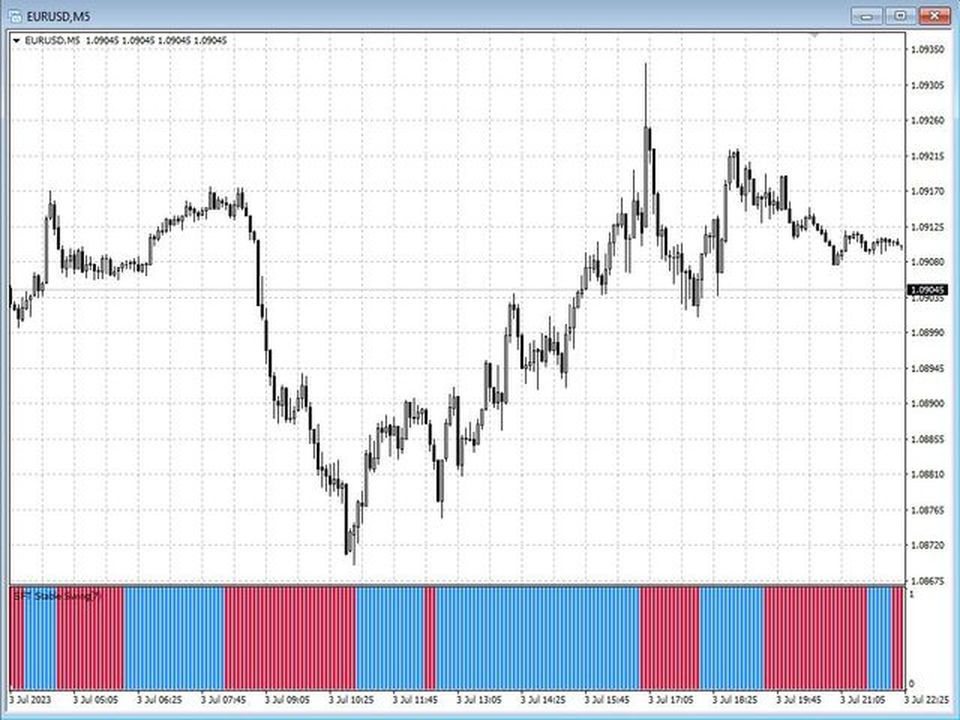
The histogram demonstrates the direction of movement and identifies favorable moments for opening positions.
It is recommended for use in swing trading and can be applied to any currency pairs, metals, and cryptocurrencies.
It is also suitable for binary options trading.
Key Features
- Rapidly identifies changes in the local trend
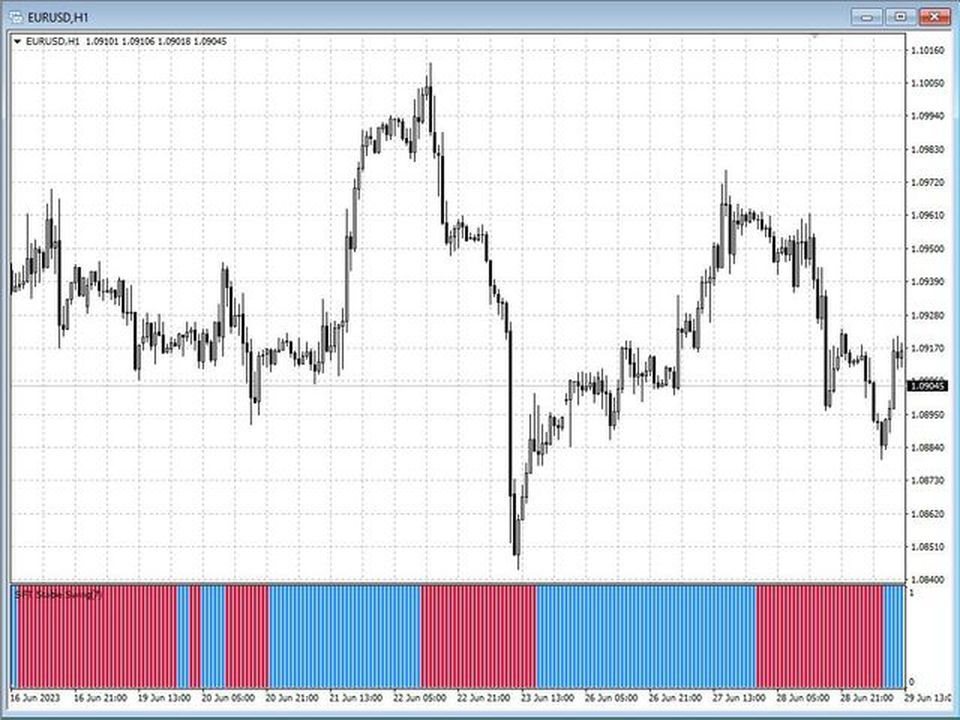
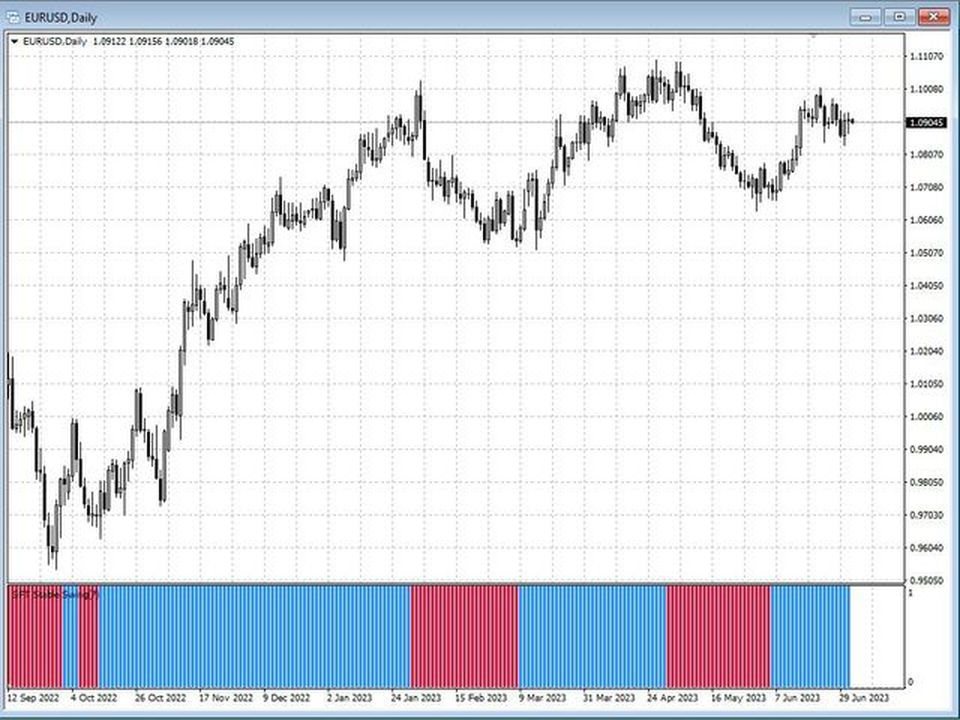
- Works on all timeframes and symbols
- Proven effectiveness in swing trading
- Suitable for trading currencies, metals, options, and cryptocurrencies (Bitcoin, Litecoin, Ethereum, etc.)
- Compatible with manual trading and expert advisor development
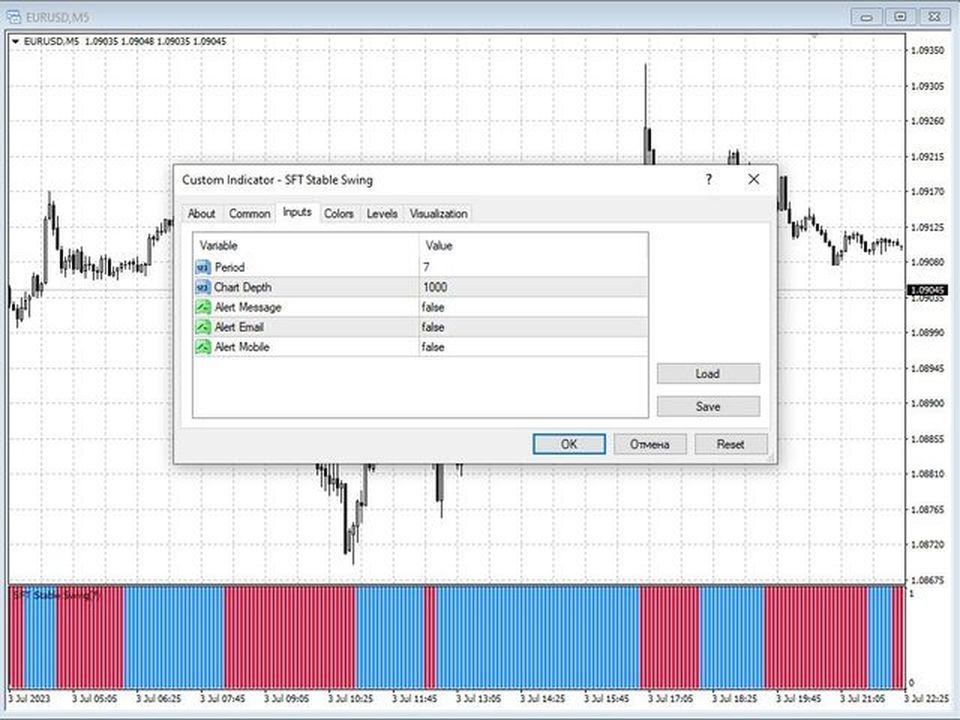
Indicator Settings
- Period - Indicator period
- Chart Depth - Depth of indicator display on the chart
- Alert Message - Display signal message and provide sound confirmation
- Alert Email - Send signals to email (terminal setup instructions available here)
- Alert Mobile - Send signals to mobile via installed mobile terminal (setup instructions available here)
Trading Recommendations
- When the histogram is colored blue, consider opening a Sell or Put position (for options)
- When the histogram is colored red, consider opening a Buy or Call position (for options)
- The direction of the trade should correspond to the trend direction on a higher timeframe
- Exit the trade on a reverse signal or based on set Stop Loss (SL) and Take Profit (TP) levels
- When using SL and TP, it is advisable to set the SL beyond the nearest extreme point and TP at 1-2 times the SL
- Works well in conjunction with the signal indicator SFT Oh My Scalper
Various trading tactics are possible, and you can develop the most suitable one for yourself through trading experience
For additional information and a more detailed trading method review, please refer to the following:
We wish you stable and profitable trading.
Thank you for using our software.
If you find it helpful, please share the link with your friends.
Stay connected for the release of new useful trading programs by adding us as a friend: SURE FOREX TRADING