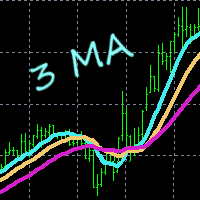
Moving Average Crossover Color
- 지표
- Eugene Raymond Potgieter
- 버전: 1.1
- 업데이트됨: 29 6월 2023
- 활성화: 5
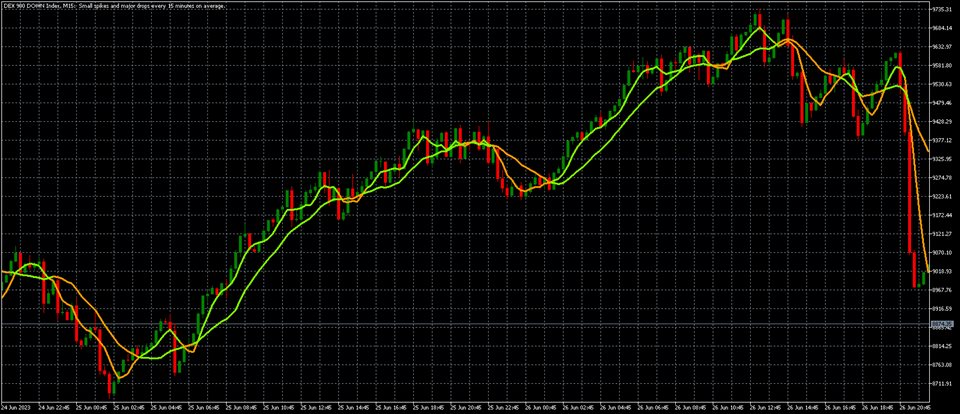
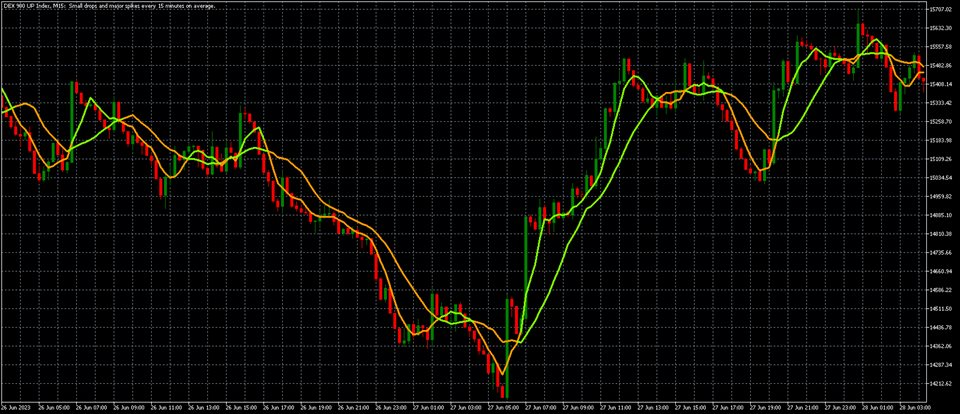
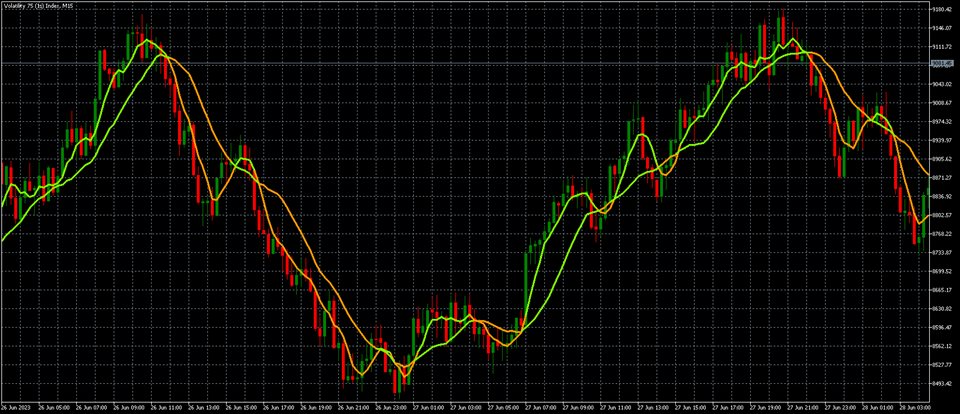
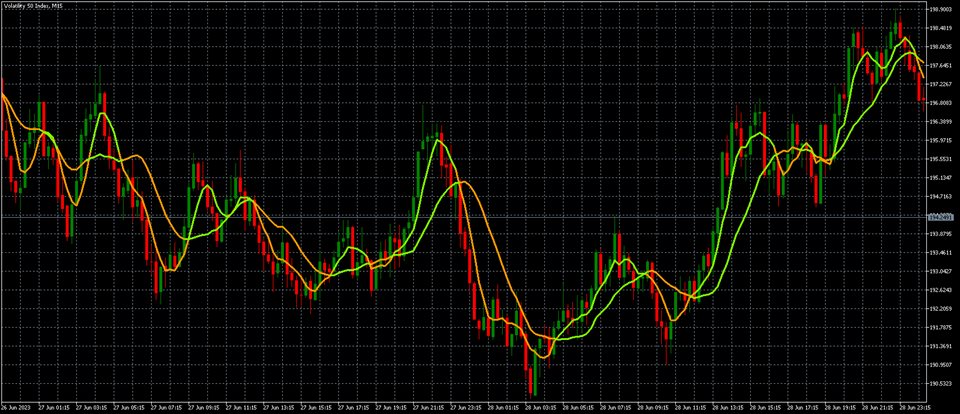
Moving Average Crossover Indicator.
Add this Easy Indicator to your charts.
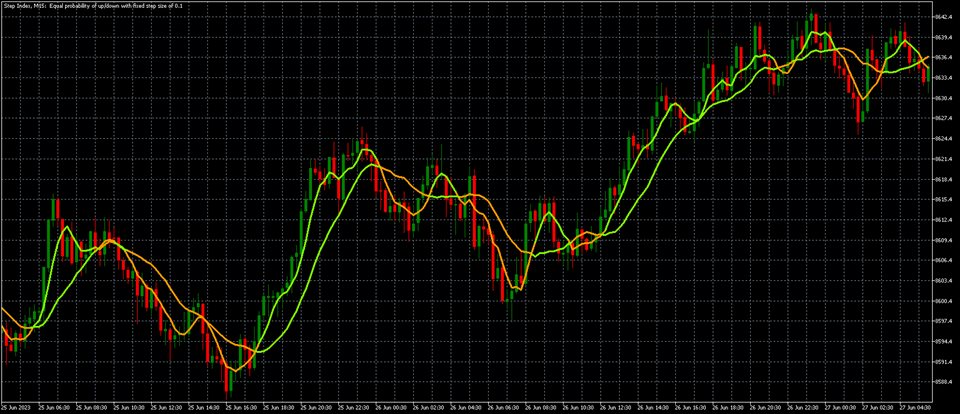
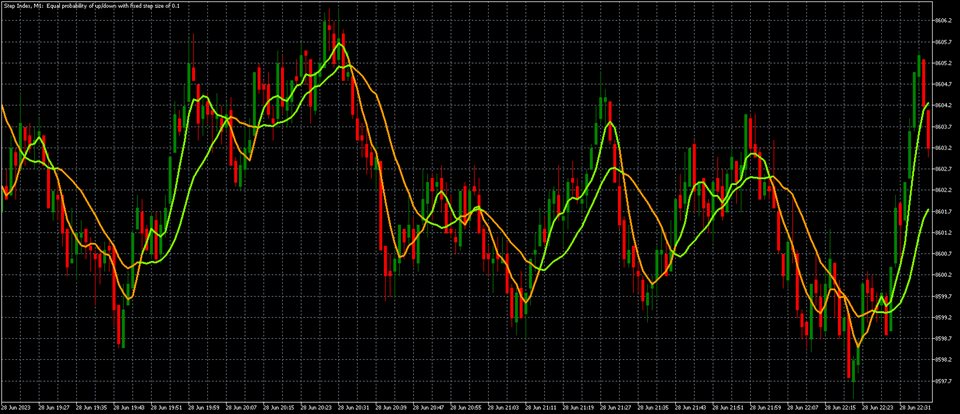
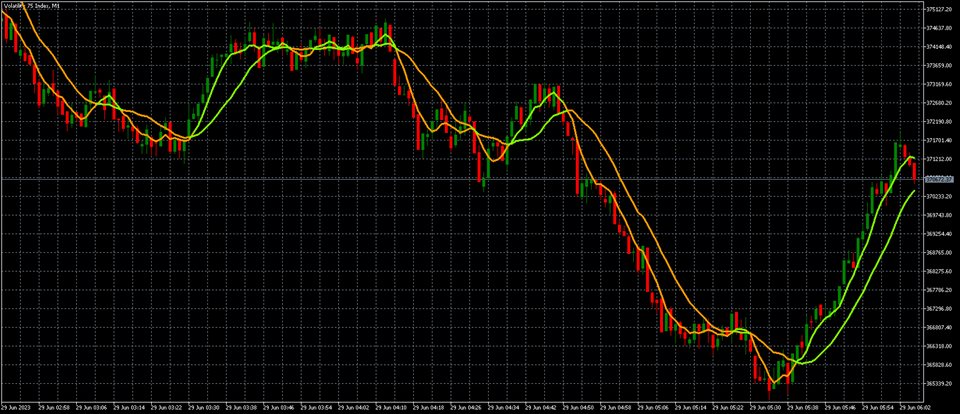
The indicator indicates when to buy and when to sell.
When the line is orange that is a sell signal.
When the line is green that is a buy signal.
Easy to use and colors can be changed so suit your charts.
Easy to use. Follow the indicator and enter your buy and sell signals.
Work on any market and on any timeframe.

