MetaTrader 5용 유료 Expert Advisor 및 지표 - 91

The EA strategy This EA has a built-in combined Bollinger Bands Trend indicator, MACD and MA that checks the prices trends everytime and opens and closes new orders at the right time; Recommended for beginner traders because the default input values are optimized to work with acconts with ballance as low as US$ 300 ; It protects your profit because it is provided with Trailing Stop Loss, Minimum Equity Percentage to allow any trade, Maximum Spread alowed and you can also define the bad time to t
This is a series of gauges that can be loaded on any Chart time frame. You can use this gauge indicators to decide when to enter and exit market with high degree of confident. Gauge No 1: Ichimoku Kinko Hyo Tenken Sen Crosses Kijun Sen. This will tell Bull and Bear and the timing to enter market. When the value move from above 0 towards below 0, the Tenken Sen line is moving to cross the Kijun Sen line and appears value is the Delta for the difference. Same goes to the opposite. The positive val

Premise SpreadTrend EA is a software that analyzes correlations and the spread between five forex pairs in search of a momentum of entry that can allow obtaining a statistical advantage to reach profit.
What is Spread Trading The Spread Trading is the study of the strength of two currency pairs at the same time in order to assess which of the pair is able to outperform the other. The object of the study is the correlation, volatility in time and the strength of trend.
What are advantages of
This utility displays the information required for making trades on each opened chart. For example: spread value, swap value; triple swap day; session closing time; ATR of the symbol by Gerchik; total profit/loss for the current symbol; the number of trades made earlier; the percentage change in the quotes of 6 selected instruments; and much more. The spread value is always shown. The rest of the information is displayed depending on the settings: Show total orders at the moment (long, short) .

Copier of deals from MetaTrader 5 to MetaTrader 5 ( MetaTrader 4<->MetaTrader 4 version is available ; with both versions, you can copy MetaTrader 5<->MetaTrader 4, MetaTrader 4<->MetaTrader 5, MetaTrader 5<->MetaTrader 5, MetaTrader 4<->MetaTrader 4). There is a demo version (restricting by grades and by lots) Works only in the mode of hedging Spread filter. Select the best price (start copying positions with a profit or loss). Configure the lot size, fixed or ratio-based (provider signals can

COSMOS4U AdTurtle Expert Advisor is based on the now classic Turtle trading system introduced by Richard Dennis and William Eckhardt. It employs Donchian high/low lines of various periods to decide when to open and close positions. This is an Expert Advisor that can promptly react to sudden trend reversals in everyday trading but is also suitable for executing long-term holding strategies.
How it works When the trading mode “Long&Short” is selected, a total of 8 high/low lines are used to open

The COSMOS4U AdTurtle is an indicator based on the now classic Turtle trading system. The various high and low Donchian lines around the price bars show you when to open or close your positions. These lines indicate levels which result in the opening or closing of a respective position when the price crosses through them. By default, the new position barriers are drawn as solid lines and the exit barriers are drawn as dashed lines. The new long position lines and the close short position lines a
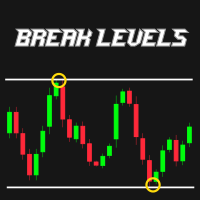
R747 BreakLevels is smart indicator that automatically detects Support and Resistance levels on actual market trend. Strength of levels can be easily adjusted by changing parameter LevelsStrength in range of 2 (weak levels) and 50 (strong levels). This indicator is accessible in EA via iCustom functions and is fully customizable by user. There is possibility to send Push notifications and Alerts of newly found levels.
Follow this link to get all detailed information: >> LINK <<
Features Adju
Check Online-Status monitors your terminal. If its connection to the server is interrupted for longer time, you will receive an email and/or a push notification, depending on what your settings. You can find out how long the terminal has been offline and can judge the quality of your brokers and/or the provider of your VPS after some time. Remember, the terminal manages and controls your money. Everything hangs in the air if it has no connection to the server! Check Online-Status displays the th
Fractals true extremums is a modification of the Fractals indicator. The indicator sorts out weak fractals leaving only the ones that are significant for searching the chart extreme points. The sorting is performed during fractals construction. The old data does not change. Only the last value can change (just like in the standard Fractals indicator). The indicator can show lines indicating Fractals from higher timeframes.
The product can be used by EAs for comparing price extreme points on cha
The indicator is designed to calculate the correlation between major pairs and display cross-pair of overbought or oversold labels on the price chart.
The idea is that strong divergences of major pairs lead to an exit from the "equilibrium" of the corresponding cross pairs. With sufficiently large divergences, which are displayed by the indicator, the cross-pair is usually corrected by entering the "equilibrium". For example: when working on EURAUD pair, the difference for the period specified

This indicator is designed to help traders find the market entry and exit points. The indicator generates signals in the form of arrows, which is a simple and intuitive for use in trading. In spite of apparent simplicity of the indicator, it has complicated analytic algorithms which determine entry and exit points. Its operation is based on moving averages, RSI, candlestick patterns, as well as certain original developments. Open a Buy position when an upward arrow appears, and a Sell position w
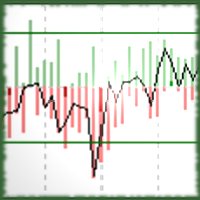
The Signal Noise Indicator is a non-parameterized oscillator generated by high, low and close noises.
Input Period: Reference period of the Low Pass Filter, used for the signal detection.
Values High Noise: maximum high noise; Power High Noise: high signal strength, showed when the smallest noise occurs in the same signal direction; Low Noise: maximum low noise; Power Low Noise: low signal strength, showed when the smallest noise occurs in the same signal direction; Close Noise: noise value

The Multi-Oscillator is the ultimate swiss army knife for multi-currency and multi-timeframe trading. It plots your desired oscillator for many currency pairs and/or timeframes in a single chart. It can be used to trade statistical arbitrage, as a market screening tool or as a refined multi-timeframe indicator. [ Installation Guide | Update Guide | Troubleshooting | FAQ | All Products ] Easy interpretation and configuration Supports 16 well-known indicators It can display up to 12 currency pair
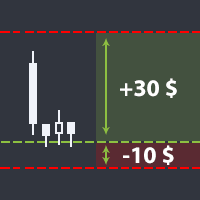
The utility helps open a deal with a stop loss that does not exceed the specified amount, or to refrain from it altogether. That is, it determines the number of lots to open the deal so that the stop loss is as close as possible to the specified amount in USD without exceeding it. For example, it will be indispensable when trading according to the Gerchik strategy. That is, when trading based on risks, with a fixed risk and a fixed take profit relative to stop loss. For example, if you always op

I want to present to you my solution in the implementation of automatic drawing of Fibo levels on the whole trend and the last trend leg. The logic of the indicator is based on the principle of swings, and when indicator gets a signal for a trend direction change, the previous key point before reversing is considered the start point of the indicator's drawing. When you test the indicator, note that changing the direction of the whole trend leg of Fibonacci often leads to a reversal of the trend.

Presentation The URL html and xml to csv is designed to get contents from URLs with html or xml content, and to download it to an output format as a txt or as a csv file for MetaTrader 5. It enables to get the whole web sites page, starting with the http protocol, in a document for a further use and in additional with downloading directly on the MetaTrader applications and on the desktop. It is a good advantage for taking the most data from events and economic calendars, and also publications re

Do you need to check support and resistance lines? Do you need to find them really fast and automatically? Do you want to set your own settings how to find them? Then this indicator is your right choice! Indicator Lines is developed for finding support and resistance lines on chart. It does its job quickly and fully automatically. Main principle of algorithm is to get all extremes on chart (according to "Density" parameter). Then indicator tries to find minimally 3 points (according to "Minimal

This scanner shows the trend values of the well known indicator SuperTrend for up to 15 instruments and 21 time frames. You can get alerts via MT5, Email and Push-Notification as soon as the direction of the trend changes.
Important Information You have many possibilities to use the scanner. Here are two examples: With this scanner you can trade a top-down approach easily. If two higher time frames e.g. W1 and D1 are already showing green values (upward trend) but the H12 time frame shows a re

With this system you can spot high-probability trades in direction of strong trends. You can profit from stop hunt moves initiated by the smart money!
Important Information How you can maximize the potential of the scanner, please read here: www.mql5.com/en/blogs/post/718109 Please read also the blog about the usage of the indicator: Professional Trading With Strong Momentum.
With this system you have 3 reliable edges on your side: A strong trend (=high probability of continuation) A deep pu

The True channel indicator plots the linear regression channel. The channel consists of two lines of support and resistance, as well as the averaging trend line.
Additional information in the indicator support and resistance price for the current bar channel width channel inclination position of the channel price relative to the channel in percent
Settings Bars for calculation - the number of bars to plot the channel Price for calculation - the price for plotting the channel boundaries (Clos

This non-trading expert utilizes so called custom symbols feature ( available in MQL as well ) to build renko charts based on historical quotes of selected standard symbol and to refresh renko in real-time according to new ticks. Also, it translates real ticks to the renko charts, which allows other EAs and indicators to trade and analyze renko. Place RenkoCharts on a chart of a work instrument. The lesser timeframe of the source chart is, the more precise resulting renko chart is, but the lesse

Supporta is a trading indicator that automatically identifies support and resistance levels and their strengths from price movements and draws them on price charts. The instrument supports both the MetaTrader 4 and MetaTrader 5 terminals and can be used on any financial instrument and any timeframe. The MetaTrader 4 version is available on the market as Supporta MT4 . For full documentation and quick start, please refer to the official guidebook which is available for download in the comments se

지표는 가격과 오실레이터/지표 사이에 다이버전스가 발생하는 시점을 식별합니다. 그것은 규칙적인 발산과 숨겨진 발산을 모두 식별합니다. 가장 강력한 설정만 필터링할 수 있는 RSI 필터 옵션이 있습니다. 지표는 또한 Engulfing 대형, Donchian 채널 돌파 또는 가격이 이동 평균을 넘을 때까지 기다릴 수 있는 옵션을 제공합니다 (스크린샷 #3 참조) 거래 기회를 알리기 전에 다이버전스를 확인합니다. 고유한 규칙 및 기술과 결합하여 이 표시기를 사용하면 자신만의 강력한 시스템을 생성(또는 강화)할 수 있습니다. 특징
의 끝에서 제품의 블로그 지표에서 거래 신호를 검색하기 위해 iCustom() 함수를 사용하는 예제 EA(전문가 고문)의 소스 코드를 다운로드할 수 있습니다. EA가 완벽하게 작동하더라도 주요 목적은 코드를 사용하여 자신이 개발한 EA에 붙여넣는 것입니다. 내 제한된 시간을 감안할 때 하지만 프로그래밍 지원은

The indicator shows the upper, middle and lower price limits for a certain period of time. Also, two Moving Averages (MAs) are displayed.
Parameters
CTType : corridor basis. _Hour : hours, _Day : days, _Bars : bars CTPrice : price type, by bars. OpenClose : Open/Close prices, HighLow : High/Low prices CTShift : corridor shift CTNum : how much to consider for building a corridor, min 2 CTPeriodFast : Fast period, min 2 CTShiftFast : Fast MA shift CTMethodFast : Fast averaging method CTPeriodSl

This algorithm uses statistically justified comparison of market data, numerical constant values and output values of Stochastic indicators and Moving Averages in order to take decision whether it is necessary to open a position. Prior to giving birth to a new EA, this logic was created as a result of usage of Stochastic methods and then tested on historical data and checked with Monte Carlo method, which does not guarantee any results in the future, of course. No martingale is used. The robot i
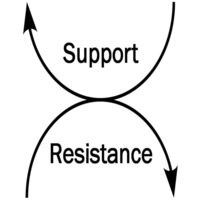
Support and Resistance is a concept that price will tend to stop and reverse at certain predetermined price levels denoted by multiple price touches without breaking those levels. This indicator plots those lines of resistance and support which helps identify points of possible reversal by confirming and marking previous and current price levels. Also, it warns when price approaches latest marked levels.
Input Parameters range - the price period back to check for confirmation. confirmations -

This utility changes the behavior of auto-scroll. It removes the need to manually disable and re-enable the auto-scroll function.
Main features Disables auto-scroll - when the screen is scrolled backwards to look at the price history. Enables auto-scroll - when moved back to current history.
Inputs None.
Note I recommend testing when markets are open, since auto-scroll works when there are incoming ticks.

This algorithm uses statistically justified comparison of historical prices, moving average and output values of Williams R and Stochastic indicators in order to take decision whether it is necessary to open a position. Prior to giving birth to a new EA, this logic was created as a result of usage of stochastic methods and then tested on historical data and checked with Monte Carlo method, which, of course, does not guarantee any results in the future. The bot is designed to trade during evening

Market Profile helps the trader to identify the behavior if major market players and define zones of their interest. The key feature is the clear graphical display of the range of price action, in which 70% of the trades were performed. Understanding of the location of volume accumulation areas can help traders increase the probability of success. The tool can be used as an independent system as well as in combination with other indicators and trading systems. this indicator is designed to suit

Market Waves marks reversal price points on a chart following the modified Larry Williams method. The price is preliminarily smoothed using Heikin Ashi method. Open positions in the indicator signal direction. Note the patterns formed by reversal point groups. I recommend reading Larry Williams' "Long-Term Secrets to Short-Term Trading" before using the indciator.

This algorithm uses statistically justified comparison of numerical constant values and output values of Williams R, CCI and Stochastic indicators in order to take decision whether it is necessary to open position. Prior to give birth to a new EA, this logic was created as a result of usage of stochastic methods and then tested on historical data and checked with Monte Carlo method which does not guarantee any results in the future, of course. The bot is designed to trade during morning hours on

Spread Costs refers to the amount of the loss caused by the spread, and Swap Benefits refers to the amount of the income gained by overnight positions. Spread Costs is an important indicator for short-term traders, especially for scalping traders, and Swap Benefits is an important indicator for long-term traders. Since the spreads and swaps on the MetaTrader 5 platform are all expressed in points, we need to convert it into the amount expressed in the account currency. This tool can display the

This Expert Advisor's main strategy is based on the usage of two kind of indicators: two built-in shifted RSI to measure the asset prices oscillations and a Parabolic SAR to check the prices trends. It combines these indicators signals in order to get stronger signals and ensure the EA will do good trading operations.
It protects your money because it is provided with : Trailing stop loss to protect your profit. Once your order has a positive profit, it sets SL at a certain distance in order t
Those familiar with chess-playing robots that successfully defeat grandmasters, know very well what a complex and large card catalog is. As a result, the Expert Advisor's algorithm is based on 320 reversal and 302 flat patterns formed by day candles on 7 major currency pairs, displayed on screenshots ( EURUSD_i, GBPUSD_i) from 12.01.2012 to 04.22.2018 (account currency USD, "Every tick" test mode, M1, MetaTrader 5). Positions are opened by analyzing the current and previous day candles with impu

You can avoid constant monitoring of computer screen waiting for the DeMarker signal while receiving push notifications to a mobile terminal or a sound alert on the screen about all required events, by using this indicator - DeMarker Alerts. In fact, it is the replacement of the standard indicator with which you will never miss the oscillator signals. If you don't know the benefits of DeMarker or how to use it, please read here . If you need signals of a more popular RSI indicator, use RSI Alert

The Quick trade report separately by symbols script will be useful for simultaneous trading on multiple instruments. It provides the ability to assess the effectiveness of trading on each symbol separately. It is possible to set a time period for making the reports. The report visualizes the changes in the balance for deals on each symbol. Also, the following key trading parameters are calculated for each instrument: Total net profit - the financial result of all trades. This parameter represent
The " Delta Volume histogram " Expert Advisor plots histograms of "Delta volume", "Real volume", "Buy volume", "Sell volume", "Tick volume".
EA version: Has a built-in «Pending orders indicator". The indicator is designed for analysis of pending orders in the market, available in "MarketBook". Displays the Volume profile levels (VAH VAL from 60% to 85%). Built-in side histogram. This is a powerful tool for analyzing trade volumes. The chart is plotted based on tick data.
Depending on the broke

The Extremum catcher MT5 indicator analyzes the price action after breaking the local Highs and Lows and generates price reversal signals with the ability to plot the Price Channel. If you need the version for MetaTrader 4, see Extremum catcher . The indicator takes the High and Low of the price over the specified period - 24 bars by default (can be changed). Then, if on the previous candle, the price broke the High or Low level and the new candle opened higher than the extremums, then a signal
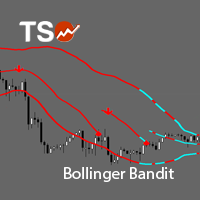
TSO Bollinger Bandit Strategy is an indicator based on the Bollinger Bandit Trading Strategy as presented in the book Building Winning Trading Systems with TradeStation by G. Pruitt and J. R. Hill. SCANNER is included . Now with Scanner you can find trading opportunities and setups easily and faster.
Features A complete entry and exit strategy for trending markets. Get email / push notifications when an entry signal occurs. The indicator is not repainting. Can easily be used in an EA. (see F
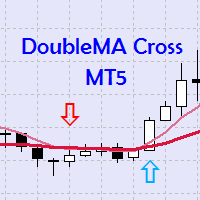
The "DoubleMA Cross MT5" is a typical strategy of investors, which usually indicates a change in trend from bearish to bullish. To establish a double crossing of moving averages, we need a slow moving average and a fast moving average. When the fast moving average crosses the upside to the slow average the bullish signal is triggered. The opposite strategy is also very useful. Everything works in the same way and we use the same indicators and periods: Fast moving average and slow moving average

Introduction to Harmonic Volatility Indicator Harmonic Volatility Indicator is the first technical analysis applying the Fibonacci analysis to the financial volatility. Harmonic volatility indicator is another level of price action trading tool, which combines robust Fibonacci ratios (0.618, 0.382, etc.) with volatility. Originally, Harmonic Volatility Indicator was developed to overcome the limitation and the weakness of Gann’s Angle, also known as Gann’s Fan. We have demonstrated that Harmonic

Risk Manager Pro is a simple utility that calculates the necessary lots with the risk percentage and the pips of stop loss, before opening positions. The web calculators can be useful in some cases but they are not efficient to open operations in real time. In the trading days, there are few opportunities to open positions and when the opportunity arises, the seconds make the difference. This is not possible with conventional web calculators, since to calculate the size of an operation regarding
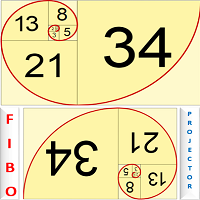
This indicator will automatically draw 4 Fibonacci levels on the chart. Dynamic Fibonacci will be drawn on the last of zigzag line. Static Fibonacci will be drawn on the 3 last of zigzag line. Fibonacci projection 1 and 2 will be drawn on the last zigzag line also. This way, you can see several Fibonacci level to get prediction of next support and resistance of market price. Indicator does not work if less than 500 bars are available.
Parameters Zig_Zag_Parameter Depth - Zig zag depth paramete

The ForexGenerated Expert Advisor works based on short-term changes in the trend, creating the price "corridor" set in the parameters. Trading is carried out at the external borders of this corridor by opening positions in different directions with different lot sizes. This achieves a very high probability of closing positions in profit. ForexGenerated is intended for trading any currency pair on the M5 timeframe or higher. However, backtests indicate that it is best suited for NZDUSD on M5.
C

표시기는 기타(및 비표준) 기간(연도, 6개월, 4개월, 3개월, 2개월, 월, 주, 일, H3-H6-H8-H12 시간)의 고가/저/시가/종가 수준을 표시합니다. . 양초를 여는 교대근무를 설정하고 가상 양초를 만들 수도 있습니다. 이러한 기간 중 하나에 대한 '기간 구분 기호'는 수직선 형태로 제공됩니다. 현재 또는 이전 수준의 돌파에 대해 경고를 구성할 수 있습니다(어제/지난주 라인의 고/저 돌파 등). 모든 수준을 한 기간씩 오른쪽으로 이동할 수도 있습니다. 즉, 이전 기간의 고가/저가가 현재 기간에 표시됩니다.
매개변수 Number of levels to calculate (0-all) — 화면에 표시되는 막대 수입니다. Change the opening of bars (hours) — 캔들의 오프닝을 n시간만큼 이동합니다. 표시기는 새로운 개장 시간을 고려하여 가상 막대를 그립니다. MN1 이상의 기간은 변경되지 않습니다. Move the levels to th

This algorithm uses statistically justified comparison of historical prices and output values of the CCI and ATR indicators to decide whether it is necessary to open position. This logic has been created as a result of the use of stochastic methods, it has been tested on history data and verified by the Monte Carlo method, which, of course, does not guarantee future results. The EA is designed to trade EURUSD M15 during morning hours. Despite the fact that this condition is not mandatory, the tr

ACB Trade Filter indicator provides a way to filtering out the low probability trading entries in a trading strategy. The indicator uses a sophisticated filtration algorithm based on the market sentiment and trend. The MT4 version of the same indicator is available here ACB Trade Filter MT4
Applications Works great with our indicator ACB Breakout Arrows MT5 Filter out low probability signals from any indicator. Avoid over-trading and minimize the losses. Trade in the direction of market sentim

Harrow Strikes is an Expert Advisor that has been developed based on Harrow Order for MetaTrader 4. This is the MetaTrader 5 version and also based on Support and Resistance, Martingale and Anti-Martingale method. Since MetaTrader 5 already supports the use of hedging in trading, the algorithm of this EA has little differences from the original Harrow Order. For more information about Harrow Order, you can read https://www.mql5.com/en/market/product/28456 . Same as Harrow Order, the Support and

MeetAlgo Asian Scalper is an Expert Advisor that uses range breakouts strategy to enter trades when the market is the most quiet. It will scalp the market for small price deviations. This EA will need a good broker with small spread to work successfully. It is fully optimized for AUDCAD, EURAUD, GBPAUD, GBPCAD, GBPCHF and GBPUSD . The trades are based on several indicators and it's not a tick scalper EA. It need 1:300 leverage minimum, and a low spread broker. It is recommended to use a low spre

Easy Relative Smooth Index Easy Relative Smooth Index는 강도 지수 지표(RSI)를 기반으로 하는 오실레이터입니다. 표시기 판독 값의 현재 값은 지정된 기간 동안의 최대 및 최소 표시기 값과 비교되고 평균값이 계산됩니다. 지표 판독값도 이동 평균(MA) 방법을 사용하여 평활화됩니다. 매수 신호는 지표가 아래에서 위로 특정 레벨을 교차하는 것이고, 매도 신호는 지표가 위에서 아래로 특정 레벨을 교차하는 것입니다.
표시기 설정 설명 RSIP 기간 - 표시기 기간 계수 - 최대값과 최소값을 찾기 위한 계수 정중선 - 신호선 레벨 Applied_Price - 중고 가격 MAPeriod - 평활 기간 MAMethod - 앤티 앨리어싱 방법 경고 - 사용자 지정 데이터가 포함된 대화 상자 활성화 Text_BUY - 구매 신호에 대한 사용자 정의 텍스트 Text_SELL - 판매 신호에 대한 사용자 정의 텍스트 Send_Mail - "메일" 탭의

Regent Street, rather than an expert or an indicator, is an all-in-one trading assistant easing your trading sessions by providing signals and notifications. It's an assistant rather than a robot - "an assisted steering rather than an autopilot", and now, it autoadjusts itself to any instrument, any timeframe & any circumstance. Note from the author: Regent Street's frontend is exactly the same as an other product Ermou Street , but the backend is different. Performances for each are very relati
The EA is recommended for trading GBPUSD M5. It is based on the strategy of "waiting out", the market entry (and exit) points are determined on the basis of correlation of a number of indicators. The trading volume for opening a position depends on results of previous trades. It is possible to limit the amount of risk (the AutoMM parameter). It is also possible to set the maximum spread, above which the EA will automatically suspend trading (the MaxSpread parameter). It also has advanced feature

One of the main goals in the development of this Expert Advisor was ease of use. As a result, this EA has a minimum of parameters, which are easy to understand. At the same time, it is very flexible and customizable for almost for any instrument (currency pair).
The logic According to the given algorithm, the EA determines local support and resistance levels (at startup, the previous quotes are disregarded). When a candle closes beyond any level, a deal is opened in the same direction. By defa
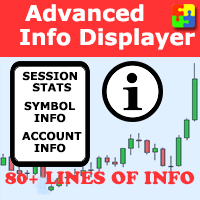
Would you like to have statistics about your trades displayed while you operate? Have you a solid understanding of the symbol you are trading? Do you really know everything you need to about your trading account? Do you need to keep an eye on the local times around the world? Advanced Info Displayer answers to all that. It helps you to know many hidden or hard to find data. Also, it is very convenient if you value statistics and maths. Just to exemplify, in more than 80 lines of information you

As the name suggests, the utility collects ticks and uploads them to a file. Each symbol receives its own folder. A directory in the symbol folder is created for each date so that you can find ticks of a necessary symbol and date quickly and easily. The collector is made as fast as possible within MQL. One collector is sufficient for each symbol. Timeframe does not matter. The utility features the function for displaying ticks collected in a file on a chart. You can also navigate ticks using a k

Slope Direction Side 기울기 방향 측면은 이동 평균을 기반으로 하는 추세 표시기입니다. 이 지표는 시장 가격의 역학 동향을 반영합니다. 가격 역학에는 세 가지 주요 추세가 있습니다: 상승 움직임, 하락 움직임 및 횡보 가격 움직임. 이 지표는 특정 기간 동안 가격 데이터를 평활화하는 추세, 가격 움직임의 일반적인 방향을 결정하는 데 도움이 됩니다. 간단히 말해서, 지표를 통해 시장의 추세를 시각화할 수 있습니다.
설정 홀 - 채널 너비(포인트) MAPeriod - 지표 기간 FilterNumber - 표시기 필터 기간 MAMethod - 평균화 방법 MAAppliedPrice - 중고 가격 경고 - 사용자 데이터가 포함된 대화 상자 Text_BUY - 구매 신호에 대한 사용자 정의 텍스트 Text_SELL - 판매 신호에 대한 사용자 정의 텍스트 Send_Mail - "메일" 탭의 설정 창에 지정된 주소로 이메일을 보냅니다. 제목 - 이메일 헤더 Send_No

One of the main goals in the development of this Expert Advisor was ease of use. As a result, this EA has a minimum of parameters, which are easy to understand. At the same time, it is very flexible and customizable for almost for any instrument (currency pair).
The logic According to the given algorithm, the EA determines local support and resistance levels (at startup, the previous quotes are disregarded). When a candle closes beyond any level, a deal is opened in the opposite direction, exp

Copyist MS — это простой и удобный в использовании торговый копир. Работает как однофайловый советник с переключаемыми режимами работы Master и Slave. Ордера можно копировать из МТ5 в МТ5, из МТ5 в МТ4, из МТ4 в МТ5. Для копирования ордеров в MetaTrader 4 требуется версия советника для MetaTrader 4. Текущая версия советника работает только на ХЕДЖИНГОВЫХ счетах. Параметры Тип работы - выбор режима работы: Master или Slave; Копировать по магическому номеру - копирование торговых ордеров по магич

This EA uses an Alligator indicator and has a classic strategy to trade as the Alligators Jaw, Teeth and Lips calculation results are compared each tick. This way, the EA opens orders at right moment and closes the orders as it reaches the right profit value. It protects your money because it is provided with: trailing stop loss to protect your profit. Once your order has a positive profit, it sets SL at a certain distance in order to keep a positive profit; Spread value limit to prevent opening

Turnover Expert Advisor는 지표를 사용하지 않으며 BUYSTOP 및 SELLSTOP 보류 주문에서만 작동합니다. EA의 모든 작업과 계산은 시장에서 보류 중인 주문과 열린 포지션을 기반으로 합니다. EA는 평균 위치에 자동 로트 증가를 사용합니다. 손실 한도는 잔액의 백분율로 지정된 음수로 설정됩니다. EA가 출시되면 두 개의 보류 주문이 접수됩니다. 주문이 실행되면 설정된 이익으로 마감되거나 주문의 이익이 수익성이 없을 경우 손실을 평균화하기 위해 같은 방향으로 추가 주문이 이루어집니다. 따라서 단방향 주문의 총 이익이 양수이면 이러한 일련의 주문은 강제로 마감됩니다.
어드바이저 설정에 대한 설명 OrderLevel - 현재 가격에서 보류 중인 주문 수준까지의 거리(포인트) TakeProfit - 주문 이익 수준(포인트) LevelAverage - 추가 평균 주문이 이루어진 후 가격 롤백 수준 TakeProfit_Average - 동시에 여러 위치에 대한

The Trade Helper indicator is a modification of the Trade Assistant indicator (by Andriy Moraru). The Trade Helper multitimeframe indicator is a good assistant for traders, useful as a filter in most trading strategies. This indicator combines the tactics of Elder's Triple Screen in a single chart, which lies in entering a trade when the same trend is present on three adjacent timeframes. The indicator operation is based on the principle of determining the trend on the three selected timeframes

Lotus indicator combines the features of both trend indicators and oscillators allowing you to track the smoothed price change rate, as well as trend strength and change. The uptrend is shown as a green indicator line, while a downtrend is displayed in red. A long position can be opened when the indicator breaks the zero level from below. A short position can be opened when the indicator breaks the zero level from above. An opposite signal of the indicator can be used for exiting positions. You

"차트에 간격"표시기는 차트에 가격 격차를 볼 수 있습니다. 가격이 가격 격차를 닫을 때까지 갭 수준은 시간이 지남에 따라 늘어납니다. 표시기는 감도를 조정할 수 있습니다-포인트 간격의 어떤 크기를 표시하고 역사의 어떤 깊이를 분석 할 수 있습니다.
자동 거래에 사용하기 위해 리포 방법에 따른 가격 격차의 번호가 사용됩니다.
====================================================================
설정 입력바-히스토리에서 가격 차이를 검색할 막대 수를 나타냅니다 -포인트 가격 격차에 대한 민감도를 나타냅니다 -가격이 상승 할 때 형성된 가격 격차의 채우기 색상을 나타냅니다 입력 갭 색-가격이 떨어질 때 형성된 가격 격차의 채우기 색을 나타냅니다 -차트에 이미 마감된 가격 격차를 표시할 필요성을 나타냅니다
Calculation panel has been developed to aid in Forex trading using a method based on correlation dependence of currency pairs. The panel implements: Due to the fact that the working instruments of the "basket" have an equal volatility and pip values, the panel provides automatic calculation of the second instrument's lot size. To analyze the relative divergence of two currency pairs, the information based on the RSI indicator values (in percentages) are shown on the panel. Information on swaps o

EFW Pattern Trader is a powerful pattern scanner for Forex and Stock trading. The pattern detection in EFW Pattern Trader uses the Fractal Wave Theory, which captures the endless up and down movement of the market. Therefore, EFW Pattern Trader can be considered as the robust price action indicator. Any patterns in EFW Pattern Trader can be backtested visually in your strategy tester. Visual backtesting with pattern will show you how pattern will likely behave in the live trading. Therefore, you

The Mercadulls Indicator gives to you 4 signals types, detecting supports, resistances and accumulation/distribution zones. The indicator constantly checks the graph for direct analysis and the appearance of long trends. Main characteristics No repaint! Stop loss and take profit levels are provided by the indicator. Suitable for Day Traders, Swing Traders, and Scalpers. Optimized algorithm to increase the accuracy of signals. Technical analysis indicator for all assets available in the market.
The EA is recommended for trading EURUSD(or EURGBP) M15 or M30. It is based on the strategy of "waiting out", the market entry (and exit) points are determined on the basis of correlation of a number of indicators. The trading volume for opening a position depends on results of previous trades. It is possible to limit the amount of risk (the AutoMM parameter). It is also possible to set the maximum spread, above which the EA will automatically suspend trading (the MaxSpread parameter). It also h

This is a utility designed to automatically set the stop loss levels of orders according to the specified condition. Two price levels serve as the condition for setting stop loss: Trigger level - when this level is reached, an order is placed. The stop loss value of an order. It is possible to enable or disable traling stop loss.
Input parameters Order type for execution - type of orders to be processed by the expert. It can either be BUY, SELL or auto-select. Trigger Level Points - level to p

The Trend Detect indicator combines the features of both trend indicators and oscillators.
This indicator is a convenient tool for detecting short-term market cycles and identifying overbought and oversold levels. A long position can be opened when the indicator starts leaving the oversold area and breaks the zero level from below. A short position can be opened when the indicator starts leaving the overbought area and breaks the zero level from above. An opposite signal of the indicator can
MetaTrader 플랫폼 어플리케이션 스토어에서 MetaTrader 마켓에서 트레이딩 로봇을 구매하는 방법에 대해 알아 보십시오.
MQL5.community 결제 시스템은 페이팔, 은행 카드 및 인기 결제 시스템을 통한 거래를 지원합니다. 더 나은 고객 경험을 위해 구입하시기 전에 거래 로봇을 테스트하시는 것을 권장합니다.
트레이딩 기회를 놓치고 있어요:
- 무료 트레이딩 앱
- 복사용 8,000 이상의 시그널
- 금융 시장 개척을 위한 경제 뉴스
등록
로그인
계정이 없으시면, 가입하십시오
MQL5.com 웹사이트에 로그인을 하기 위해 쿠키를 허용하십시오.
브라우저에서 필요한 설정을 활성화하시지 않으면, 로그인할 수 없습니다.