MetaTrader 5용 유료 Expert Advisor 및 지표 - 53

KT Forex Trend Rider uses a trend following algorithm developed specifically for the Forex market to provide reliable buy & sell signals across the major currency pairs. It works best on major FX pairs and all time-frames.
Features
It comes with a Multi-Timeframe scanner that can search for upcoming signals across all the time-frames. It comes with four preset profiles to facilitate trading for scalpers, tick-trend, swing, and trend traders. It marks the potential reversal points in the mark

In MetaTrader, plotting multiple horizontal lines and then tracking their respective price levels can be a hassle. This indicator automatically plots multiple horizontal lines at equal intervals for setting price alerts, plotting support and resistance levels, and other manual purposes. This indicator is suitable for Forex traders who are new and looking for chances to make quick profits from buying and selling. Horizontal lines can help traders find possible areas to start trading when the

The KT De Munyuk is a trend-based indicator that uses Parabolic SAR to identify the market direction. The indicator shows the PSAR in the form of green/red dots using a separate window. Buy Signal: When a green dot appears after a series of at least three red dots. Buy Exit: When a red dot appears on the current or next higher time frame. Sell Signal: When a red dot appears after a series of at least three green dots. Sell Exit: When a green dot appears on the current or next higher

Do you know what is The Blue Ocean Strategy ?
It is when an entrepreneur goes on a brand new market with no concurrence because nobody knows about it. This way, the entrepreneur is in a situation of monopoly and can enjoy this situation as long as nobody comes into the market. And you know what ? This situation is reproducible in bot trading thanks to the Blue Ocean Strategy EA MT5.
I’m a prop firm trader and I use it myself to make all my trades. After many years of use, a friend told m

KT Forex Blau Balance combines elements of momentum and volatility. It helps you identify entry and exit points.
Blau Balance consists of two moving averages (a slow-moving average and a fast-moving average) intersecting key transition points in market price. The indicator turns green or red when one is above or below the other, signaling to buy or sell trade signals.
It can be used in currency pairs and other markets that your MT4 or MT5 platform supports. Both short-term and long-term tra

2 copies left at 49 USD. Next price is 99 USD . set file
- This is a very aggressive trading strategy, based on a modified MACD indicator. It is used to analyze the anomalous zones of the market + author's methodology to restore the critical movement.
The strategy was developed taking into account the movement of the currency pair USDCHF and the best rates of trade just on it.
Recommendations:
- H1 USDCHF - Leverage of 1:500 or higher (ideally 1:1000 or 1:2000) - Minimum deposit 100 uni
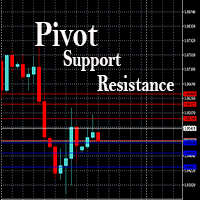
This EA is designed to calculate and draw Pivot Point, Support and Resistance for your selected time frame on the chart.
Works on all currency pair and on any time frames available on MT5.
To make sure the EA works, you need to select the pivot time frame as well as the candle shift that you want to calculate the pivot.
0 = Current candle on chart
1 = Previous 1 candle on the chart
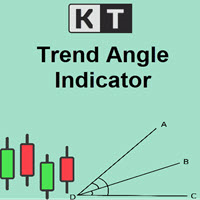
The KT Trend Angle helps to identify ranging and trending markets. The idea is to only enter a trade following the market trend if the slope is steep enough.
An angle is the ratio of the number of bars to the number of points: The bars mean the time offered by standard (M1, M5, etc.) and non-standard time frames. Points represent the unit of price measurement with an accuracy of 4 or 5 decimal places.
Input Parameters Period: An integer value to define the intensity of angled trendlines. A
The BoomAndCrashEA , based on vector machine learning, is an advanced trading tool that uses the latest advances in computing technology to analyze the forex market and predict future price movements. The Expert Advisor will use vector machine learning to learn huge amounts of historical data and quickly and efficiently detect patterns in the market. It will use a sophisticated and complex proprietary algorithm which uses advanced mathematical calculations to solve complex problems and optimize

The Average Daily Range (ADR) is an indicator that shows how far a currency pair can move in a day.
Automatically displays the upper and lower ADR levels.
Automatically calculates the percentage and distance of ADR achieved by the currency pair for the day.
Changes the color and thickness of the ADR line when the price reaches it.
The payment is made in 14 days. It is displayed on timeframes from M1 to M30.
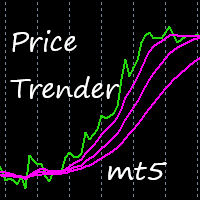
This indicator uses a special algorithm to plot the 4 lines for trading. Great for scalping. Features alerts. Settings for trend filters. How to use: Simply attach to any chart with default settings. Buy when the three pink lines converge below the green line. Sell when the three pink lines converge above the green line. Best results when looking at three or more time frames, and the three blue lines have just converged below or above the green line.
Use as you see fit for your strategy. Best r
5 EMA Scalping Strategy Multi Symbol Scanner
This EA utility will scan all symbols which are selected in marketwatch and alert when such condition is formed in chart when Candle low is above EMA 5 for Sell alert and Candle high is lower from EMA5 so you can be ready before selling or buying for scalping purpose on 5min chart For more details watch attached video Logic : When a candle closes above 5 EMA in 5 mins chart, Wait for its low to break and Sell when low is broken by wick, Your SL sh

Overview This expert advisor is based on statistic model created using historical data. Our model lead to prepare parameters to drive Martingale strategy. It plays on USDCAD pair. To work proper with full strategy EA should be able to open total positions of 3.62 lots (sum of all possible open positions at the same time) and some margin for safety. For example it can be approximately at least 1200GBP with 500:1 leverage on account. It must be able to play 0.01 lots positions. Screenshots presen

Seven copies left at $99 USD. Next price is 149 USD . set file Smooth Lift is an indicator-based trading system that includes 7 indicators, including trend indicators, volume indicators and indicators of possible price movement strength. They are used to confirm the analysis of the main Smooth Lift trading system. The trading is performed on 24/5. The strategy was developed taking into account the movement of the currency pair USDCHF and the best trading performance is on it.
Recommendations:
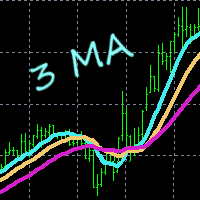
This indicator gives you a modified version of three Moving Averages. Great for scalping. Does not feature any alerts, and is best used manually after confirming multi line displays. Settings: Period1 Period2 Period3 Period4 How to use: Simply attach to any chart with default settings. Buy when the 4 lines converge below the price. Sell when the 4 lines converge above the price. Take note of the slope of Period4. See example pictures below. Best results when looking at three or more time frames

The indicator works with the objects "Trend Line", "Rectangle", "Text" and allows you to create and copy them from one chart to another.
It is a more convenient alternative to automatic copiers, because it allows you to choose more flexibly what and where should be copied.
Keyboard shortcuts:
'1,2,3,4,5,6' - creating thin horizontal lines (the color is set in the settings), the same with SHIFT - thick line ' ~' - creating a line with a random color ))) '7,8,9' - creating shaded rectangles

Optimize for time frame and asset before back test and use, use last year or monthly for parameters. XAU/USD 1 HR recommended. Parabolic works on any asset or time frame. This EA uses parabolic sar as the signal. Percentage of margin is used for entries. So for low risk it would be 1% of margin and for medium risk it would be 5-10% and high risk would be above these amounts. Also taking into account the smaller time frame or larger time frame + asset for risk management assessment.
Risk

The EA for manual trading to manage open positions.The built-in trailing stop has five modes and seven instruments. There is a virtual stop loss and a virtual take profit, which can be freely moved around the chart. With the help of the built-in trading simulator, you can check how the EA works in the strategy tester. Guide to UTrailingMinMT5 can be found in the "Comments" section. In the MT5 strategy tester, manual movement of virtual SL and TP lines according to the schedule does not work! Ben

The utility for manual trading to manage open positions.The built-in trailing stop has three modes and seven instruments: by pips, by bar extremes, by fractals, by volumes, by MA, by Parabolic SAR and by ATR. With the help of the built-in trading simulator, you can check how the EA works in the strategy tester. Guide to UTrailingMiniMT5 can be found in the "Comments" section. Benefits 3 trailing stop modes: normal, total and mobile stop loss; 7 options: by points, by bar extremes, by fractals, b

Theoretical Foundation The Keltner Channels are channels ploted using volatility deviations above and bellow a moving average. The indicator is an excellent tool to help the trader build trend and mean-reversion strategies. Parameters The Orion Dynamic Keltner allows the user to select the Volatility Calculation Type, being ATR or Average Range (not considering price gaps). Also, the user can select the Calculation Period, Number of Deviations, Moving Average Mode and the Moving Average Ca

Theoretical Foundation Similar to the well-known Average True Range (ATR), the Average Range indicator is a volatility measure that is calculated using only the range of the bars (high – low), not considering the Gaps, as with the ATR. The Average Range can be very useful for day traders as it allows one to get the measure of the volatility of the last N bars. Parameters You can select the calculation period of the indicator.

Optimized from 2004 to 2022. Optimize further after this date, use monthly or yearly. Experts need optimizing as markets develop new ranges. New Age Bot trades XAU/USD on 5 minute charts. Entry - Bollinger bands and trend trading reversals is used for entries. Stops - Trailing stops are used with ATR. Money - lots Bollinger band period - 20 MA period - 100 Deviation - 2.0 Symbol for build - XAU/USD Time frame for build - 5 minute charts Risk Disclaimer Trading foreign exchange on margin carri

reguired set file Live Siqnal - is a trading system based on the correlation of several classical indicators with certain parameters to achieve the necessary goals of market entry and exit control. The minimum number of parameters greatly simplifies the work with the Expert Advisor. The strategy is based on a classic overbought/oversold system with the possible influence of market strength on the price movement in a certain direction. Recommendations for trading: - TF H1GBPUSD - leverage 1:500
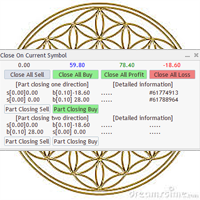
Utility / EA to simplify the exit from the drawdown. Allows you to gradually exit the drawdown correctly, reducing the volume of losing trades. At the same time, profitable trades opened on the same symbol cover losing trades in whole or in part. The volume of partial closing of a losing trade is calculated automatically. Trades opened both in one direction and in the opposite direction are supported. Position Management Closing positions only for purchase, only for sale, only profitable, only

변동성 분석기는 타이트한 거래 범위에서 통합된 후 가격이 강하게 이탈하는 경향을 이용하는 모멘텀 지표입니다. 지표는 또한 스퀴즈가 발생할 때 예상되는 움직임 방향을 보여주기 위해 모멘텀 오실레이터를 사용합니다. 이 히스토그램은 0선을 중심으로 진동하며 0선 위로 모멘텀이 증가하면 매수 기회를 나타내고 모멘텀이 0선 아래로 떨어지면 매도 기회를 나타낼 수 있습니다.
LIMITED TIME OFFER : 표시기는 50 $ 및 평생 동안만 사용할 수 있습니다. (정가 125$ )
주요 특징들 옆으로 추세 감지기. 낮은 변동성 감지기. 강세 고 및 약세 고 변동성 감지기. 모든 시간대와 모든 쌍으로 작업합니다. 팝업 알림 및 푸시 알림 알림을 제공합니다.
연락하다 질문이 있거나 도움이 필요하면 비공개 메시지를 통해 저에게 연락하십시오.
경고 모든 지표와 도구는 공식 Metatrader Store( MQL5 Market )를 통해서만 사용할 수 있습니다.
프리미엄

The movement exhaustion is a color rule that helps indicate when the movement will revert its direction. The darker the color, the greater the probability to revert. The indicator is based on the price statistic. Works on every timeframe, every instrument. Five color options: 0. Natural movement. (Gray) 1 - 4. Movement exhaustion (Yellow to maroon) The trader can use it as reversal or exhaustion signal. In a trend following trade it can be used as an exhaustion signal, indicating the movement ca

OPTIMIZE BEFORE BACKTEST AND TRADING Day trade the markets. Any market, any time frame but its recommended to trade 5 minutes for some inputs but experiment with time frames and assets to see the best . It is important to optimize the inputs of the EA before back testing and using. Last month option to a year is recommended.
Parameters for intraday trading are: Weight Weight of signal of the module in the interval 0 to 1. GoodHourOfDay Number of the only hour of day (from 0 to 23) when tra

트레이더는 거래를 시작할 때마다 자신이 한 거래의 이익과 위험을 알고 있어야 얻을 수 있는 위험과 이익 기회를 결정할 수 있습니다. 이 계산을 수동으로 결정하는 것은 특히 해야 할 공개 거래가 많은 경우 상당히 번거로울 수 있습니다.
트레이딩 패널 Katana는 트레이더가 이러한 요구를 충족할 수 있도록 도와주는 유틸리티 도구입니다. 시장을 열거나 거래를 보류하고 랏, 핍, 가격 포지션, USD 금액 및 자동으로 설정할 수 있는 위험 비율을 결정합니다.
이 유틸리티는 정확하고 사용하기 쉽게 설계되었습니다.
트레이딩 패널 Katana의 주요 기능: - 공개 거래 및 보류 중(매수 정지/매도 제한/매도 정지/매도 보류 중) - 결정 로트 크기, 핍, 가격, USD의 손익 및 잔액 비율을 자동으로 설정할 수 있습니다. - Open Price, SL, TP 선 그리기 옵션 - 선을 끌어 가격, SL 또는 TP를 설정합니다. - 쌍, 스프레드, pipvalue, 균형 및 자산

=== Next price is 299$ === 실계좌 신호 - https://www.mql5.com/en/signals/1702554 MT4 전문가 버전 - https://www.mql5.com/en/market/product/86453 기간: M1 권장 통화 쌍: EURUSD, GBPUSD, USDCHF, EURGBP, USDCAD, AUDCAD, CHFJPY, EURCHF, USDJPY.
Tsap 은 Varko Group Inc 팀의 최신 개발 제품입니다. 야간의 낮은 변동성을 기반으로 하는 다중 통화 거래 전문가 고문. EA는 고위험 그리드, 마틴게일 또는 평균화 전략을 사용하지 않습니다. 각 위치는 가상 손절매로 보장됩니다. 적응형 트랜잭션 추적 알고리즘이 사용됩니다. 또한 독특한 개발, 스프레드 및 큰 시장 점프 확대 시 거래 지원.
권장 사항: 전문가를 사용하기 전에 작성자에게 브로커 설치 및 권장 사

The Roll the Field indicator displays signals in a simple and accessible way in two colors (when to buy and when to sell is determined by changing the color). Knowing the entry point of each currency is very important for every forex trader. The intelligent algorithm of the indicator accurately determines the trend, filters out market noise and generates entry signals.
You need to optimize before back test and use Last Month or Last Year Option in Tester. This is part of this EA, which has more advanced aspects to it: https://www.mql5.com/en/market/product/87051 This Expert work towards a positive expectancy. It take positions in a hedging fashion buy and sell on both sides. A hedge account is needed in order for this EA to do as intended. The EA is based on taking both sides, the random nature of the market and the capability of one side being in a positi

Boleta para operações Long & Short na bolsa Brasileira B3 exclusiva para o mercado A VISTA com lotes padrão. A boleta calcula automaticamente as quantidades dos ativos (compra/venda) da operação baseado no capital informado. É possível determinar os horários de início e término das operações quando selecionado opção para Day Trade. A boleta pode iniciar e terminar as operações automaticamente baseado em horários. Podem ser definidos altos de Ganho (TP) e perdas (SL) em percentual (%). Basta cli
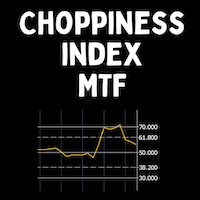
The Choppiness Index was created by Australian commodity trader E.W. Dreiss. It is designed to determine if the market is choppy (trading sideways) or not choppy (trading within a trend in either direction). A basic understanding of the indicator would be; higher values equal more choppiness, while lower values indicate directional trending. The values operate between 0 and 100. The closer the value is to 100, the higher the choppiness (sideways movement) levels. The closer the value is to 0,

TIO Impulse Trading -Автоматический торговый советник, в котором реализована среднесрочная торговая стратегия на основе Импульсный трейдинг — это стиль торговли на основе резких колебаний цены с большим объёмом . Подобные сделки могут удерживаться десятки минут, часов или в течение всей сессии. Причиной импульса может быть технический, фундаментальный или психологический фактор. Чтобы заработать на импульсных движениях, важно правильно ставить цели. Ключевым ориентиром для трейдера, ис

MT5 표시기.
이 표시기는 모든 차트, 모든 시간대 및 브로커에서 수요 및 공급 영역을 감지합니다. 기술적 분석에 적합합니다.
기본적으로 빨간색 선은 강한 판매 영역을 나타내고 녹색 선은 강한 구매 영역을 나타냅니다. 선이 그려지면(녹색 또는 빨간색) 가격이 해당 영역으로 돌아와 선을 닫을 확률이 99%입니다.
입력:
(bool) Four_candle = false : 내부 계산에 4개의 촛불 규칙을 사용하는 옵션입니다. 기본값은 false로 설정됩니다. (bool) Five_candle = false : 내부 계산에 다섯 개의 촛불 규칙을 사용하는 옵션입니다. 기본값은 true로 설정됩니다. (color) Buy_color = Green : BUY 신호선의 색상을 선택하는 옵션입니다. 기본값은 녹색으로 설정됩니다. (color) Sell_color = Red : SELL 신호선의 색상을 선택하는 옵션입니다. 기본값은 빨간색으로 설정됩니다. 첨부된 비디오는

Forex trading does not always go smoothly, causing frustration. Some Forex traders can become greedy or fearful, and for this reason, they are often inclined to make bad decisions that can negatively affect their trading. G FORCE is a stress free ea that strives to generates profits in a professional way. if you need help you can Email me at:6566kwena@gmail.com ACCOUNT TYPE: STANDARD TIMEFRAME: M30 PAIRS: EURUSD GBPUSD GBPCHF XAUUSD XAGUSD
Everything is simple. The usual Information indicator.
Shows on the chart: Current spread, buy swap, sell swap, time to close the candle, broker time.
The indicator can be placed at the top right or at the bottom right of the chart.
Most often, the spread is called the difference between the sale and purchase price.
Swap is the cost of transferring a position to the next day.

TIO Game of Coins - Советник использует старую закономерность рынка возврата к средней цене после выхода за канал волатильности. Следовательно, это не простая система «попал или промахнулся», которая выживает только благодаря использованию сетки. Вместо этого он использует реальную рыночную механику в своих интересах для получения прибыли. Поэтому проходит тесты на всей имеющейся истории с 2003 года. Советник создан для очень малых депозитов. И так же имеет малую цену. Установка: EURGBP Тайм

상품 인쇄 화면은 추가 분석을 위해 계정 거래와 이미지의 저장을 자동화하기위한 스크립트입니다. 이 패널을 사용하면 기록에서 트랜잭션 검색 및 모든 작업 매개 변수의 표시 및 그림을 사용하여 이미지 형식으로 파일 저장과 관련된 기술 작업 시간을 크게 줄일 수 있습니다.
이 스크립트는 어떤 작업을 해결합니까?:
당신은 거래 내역에서 원하는 트랜잭션을 검색 할 필요가 없습니다:당신은 단순히 기간을 선택하고 스크립트는 지정된 기간 동안 모든 무역 거래를 발견하고 가격 수준의 표시 및 트랜잭션 매개 변수 패널과 각각의 이미지를 저장합니다. 하나의 트랜잭션에 대한 정보만 저장하려면 입력 매개 변수에서 적절한 옵션을 선택하고 필요한 트랜잭션의 티켓(아이디)을 입력합니다. 파일 구성,폴더 검색 및 저장에 시간을 낭비 할 필요가 없습니다.이 스크립트는 각 파일을 원칙에 따라 자체 디렉토리로 분해하여 당신을 위해 그것을 할 것입니다./"터미널 디렉토리"/파일/"브로커 이름"/"계좌

WavePulse EA uses Price Action strategies and a built-in indicator to look for reliable signals with high winrate and low risk. The EA provides a very balanced risk-reward ratio and survives all market circumstances easily - even the most critical ones like Covid-19, Brexit, etc. It uses a martingale strategy to close all trades in profit. For more accurate trades, it is recommended to use the EA on M15 or higher timeframe. Recommend: Time frame: M15, H1. Use VPS with low latency (< 20ms). Use

One of the main definitions for monitoring the currency market is a trend, which is why the Megan indicator was created in order to display the trend in a visual form. Forex indicator Megan is a real trading strategy with which you can achieve the desired results. As soon as the indicator is set, the main indicators will immediately begin to be recalculated at the price of the traded pair, based on the postulates of technical analysis. In addition, when potential entry points are detected, visua

DESCRIÇÃO O indicador EasyFollowerTrader-Bot2-DayTrade opera apenas a favor da tendência. Assim, o indicador, em primeiro momento, observar a tendência de três médias síncrona com o time-frame selecionado. Em seguida, o indicador observar a tendência do gráfico diário. Quando estes dois gráficos estiverem se movimentando na mesma direção, teremos a maior probabilidade de ganhos. Chamaremos esta região como região de alta probabilidade de ganho. Na região de alta probabilidade de ganho, o ind

F22 Raptor is a highly reliable, low risk EA, based on statistical arbitrage idea. Expert don't use any dangerous methods of money management and suitable for any broker conditions. The Expert Advisor tracks two correlated currency pairs at once and determines the moment, when a strong divergence occurs between the pairs. Then it opens opposite trades for each currency pair. Profit is formed during the reverse convergence of currency pairs. The Expert Advisor dynamically fixes profits and limi

Optimize before use in back test or live for better results for you and don't forget to account for spreads and slippage in optimization. This Expert is for 1 minute charts trading BTC/USD. Bitcoin on 1 minute use MACD, CCI and RSI for entry and exit logic. This EA was back tested and traded out of sample. Each trade has a stop loss and take profit. BTC compared to the indexes and Gold have huge differences, look at the example of traditional investing vs. Bitcoin. Yellow line represents
"EA Maximum Breakout Scalper" - the scalper uses 2 breakout strategies. 1 - strategy for the breakdown of the nearest support and resistance levels. The system uses the search for extremes using smart technology to recognize high-quality and low-quality breakdowns, with support for filtering extremes. For the training of the adviser, the history of quotations for 22 years was used. 2 - strategy for the breakdown of the nearest candles. A smart technology is used to recognize high-quality and lo

The Average Daily Range (ADR) is an indicator that shows how far a currency pair can move in a day. Automatically displays the upper and lower ADR levels. Automatically calculates the percentage and distance of ADR achieved by the currency pair for the day. Notifies when the price reaches the ADR level. Changes the color and thickness of the ADR line when the price reaches it.
DESCRIPTION
The EasyFollowerTrader-Bot3-DayTrade indicator only trades with the trend. Thus, the indicator will, at first, observe the trend of three averages synchronous with the selected time-frame. Then the indicator observes the trend of the daily chart. When these two charts are moving in the same direction, we have the highest probability of winnings. We will call this region the region of high probability of gain.
In the region of high probability of gain, the indicator will indicate

DESCRIPTION
The EasyFollowerTrader Bot4 DayTrade indicator always trades with the trend. Thus, the indicator, at first, observes the trend of the average of the highs and lows of the candles of the selected time-frame. Then see if this trend is in line with the trend of the daily chart to operate in favor of the major trend. When these two charts are moving in the same direction, we have the highest probability of winnings. We will call this region the region of high probability of gain.
In

EA " Swing trade by porl " can use for EURUSD XAUUSD GBPUSD time frame H1 for good. The default settings can be used for saving ports EURUSD. but the minimum profit If you want high profit You can set the inputs you want. only that the value that is put into the supplied, if managing money in the port To fit, there will be a relatively stable profit. If adjusting the higher lot, the risk will be higher as well, but the profit will come according to the risk we invest. We recommend that every

MA Slope is a simple indicator that measures the slope of a specific Moving Average. We usually say that the price is in an uptrend when it is above the moving average, or it is in a downtrend when it is below the moving average. However, this information is inadequate since most of the time the market is in range. During range-bound markets, price moves back and forth around the Moving Average giving a lot of false signals. MA Slope helps identify and validate trends as it directly measures t

실계좌 신호 - https://www.mql5.com/ru/signals/1679047 MT4 전문가 버전 - https://www.mql5.com/ru/market/product/86048 기간: M1 권장 통화 쌍: EURUSD, GBPUSD, USDCHF, EURGBP, USDCAD, AUDCAD, CHFJPY, EURCHF, USDJPY.
매미 - Varko Group Inc. 팀의 최신 개발 야간의 낮은 변동성을 기반으로 하는 다중 통화 거래 전문가 고문. EA는 고위험 그리드, 마틴게일 또는 평균화 전략을 사용하지 않습니다. 각 위치는 가상 손절매로 보장됩니다. 적응형 트랜잭션 추적 알고리즘이 사용됩니다. 또한 독특한 개발, 스프레드 및 큰 시장 점프 확대 시 거래 지원.
권장 사항: 전문가를 사용하기 전에 작성자에게 브로커 설치 및 권장 사항에 대한 도움을 요청하십시오. 브로커 서버에 대해 네트워크 대

Este EA posue a opção de compra ou venda, você escolhe. Ele permanece sempre em operação, saindo de um com saldo positivo entra imediatamente na operação proxima. Não possui nenhuma estratégia de entrada com análise de mercado, apenas comprar ou vender a escolha do cliente. Ele tem um trunfo para operar martingale, Não se assuste com os resultados!! Se tiver um bom fundo de investimento usar pode usar essa ferramenta para ampliar o patrimônio. Teste muito este EA e compre sem MEDO.

A version based on David Waves' description in his book 'Trade About to Happen' of his adaptation of the Wyckoff wave chart. The indicator directionally accumulates volume, adding to each brick or candle close, with color indication for up and down. it can be used it with tick or real volume, it also changes color when the accumulated value of the previous wave is exceeded, being the trade signal. Yellow color is used for doji candlestick, it will continue with accumulation without zero the sum
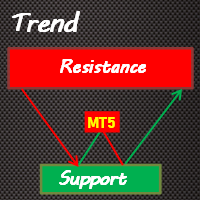
Trend Support Resistance is a fairly simple indicator that provides traders with confirmed immediate support and resistance in whatever timeframe you monitor. It's good for short-term and long-term order blocks. With the default settings, the indicator identifies critical support and resistance areas. Bearish Order Blocks are around the OrangeRed areas while Bullish Order Blocks almost always form near the LawnGreen areas. We have also added a Multi-timeframe feature that can be helpful to allow

시장 단계 표시기는 Gann 시간/가격 상관 관계를 기반으로 설계 및 구축되었으며 Forex 시장에 대한 가격 조치 특정 규칙에 따라 최적화됩니다. 시장 주문 흐름 개념을 사용하여 대량 주문에 대한 잠재적 가격 영역을 예측합니다.
지표 수준은 거래 자체에 사용하거나 다른 전략/지표의 잘못된 신호를 필터링하기 위한 조합으로 사용할 수 있습니다. 모든 거래자는 차트에 다중 시간 프레임(TF) 영역과 가격 변동 가능성을 함께 표시할 수 있는 강력한 도구가 필요합니다. 테스터 모드에서 파워를 테스트하여 레벨이 차트보다 어떻게 가격을 책정하는지 확인할 수 있습니다.
표시기 장점:
두 개의 서로 다른 영역이 있는 마킹 차트는 서로 다른 TF에 대한 추세 및 범위 시장을 지정합니다. Price Action 거래자는 이를 사용하여 다른 TF/가격 구역의 주문 흐름을 식별하거나 FTR(Fail To Return)/FTC(Fail To Continue)를 확인할 수 있습니다. 시장의 휘발

Optimize EA before test and buying. Euro King is for trading EUR/USD on 15 min time frames. Optimize to find the best stop loss and take profit for your risk management. This EA does not trade hundreds of times a day. In the test it traded 100 times in a year. Try other time frames to see if there optimizations for different results. The EA uses Bollinger bands, moving averages and RSI for logic in the entry and exits. Martingales are not used and all trades have a stop loss and a take pr

66% discount only for the first 5 buyers (4 left), main price: 300 $ Show the signal as a line graph Prediction of 10 future candles and advanced display Prediction of individual candles graphically Can be used in the gold symbol Can be used in 15 minutes time frame Can be used only in gold symbol and only 15 minutes time frame
How the indicator works:
Using complex mathematical calculations, it predicts the future 10 candles. The predictions of this indicator are based on price. Theref

Proportional Trade Correction Prop Firm trading MT5
If you found this EA, it's probably because you're in a really specific situation. Here are the conditions if you want to use this EA correctly : - You want to be a prop firm trader. - You want to use signals from MLQ5 market. - You want your trades to be proportional to the signal provider.
If you're smart and you want to leverage your money thanks to prop firm trading without knowing how to trade, here's what you may think : "I will get

The indicator will plot a line on the chart that corresponds to the closing price of the previous day, and based on this, it will plot the percentage levels of change in the price of the asset in question. It can be used on any asset. Period: Determine whether the closing price should be daily, weekly or monthly Minimum percentage: Determine the percentage for the indicator to plot the levels and sub-levels on the chart, eg 0.5 it will plot on the chart a line for every 0.5% variation and the su

Write this EA for my own use. but decided to sell it as well . The EA has a wide variety of uses. Can be set as you wish. But please understand that profits depend on the capabilities of EA users. Not just the EA alone. I try to reduce the difficulty of use. Make EA easier to use and more friendly to investors. I want everyone to try the demo before actually buying it. To make sure this EA is right for you or not. ... About setting up my EA click that youtube link.

Theory VWAP is a volume-weighted moving average, bringing greater relevance to prices. The VWAP base calculation follows the classic formula described in Investopedia ( https://www.investopedia.com/terms/v/vwap.asp ). VWAP = sum(typical price[i]*volume[i]) / sum(volume[i])
Functionalities
Orion Intraday VWAP innovates by allowing the user to choose between the conventional Daily, Weekly and Monthly periods, also having the option of calculating the Intraday indicator, as used in other platfo

Fundamentação teórica A VWAP é uma média móvel ajustada pelo volume, ou seja, o peso de cada preço corresponde ao volume de ações negociadas no período, dando mais importância ao período em que se tenha mais negociações. A Orion Vwap Bands permite que o usuário use plote 8 bandas que podem ser utilizadas como suportes e resistências para o preço. Cada banda é calculada a partir da Vwap Tradicional:
Ex.: Se escolhermos o valor 0.25 para a plotagem da Banda 1, pega-se o preço da Vwap e acrescen
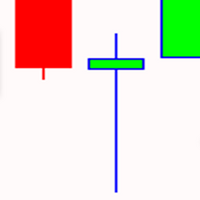
OPTMIZE EA BEFORE BACKTEST AND USE. Gold Pin Bar trade XAU/USD on 1HR charts using moving averages and pin bars. Pin bars are used to pick higher probable trades that can occur. The price is pushed up or down forming the pin bar signaling who has control over the price. Optimize for the best settings for stop loss and take profits and don't forget to account for spreads and slippage in optimization. . All order have money management and the EA doesn't use dangerous trading strategies. Rest as

Hello;
This product generates buy and sell signals from the intersection of two moving averages. It uses all the capabilities of the moving averages. To generate a scalping strategy, a take profit level is determined after the signal level. To stop the loss, it uses the reverse signal. The system can increase the lot amount according to the fibonacci ratios after each loss .To disable this margintale feature, you will need to enter the low lot and high lot amounts the same. So you can work wi

OPTMIZE EA BEFORE BACKTEST AND USE. United States Stock Market Index US500 trades the 5 minute charts. The EA uses RSI and Stochastics for entries and ATR for exits. The building period was From 2021-03-19 to 2022-08-18. Continually optimize the EA to find best settings and don't forget to account for spreads and slippage in optimization . The EA does not use martingale and has a sl and tp on each trade with a fixed lot input. Try it out in the back test, optimize for settings.
Risk Di

Strangely enough, everyone seems to have their own idea of how you should measure support and resistance. Not every support and resistance zone is strong. The strongest support or resistance levels will more often than not be with trend . What this means is, if we are in a bull trend, pullback levels to support will more often than not be ‘stronger‘ than resistance levels above. These expert advisors use several mathematical models and statistical models to determine the strongest support and r

Do not buy before seeing the Danko Trend Color product, as this panel is a way to view a summary of this indicator on various timeframes.
The Danko DTC Panel utility allows you to look at the trend in up to 5 timeframes. When clicking on the timeframe texts, a new window will open with the indicator plotted on the screen so you can see the complete chart. The width of the panel, with the amount of candles you want to see, is customizable, see the images below.
Ao clicar nos textos dos timefra

It is an indicator used to identify support and resistance points from the daily VWAP and you can use it to check the best entry and exit points.
The calculated value of the channel distance can be calculated in several ways:
- Manual Defining the value to be projected to calculate the distance of the channels.
- Automatic Select the timeframe to be used. Regardless of the graphic time that is on the screen, if the parameter is changed to H1(One hour candles), the system will c

Boom and Crash Buy and Sell Trend. Non-repaint. Can be used on all timeframes 1 minute for scalpers. 5 minute to monthly timeframe for swing trading. works on all boom and crash pairs Crash300, Crash500, Crash1000. Boom300, Boom500, Boom1000. Green histogram colour means the trend is up(bullish) Buy signal. Dark orange histogram colour means the trend is down(bearish) Sell signal.
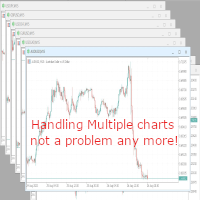
With this script you can open or close multiple charts with just one click. Please follow the instructions below; Set your desired symbols in the market watch window. Open one chart. Attach the script to the chart In the input values just select the time frame of your chart. Set open chart value to true. Click ok. To close the charts follow step 3 and 7. In input values set open chart value to false and close chart value to true
MetaTrader 마켓은 거래로봇과 기술지표를 판매하기에 최적의 장소입니다.
오직 어플리케이션만 개발하면 됩니다. 수백만 명의 MetaTrader 사용자에게 제품을 제공하기 위해 마켓에 제품을 게시하는 방법에 대해 설명해 드리겠습니다.
트레이딩 기회를 놓치고 있어요:
- 무료 트레이딩 앱
- 복사용 8,000 이상의 시그널
- 금융 시장 개척을 위한 경제 뉴스
등록
로그인
계정이 없으시면, 가입하십시오
MQL5.com 웹사이트에 로그인을 하기 위해 쿠키를 허용하십시오.
브라우저에서 필요한 설정을 활성화하시지 않으면, 로그인할 수 없습니다.