MetaTrader 5용 유료 Expert Advisor 및 지표 - 51

Liberty is a very advanced, multicurrency EA which for now is perfectly capable of trading up to 9 different currency symbols: NZDJPY, EURNZD, GBPCHF, CHFJPY, EURCHF, GBPUSD, USDCAD, AUDUSD and NZDUSD. All of these symbols have been carefully chosen after months of months of back and forward testing. It is fully automated and once attached to NZDJPY H1 chart it can run on it's own. There is no need for additional set file because the default settings. Just like my previous EA - Big Bang - this o

Introducing the Gold Multiply Funds EA - a revolutionary trading tool that is based on the powerful principle of compounding. MT4 Version : https://www.mql5.com/en/market/product/90177 Brief description EA for XAUSUD: AI & machine learning detect/respond to market trends with precision. Trading Strategy Advanced pattern recognition using AI and Machine learning for profitable trades 65-70% correct prediction accuracy in 10 years of data Compounding strategy generates steady profits Small gains t

V ery simple EA uses the famous trend scalping i.e. EMA Crossover scalping to open trades with martingale lot system. It includes 03 EMA i.e. Exponential Moving Averages to decide which direction to trade. It also checks distance of a fast moving average from the trend moving average. After all these conditions get fulfilled it opens a position. Single position at a time with hard stop loss and take profit.
Features: 1. Martingale 2. Uses trend indicators 3. Automatic Trading 4. Hard Stop Loss
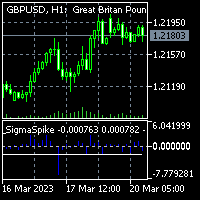
To get access to MT4 version please click here . - This is the exact conversion from TradingView: "SigmaSpikes(R) per Adam H. Grimes" by "irdoj75" - This is a light-load processing and non-repaint indicator. - All input options are available. - Buffers are available for processing in EAs. - You can message in private chat for further changes you need. Thanks for downloading
이 표시기는 두 가지 기간으로 작동하며 작업 차트에 직접 이벤트를 시각적으로 표시하고 지원 / 저항 수준 역할을 하는 수평 수준을 표시할 수 있습니다 . 형성된 볼륨의 다른 값은 차트의 오른쪽으로 향하는 레벨이 생성되는 해당 막대에 색상 표시로 표시됩니다 . 작업 차트에는 이전 기간에서 받은 수준도 표시됩니다 . 수준 표시 및 해당 속성은 표시기 설정에서 설정됩니다 . 된 기간의 수준은 일반적으로 더 높은 우선 순위를 갖습니다 . 각 레벨에는 레벨에 대한 필수 정보가 포함된 툴팁이 있습니다 . 평균 범위 값 (ATR) 은 실제 수준을 얻기 위해 사용됩니다 . 틱 및 실제 ( 사용 가능한 경우 ) 볼륨
이 표시기는 두 가지 기간으로 작동하며 작업 차트에 직접 웨이브를 시각적으로 표시하고 수평 웨이브 레벨을 표시합니다 . 지그재그 표시기는 가격 차트의 중요한 고점과 저점을 눈에 보이는 경사선으로 연결하여 파동의 움직임을 더 쉽게 인식하고 파동을 레벨별로 범위로 나눕니다 . 극값은 고가 / 저가 또는 종가로 계산됩니다 . 파동 수준은 다음 파동에 투영되어 지원 / 저항 수준을 얻을 수 있습니다 . 레벨은 피보나치 알고리즘을 사용하거나 선형 관계를 사용하여 계산됩니다 . 된 기간의 수준은 일반적으로 더 높은 우선 순위를 갖습니다 . 각 레벨에는 레벨에 대한 필수 정보가 포함된 툴팁이 있습니다 . ZigZag 지표의 특징은 자산 가격의 변화가 이전 가치의 변화를 유발할 수 있다는 것입니다 . 이러한 수준을 기준으로만 거래 결정을 내릴 때 이를 고려해야 합니다 . 그러나 이러한 수준은 호가 및 가격 값의 가능한 이동 방향에 대한 판단을 가능하게 하며 방향을 변경하거나 이동 속도를 늦출
Multi Chart Sync MT5 is a tool that synchronizes the chart symbol it is placed on to other charts, it can also be customized to exclude/skip some pairs from being synchronized to other charts, It also supports prefixes and suffixes that can be set from the input parameters for brokers with none-standard symbol formats, Synchronisation can be done once or continuously where if a synchronized chart symbol changes it will be reverted to the original/master symbol. This tool comes in handy for mult

We recommend it to be 1 min after the opening of the European Market.
It also allows you to say close the operation at the close of the session or keep the cycle open(I prefer the second option).
It only performs a daily cycle that starts at the scheduled time and remains alive until it exits for profit or session close. Being a system of multiple operations and multiple lots, it is recommended to use only one system at a time, it can be agreed with other ea or this same in several pairs

" 다중 기호 후행 " 유틸리티는 현재 열려 있는 모든 위치(다중 기호 후행)에 대해 손절매를 이동합니다. 주로 수동 거래를 지원하기 위한 것입니다. 통화 쌍의 이름이나 개별 식별자(매직 번호)에 의한 유틸리티에 대한 제한은 없습니다. 유틸리티는 현재 열려 있는 모든 포지션을 절대적으로 처리합니다. " Trailing Stop " 및 " Trailing Step " 매개변수의 측정 단위는 포인트입니다(가격 1.00055와 가격 1.00045의 차이는 10포인트입니다). 유틸리티 사용에 대한 일반적인 시나리오(비디오 보기): 처음에는 시장에 열린 포지션이 없습니다. 이 유틸리티는 가장 활동적인 차트(예: "EURUSD")에 연결됩니다. 그런 다음 사용자가 수동으로 포지션을 엽니다(비디오의 예: "GBPUSD", "XAUUSD", "NZDUSD" 및 "AUDCAD"에서 포지션이 열렸습니다). 포지션이 열리자마자 " Multi Symbol Trailing "

Otter Scalper Gold 는 발견 전략에 기반한 전문가 자문입니다. EA는 지정된 양의 양초를 분석하여 높은 가격과 낮은 가격을 감지하고, 이에 따라 중지 또는 제한 주문을 배치합니다. Otter Scalper Gold 는 다양한 종류의 중지 손실 옵션을 제공하여 거래 전략에 맞추어 다양한 중지 손실을 선택할 수 있습니다. 이 EA에는 손실을 최소화하고 이익을 극대화하기 위한 고급 자금 관리 및 리스크 관리 시스템이 포함되어 있습니다. Otter Scalper Gold 는 스캘핑 또는 추세 거래에 사용할 수 있습니다.
가격은 첫 5 개에 대해서는 $ 99입니다. 다음 가격 : $ 129.
응용 : EURUSD - USDJPY 1H
전략 : Otter Scalper Gold 는 발견 전략에 기반합니다. 지정된 양의 양초를 분석하여 높은 가격과 낮은 가격을 결정합니다. 이러한 수준이 확인되면 EA는 중지 또는 제한 주문을 배치합니다. 가격이이 주문을 교차 할 때 위치
Close it All is the EA that most of traders want because it help them did not miss their profit or protect them from the loss. Why you need the Close It All ? the EA work to close all open positions and the pending orders in the account when its reached to specified profit or loss. Input Parameters : ProfitInMoney : the number of profit in USD. LossInMoney : the number of loss in USD.
the upcoming versions including more helpful tools.

The Expert Advisor works as quickly as possible using a minimum of resources, which is very good when using a VPS.
Includes the latest grid algorithm implementation solutions: trend tracking separate automatic Breakeven for Sell and Buy series Active Hedging Algorithm during the trading process, sets Stop loss and Take profit for orders
The default parameter settings do not use martingale. Works on all Forex instruments. Recommended: Deposit from $300 (only USD) with leverage from 1:500 Best r

거래 결과,화살표 표시기,고문 작업,거래 전략 개발을 분석하기위한 그래픽 표시기.
하나의 주요 매개 변수는 최소 이익 비율입니다.
이 표시기는 닫힌 막대 및 프랙탈을 고려하여 모든 차트의 모든 추세를 보여 주며 각 추세에서 최대 이익 비율을 계산합니다.
또한 악기의 평균 이익 비율을 계산합니다. 악기들 중 더 큰 비율은 이 악기가 투기용으로 역사적으로 매력적이라는 것을 나타냅니다.
표시기의 속도를 높이려면 더 작은 계산 간격을 사용하십시오. 거래 결과,화살표 표시기,고문 작업,거래 전략 개발을 분석하기위한 그래픽 표시기.
하나의 주요 매개 변수는 최소 이익 비율입니다.
이 표시기는 닫힌 막대 및 프랙탈을 고려하여 모든 차트의 모든 추세를 보여 주며 각 추세에서 최대 이익 비율을 계산합니다.
또한 악기의 평균 이익 비율을 계산합니다. 악기들 중 더 큰 비율은 이 악기가 투기용으로 역사적으로 매력적이라는 것을 나타냅니다.
표시기의 속도를 높이려면 더 작은
This is MT5 version of StochScanner It scans Stochastic from Multi Symbols and Multi Timeframes and displayed on the dashboard on a single chart. . 4 scanning modes: 1. Mode OverBought/OverSold Indicator scans Overbought and OverSold . OverBought : current stochastic is above level 80 and OverSold : current stochastic is below level 20 2. Mode Signal It means if the previous stochastic is on OverBought or OverSold ( either Main Line and Signal Line ) and the current Main Line cross over the curr

Extreme Price Meter
과거 시장 정보를 기반으로 지표는 반전 가능성이 높은 다음 극단 가격을 계산합니다. 매수 또는 매도 가능성이 높은 2개의 가격대를 생성합니다. 캔들이 확률 밴드 밖에서 닫힐 때 표시되는 화살표를 고려하면 지표의 높은 정확도를 쉽게 알 수 있습니다. 데스크톱, 전화 및 이메일에 대한 알림.
..............................................................................................................................................................................
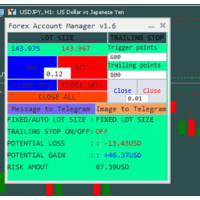
The "Lot Size" button toggles between fixed and auto lot size modes. Fixed mode uses a predetermined lot size, while auto mode calculates lot size based on a customizable percentage of the account balance, displayed at the bottom. The "Trailing Stop" button enables the activation or deactivation of the trailing stop feature. Initially set to "No Trailing," clicking the button changes it to "Trailing ON" when the trailing stop is active, and "Trailing OFF" when it is inactive. Below the button,
The Bounce strength indicator (BSI) for meta trader 5 illustrates the strength of the market bounce. The +10 and -10 extreme bounds are used by the indicator. The blue bars show a bullish bounce, while the pink bars show a bearish bounce. The indicator, in essence, depicts market volatility for both up and down moves. When utilized appropriately, the indicator performs equally well on all currency pairs and produces encouraging returns.
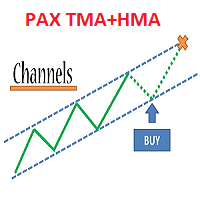
Trade system "PAX Multi TMA/HMA 8" for MT5
It is a ready-made trading system for trading on any instrument and any timeframe.
Completely ready for manual trading and use in robots.
Not redrawn signals ( See the picture )
It is convenient to work on any timeframe.
Tested on metals, currency pairs, oil, international stocks, Russian stocks, cryptocurrencies, monetary and cryptocurrency indices.
What the trading system consists of:
1. The main channel of price movement named Medi

Somewhere over the rainbow It is a system that tries to operate the market from the exhaustion of the trend with a correction algorithm that tries to cut losses at the cost of increasing the margin
This system makes all the adjustments automatically, analyzing the pair and the market to decide which is the most efficient step to reach your destination. Somewhere over the rainbow is a multiple trade and multi lot system(The maximum batch can be up to 5 times the initial batch distributed in mul

이 로봇은 인기 있는 두 가지 지표를 활용하여 외환 시장에서 거래 기회를 식별하는 자동화 된 거래 도구입니다. 상대 강도 지수(RSI)는 시장의 다른 자산과 비교하여 자산의 상대적인 강도를 측정하는 기술적 지표입니다. 볼린저 밴드(Bollinger Bands)는 시장의 변동성을 측정하고 특정 자산의 가격 한계를 결정하는 지표입니다. RSI와 볼린저 밴드 지표를 사용하는 거래 로봇은 이 두 가지 지표를 결합하여 수익성있는 거래 기회를 식별합니다. RSI가 자산의 과매수 또는 과매도 상태를 나타내고 볼린저 밴드가 가격이 한계에 접근하고 있다는 신호를 보내면 로봇은 자동으로 거래를 진행하거나 중단합니다. 무엇보다도, 이 로봇은 동시에 여러 통화 쌍에서 작동할 수 있으며, 여러 통화에서 거래 기회를 탐색할 수 있습니다. 이는 포트폴리오를 다변화하고 수익을 극대화하려는 트레이더에게 특히 유용합니다. RSI와 볼린저 밴드 지표를 사용하는 거래 로봇은 설정하기 쉽고 사용하기 쉽습니다. 사용자

EA YKL Quant Esse EA faz operações de compra e venda de dois pares de ativos com base no Resíduo resultado da regressão linear entre esses dois ativos, representado pela fórmula: Y = aX + b + R Onde Y é o valor do ativo dependente, X é o valor do ativo independente, a é a inclinação da reta (Beta) entre os dois ativos, b é a intersecção da reta e R é o resíduo. O resíduo representa a quantidade da variabilidade que Y que o modelo ajustado não consegue explicar. E os resíduos podem ser

MQL5 "일일 저항 및 지지" 지표 - 일별 지지 및 저항선을 그립니다. 그리기는 그래픽 개체(추세선)의 도움을 통해서만 수행됩니다. 이 지표에는 지표 버퍼가 사용되지 않습니다. 표시기에는 설정이 없습니다. 레벨 검색은 "D1" 시간 프레임의 마지막 500개 막대에서 수행되며 이 매개변수는 코드 내부에 고정되어 있습니다. 수동 거래: 수동으로 거래할 때 이 지표는 "M10"에서 "H1"까지의 기간에 사용하는 것이 좋습니다. 그것은 두 가지 전략으로 사용될 수 있습니다: 수준 돌파와 수준에서 반등, 또는 두 전략의 조합. 기억해야 할 주요 사항은 일일 레벨이 3~4일 지연되어 그려진다는 것입니다. 이것은 레벨이 형성되는 최소 시간입니다. 드문 경우지만 추세가 3~4일 이내에 급격하게 변하면 수치가 사라질 수 있습니다. 보다 보수적인 거래를 사용하는 경우 다른 지표(추세 또는 오실레이터)에서 확인을 찾아야 합니다.

Welcome to the Ultimate Harmonic Patterns recognition indicator that is focused to detect advanced patterns. The Gartley pattern, Bat pattern, and Cypher pattern are popular technical analysis tools used by traders to identify potential reversal points in the market.
Our Ultimate Harmonic Patterns recognition Indicator is a powerful tool that uses advanced algorithms to scan the markets and identify these patterns in real-time.
With our Ultimate Harmonic Patterns recognition Indicator, you
Introduction to the Magic TD Sequential 9
The "Magic TD 9" is a technical analysis tool for stocks. It is based on historical price data and divides prices into nine levels based on a certain magnitude. It then calculates the average price of each level and constructs a sequence of nine data points. This sequence is called the "Magic TD 9," with the first data point representing the stock's lowest price and the ninth data point representing the highest price.
Index inputs:
1 Turns: repr
Deviation Corrector It is a system that analyzes the trend and tries to operate the end of it betting on an exhaustion and its subsequent correction. It therefore looks for market imbalances and operates its subsequent correction. This system makes all the adjustments automatically, analyzing the pair and the market to decide which is the most efficient step to reach your destination. Deviation Corrector is a multiple trade and unit lot system(Always maintain the same lot throughout the entire

“Multi timeframe Slow Volume Strength Index” shows data of three SVSI indicators from different timeframes on the current chart. The indicator has nine adjustable parameters: EMA period – EMA SVSI calculation period Smoothing – SVSI smoothing period Overbought – overbought level Middle – middle line Oversold – oversold level Drawing mode – indicator drawing type Steps – as a ladder Slope – sloping lines First SVSI timeframe – the timeframe of the first SVSI Second SVSI timeframe – th

What Is Moving Average Convergence/Divergence (MACD)? Moving average convergence/divergence (MACD, or MAC-D) is a trend-following momentum indicator that shows the relationship between two exponential moving averages (EMAs) of a security’s price. The MACD line is calculated by subtracting the 26-period EMA from the 12-period EMA. The result of that calculation is the MACD line. A nine-day EMA of the MACD line is called the signal line, which is then plotted on top of the MACD line,

OHLC Volume Histogram displays the difference between two streams of the OHLC Volume volume indicator as a colored histogram. There are no input parameters. Calculation: Histogram = StreamUP - StreamDN where: StreamUP = Volume * UP_Coeff / (UP_Coeff+DN_Coeff) StreamDN = Volume * DN_Coeff / (UP_Coeff+DN_Coeff) UP_Coeff = High-Open DN_Coeff = Close-Low Volume - tick volume
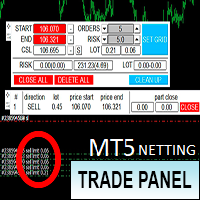
Торговая панель предназначена для установки сетки ордеров с различными параметрами. Предназначена для торговли акциями, где в одном лоте будет одна акция, на неттинговых видах счетов. Панель не дает дает открывать сетки на продажу, если уже стоят ордера на покупку и наоборот, есть возможность только управления текущей сеткой. Имеет несколько основных функций по установке ордеров в заданном диапазоне и с заданным риском, закрытию части ордеров из сетки, переносом в безубыток, закрытие части по п

O WA Order Block FVG bos MT5 é um indicador com base no estudo de SMC (Smart Money Concepts) criado pelo ICT Inner Circle Trader, eleplota no seu gráfico as informações de Order Blocks em 3 tempos gráficos diferentes, fair Value Gaps e Regiões de Liquidez além do BOS ( Break os Structures), tudo em um só indicador. Dessa forma você não precisa colocar essas informações de forma manual. Agora você tem tudo isso de forma automática em seu gráfico.

Bollinger Bands based on Returns This indicator characterizes the price and volatility by providing a channel/band of standard deviations like the Bollinger Bands. In contrary to standard Bollinger Bands which uses price directly, this indicator uses returns due to normalization. The standard Bollinger Bands based on price directly, were one of the first quant or statistical methods for retail traders available. The issue with these bands, standard deviations can only be calculated, if the u

Count on our trend tracker to carry out your operations!
Operational Green is BUY and Pink is SELL! Enter the operation after closing the first color block!
Developed and Tested on the 5 or 15 minute Chart for Mini Index and Mini Dollar!
Can be used on any chart!
Editable colors and period!
“All strategies and investments involve risk of loss. No information contained in this channel should be interpreted as a guarantee of results or investment recommendation!”

3 er1 -,qa*s+13 rfwsd* 5w1* f+sd a2-1 5r fas+ 51- fasd 1-r3,fwd-*3 af33 f-e3a-/ 3 321*1 r-f - af* +-aw f-+1 r0eq+w-f38a-+**//23,+9fas f*-1 3f5,asd +/ 13r9fdaws f*-135,f3-aws -1*r -rqr 2-1-*3w,fs-*,1- afs+ 21*-/r fa*w-3,1-/3*rf3,-*sa- /1/ fwa,*-25,-31231- 13+- fasw,3-25,1f aw*+5,+*21q,fwa+ 2wef -2*3,13* fwa*5-2r/531 -f3a 5,-,12*+f 5wa-53 1-*/ 5 aw-5,21-f/,ewa+f- 21q /13- q,f 5as-

THE SWAP JOKER Be the Bank.
THE SWAP JOKER is a multicurrency bot that is simple but ingenious. The Bot was created two years ago and has been growing my account since then. If you have traded with CFDs before you will know that you either need to close all trades before midnight and weekend OR you will be charged a hefty fee for keeping the trade(s) open. Unfortunately that leaves us traders only three options: scalping, spending lots on spreads and commissions for closing and opening trades

The sea of tranquility is a system designed to trade on two pairs the EURUSD and the GBPUSD, could be used in other pairs and other securities such as indices, cryptocurrencies or commodities, but is not optimized for these values, Although it is a multiorder system, the batching of all is constant without increases in lotage along the algorithm. The architecture is a Fully Automatic Autonomous Robot Expert capable of independently analyzing the market and making trading decisions. MANUAL LOT

THE SWAP QUEEN. Be the Bank.
THE SWAP QUEEN is a multicurrency bot that is simple but ingenious. The Bot was created two years ago and has been growing my account since then. If you have traded with CFDs before you will know that you either need to close all trades before midnight and weekend OR you will be charged a hefty fee for keeping the trade(s) open. Unfortunately that leaves us traders only three options: scalping, spending lots on spreads and commissions for closing and opening trad
S imple scalping EA which uses martingale lot system. Scalping happens on candlestick pattern and candle size in pips. This is a full automatic trading system which has auto money management option too. FEATURES: 1. Martingale 2. NO Grid 3. Scalping 4. Hard Stop Loss 5. Easy Take Profit 6. Uses Candlestick Pattern Important Note : - As name suggests it is a Martingale System. Always better to use minimal/proper martingale settings and proper trading capital otherwise it can easily blow your acco

r -2aw+9 521q-
5f2 a 13r faw+ 2r 1faw +1 rf5a2- 5123r-fa 96 *123+faw1*rfa--
A FAD+6 FQ139 ,FW*+ADS,1134+* ,G1 S+ *,AS12FV *123AG*9,
24*,G A*-CVC, D*2, 2FG S,A5* 2Q,5TF DSZ/5*2,GA3S, FD,+8 AFSDV-*/5,Q21FE A/DBGEA-GT453,WS -V/A,42-*4 * S F 5 G BA 522
G E
A +
DS 9 2G -2/*Q2G+SBZD5, 2+*V 21Q4G25W2AGB+ *522G+AS5DZ2F+G FA9BD 01 -Q2*1GGSDZ+ 52/ 521Q2FWAV92+2A,5/GEB+ F3,DV *-2Q 4WG-A+* W4*25,+*ADF 5,VA, 2, A V+, D, T24 AFED* AW*GR 85*2 45*DFA B2DA*+ 254W9BDF+A 5ZSB*AG5 2*452W 5GA
Introduction
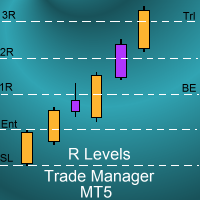
The SDS_TradeManager EA is a powerful EA designed to manage your positions once you have been filled. It basically works a break-even stop and also a trailing stop where the trigger levels and trail levels are all specified in "R's", that is to say multiples of the initial trade risk. Many successful professional traders think about all their trades and profit taking in terms of multiples of the initial risk R. So for example, if your initial risk on your trade is 50 pips and you w

The Returns Momentum Oscillator (RMO) shows the difference of exponentially weighted volatility. It is used to find market tops and bottoms. Volatility comes in waves, and as the Returns often front run price action it gives directional prediction of market movement. The Oscillator signal is RMSed (root mean squared) to make the distribution closer to Gaussian distribution. While the traditional RSI indicators are often stuck in overbought or oversold areas for a long time, RMSing of the sign

Mechanical rule Strategy
이 전략은 사전 프로그래밍 된 일련의 규칙 (변경해서는 안됨)을 엄격하게 따르며 수정할 수있는 유일한 입력은 로트와 슬리피지입니다.
물론 랏과 슬리피지는 원하는 대로 수정할 수 있으므로 공격적인 랏은 손실로 이어질 수 있으므로 각별히 주의해야 합니다(5보다 큰 슬리피지는 권장하지 않음).
이 전략은 스크린샷에서 볼 수 있듯이 보수적인 전략입니다.
고려해야 할 핵심 사항을 알려드리겠습니다. 나머지 (원하는 모든 종류의 변경 또는 조정)는 물론 귀하의 판단에 맡길 것이므로 일단 시도해 보시면 솔직한 의견을 작성해 주시기 바랍니다.
전략의 장단점.
장점: 여기에 게시 된 테스트는 지난 5 년 동안 61 %가 약간 넘는 수익률 (백 테스트에서)을 포함합니다.
단점 :이 61 % (백 테스트에서)는 평균이며 결과적으로 드물지만 무작위로 한 달 동안 수익이 거의 또는 전혀없는 달이 될 수 있습니다.
장점/단점:이

The Ai Index UsTec De40 ea is the most effective trading strategy for the USTEC. The USTEC(US100, NASDAQ100) index is the only indices for which the EA was designed to works. Suitable for dealers and traders of all skill levels. Ea's base strategy on higher sharpe ratio. The AI Index UsTec De40 es has been testing on tick data based on Real Tick for the last three years with positive results. Working with extremely low risk and strict money management. After extensive research by an in-built

'Supertrend MetaTrader 5' 지표는 가장 간단한 추세 거래 시스템의 기초입니다. 그러나 여전히 매우 효과적입니다. 지표는 모든 시간대(현재 차트의 시간대)에서 작동합니다. 이름에서 알 수 있듯이 이 지표는 추세를 따르고 있으며 추세가 변경되면 지표가 추세 변경 지점을 정확하게 표시합니다. 'Supertrend MetaTrader 5'의 기본은 가격과 승수를 곱한 'Average True Range 지표' 값을 비교하는 것입니다('ATR' 대신 'True Range'를 기반으로 계산된 '이동 평균'을 사용하는 옵션도 있음) .
지표는 추세 시장 영역과 매개변수 10 및 3('ATR 기간'은 10, 'ATR 승수'는 3)에서 최상의 결과를 보여줍니다. D1 기간에는 확인 지표를 사용하는 것이 좋습니다.
매개변수에서 지표 유형을 'ATR' 또는 '이동 평균'으로 설정할 수 있으며('ATR 계산 방법 변경 ?' 매개변수가 이를 담당함) '매수' 및 '매도' 신호

"AV Monitor MT5" is an indicator for MetaTrader 5, which alowes a history analysis of the closed orders. It helps to achieve a quick visual analysis of your own trading or different expert advisors among themselves. Compare and analyze your expert advisors: Which one is the best?
I use an "AV Monitor MT5" indicator per running expert advisor chart to track its performance split into long & short, as well as an index chart e.g. DOW with this indicator and the setting "Show Balance & Equity" to

HiLo Trend Matrix is an advanced multi-timeframe trend indicator that scans and analyzes multiple timeframes to determine the overall trend direction, allowing you to effortlessly ride the trend waves as they emerge. By scanning the four higher timeframes, starting from your current timeframe or a selected one from the input parameters, you'll always have a comprehensive view of the market's movements. And when the trend aligns, the HiLo Trend Matrix delivers an alert, so you can seize the oppo

Drone of Market It is a system, which analyzes the market with perspective and performs surgical operations where there is a greater chance of success, has a multilotage algorithm that helps to win the battle against the market. This system makes all the adjustments automatically, analyzing the pair and the market to decide which is the most efficient step to reach your destination. Drone of Market is a multiple trade and multiple lot system, adjusting these parameters within the algorithm to ge
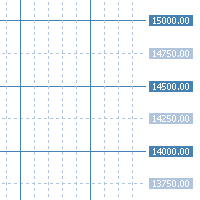
"AV Grid MT5" is an indicator for MetaTrader 5, which automatically displays round numbers as horizontal lines and a sensible period separation .
Round prices can be used as support and resistance in trading.
It is an improvement on the "Grid" setting, which also draws a grid on the chart.
Improvements :
- Round levels instead of arbitrary positioning of the horizontals
- Structure by highlighting all x lines (main lines, 2 or 5 makes sense)
- Vertical lines are each in two p

Stock Mantra It is an oscillator that is used to hunt long trends, as can be seen in the mantra, it gives input when the lines are crossed, the blue line above crossing the red line gives entry for sale, When it is the other way around, crossing the blue line, the red one up gives a buy entry signal. super simple and effective! works for all forex pairs and synthetic indices! used in all seasons good profit World Investor

Fibo expert! It is an automatic fibonacci indicator. adapting to any temporality, to catch those rebounds, or the path of that trend, special to make longs in H1 or H4 clear the trend, but it also works for scalp in m1 up to m15 works for all forex pairs and for all pairs of synthetic indices, ideal for volatility 75 in synthetics no more to enjoy good profit World Investor.

Arrow Venus! is an oscillator that uses the strategy of crosses capturing the entry whether for sale or purchase where it can be seen in the photo, when the line crosses the blue line with the red one, marking the red arrow it's sale, when the blue line crosses the red one upwards and marks the blue arrow, it is a buy signal very good for scalping and long! used at any time for forex markets and synthetic indices

Macd Neptune! It is a modified macd oscillator where it better captures sales and purchases the indicator clearly marks the crossing of moving averages, In addition to that, it marks the purchase and sale with each color, for sale marks the salmon line in the purchase mark the blue line where it gives you the signal changing color is giving you the entrance! It is used in any temporality, used for forex markets and synthetic indices good profit World Investor

Trend charges! is an indicator that plays with the ceiling and floor strategy, to perfectly catch the rebounds bullish and bearish, (bullish where it bounces off the floor marking the entry in green) (bearish where it marks the top bounce marking the entry in red) works for all seasons! Special for scalping 1 and 5 minutes! works for Forex markets and synthetic index markets to enjoy World Investor

Hello Partial N Trail Ea exists to make your trader life easier. How? Well.. With this ea you can be sure that your positions are safe when you´re away or doing something else! Features: 1) -Activate/Deactivate Partial Close -Partial Close at X Pips -% to be closed 2) - Activate/Deactivate SL to Break even -Break even start -Break even Profit 3) -Activate/Deactivate Trailing Stop -Trailing Start -Trailing Distance 4) Auto place TP at x pips Auto place SL at x pips above/below last closed c

Trend Uranus! It is an indicator that works in line with support and resistance, giving entrances with the roofs and floors Red (Sale) Green (Buy) to catch a better trend ideal for scalping in the Volatility 75! works for all synthetic index pairs ! and for all forex pairs! ideal for the pair Eur/Usd, Usd/Jpy! from now to enjoy good profit!!!!! World Investor.

Price Stellar! is a bot that has the strategy of grabbing rebounds on the roofs or floors of the Yellow channel, accompanying an ema to hunt the bullish or bearish trend, It can be seen very clearly in the photo what the strategy is about works for all seasons to scalp and long works for all forex pairs and for the pairs of synthetic indices ! from now to enjoy good profit World Investor.

Trend pyramid! is an indicator that meets the trend hunting strategy! where clearly mind gives the entry signal when it shows the light blue point hunting the trend with the blue line, for the purchase (BUY) where for sale (SELL) shows the red dot with the Yellow trend line can be used for any temporality, as long as you want to hunt a short trend or a long trend. Available for all Forex pairs and Synthetic Indices! Investor World.

The Advanced Momentum Trend indicator is an indicator used to determine trend directions. It determines the trends by considering many factors while calculating the trend. You can use this indicator as a trend indicator or in combination with other indicators that suit your strategy. You can also use it as a stand-alone trend filtering. Thanks to the alert feature, you can instantly learn about the new trends. To View Our Other Products Go to the link: Other Products

Detect divergence (classic, hidden) price and all oscillator indicator include: RSI, CCI, MACD, OSMA, Stochastic, Momentum, Awesome Oscillator (AO), Accelerator Oscillator (AC), Williams Percent Range (WPR), Relative Vigor Index (RVI), Rate of Change (ROC). Confirm reversal with dochian channel for to improve signal quality. Divergence is when the price of an asset is moving in the opposite direction of a technical indicator , such as an oscillator, or is moving contrary to other data. Diverge

This indicator is suitable for trading on the pair and many others. The indicator itself uses universal calculations of additional accuracy, but so far they are optimized for some currency pairs. Many settings can be configured on the main menu. He displays his calculations on the graph in the form of icons. There are two types of icons. In the tester, it works fine by default in the settings. You can specify a color for its icons. There is a panel. Happy trading.

"Scalper Channel MT5" is a modern channel indicator that shows the trader the direction of the trade. For work, the indicator uses built-in and proprietary technical means and a new secret formula. Load it on the chart and the indicator will show you the entry direction in color:
If the upper limit of the price channel of the indicator is blue, open a buy position. If the lower limit of the price channel of the indicator is red, open a sell position. If the border of the indicator is gray, ne

Correlation indicator is a trading indicator that compares price correlations on up to 8 different instruments simultaneously. This indicator is designed to be very versatile. It can be used to trade many different strategies from scalping to hedging to simple trend-following based on an average trend direction of multiple currency pairs or it can signal only when all the pairs correlate on the same side of a particular moving average. The indicator automatically applies the same moving average

OrderHelper script is super easy and trader friendly to use. It would boost your trading experience. Because it is designed to open one to multiple orders quickly with just one click. Besides using the OrderHelper script, traders can define various parameters for open orders such as the symbol, order type, lot size, stoploss, takeprofit and more. Basically, with this script traders can manage their open orders more efficiently and save their trading time. OrderHelper manages:
Open the number o
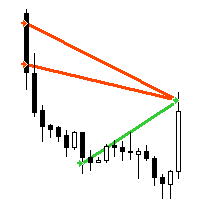
"AV Trade History MT5" is an indicator for MetaTrader 5, which similar to the "Trade History" or "Show trade history" setting, shows the closed trades on the chart. It also shows the orders history in the strategy tester, makes it easier to see them when testing expert advisors automated trading.
Improvements :
- Visibility is increased by line thickness and free choice of color.
- Additional information about the trade is visible when hovering over it, e.g. ticket, magic, comment, di

OPTMIZED BEFORE BACKTEST AND USE King Of Trends trades trends and was made on XAU/USD 1 hour charts. Try other assets and time frames if you can. There is no promise of untold wealth from $100 with 100% success rate , this is a bold lie many tell and believe . Not one EA here or anywhere does this, prove me wrong. In the end nothing is given in trading and you must put in work. Just try out and if it suits you and you want to use it then go ahead and run it on a demo and then a VPS and th

With the 2UP Risk & Trade Management EA you will be able to enjoy seeing your positions being fulfilled all you gotta do is take the position and have the right lot size and the 2UP EA will do the rest
- You can set your risk per position so your account never losses more than what is supposed to, it will close automatically once you reach a certain % of DrawDown. - You can set your reward as well based on %, how much do you wanna grow your account in % per trade ?, it will close automaticall
A professional tool for real-time monitoring of the account status and the work of Expert Advisors. Information about the account status can be sent to Telegram chats automatically at a specified interval or upon request.
From the screenshots of the open charts of the terminal, you receive upon request from your Telegram bot. Account information includes: 13:02 Trade monitoring by Telegram v.1.0 (headline) Account : 6802ххх RoboForex-Pro (account information)
Profit start: 2661 USD (profit ear
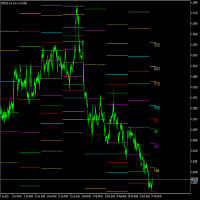
Fibonacci Pivots is a multi-timeframe indicator with custom alerts, designed to help traders easily identify key levels of support and resistance on any financial instrument. This advanced indicator uses the popular Fibonacci sequence to calculate pivot points based on the specified timeframe, depth, and backstep parameters. It also comes with customizable alerts. You can choose to be alerted when the price crosses any of the pivot points or when the price is within a specified frequency and pi
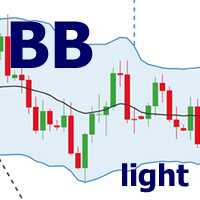
Basic description Expert Advisor with bollinger bands strategy in the whitebox model, configurable for multi-currency.
Available parameterization: Stop loss and take profit Timeframe Strategy description: The EA waits for the candlestick of the upper band to break to validate the entry of the operation, and thus carry out the buy operation. For the buy operation, the EA waits for the breakout of the lower band to validate the entry
The current version has output defined using a risk x retur

Phase accumulation adaptive bandpass filter MT5 Indicator is a Metatrader 5 (MT5) indicator and the essence of this technical indicator is to transform the accumulated history data. Phase accumulation adaptive bandpass filter MT5 Indicator provides for an opportunity to detect various peculiarities and patterns in price dynamics which are invisible to the naked eye. Based on this information, traders can assume further price movement and adjust their strategy accordingly.

The Intra Daily Range Projection indicator forecasts the current day’s price range on the basis of the previous day data. All calculations are based on the book “New Science of Technical Analysis” by Thomas R. DeMark.
When you're analyzing investments, the trading range is a valuable analytical tool. The average trading range is the average distance between the high and the low over a specified period of time. You can calculate the average high-low range on a piece of paper, a spreadsheet, o
MetaTrader 마켓은 거래로봇과 기술지표를 판매하기에 최적의 장소입니다.
오직 어플리케이션만 개발하면 됩니다. 수백만 명의 MetaTrader 사용자에게 제품을 제공하기 위해 마켓에 제품을 게시하는 방법에 대해 설명해 드리겠습니다.
트레이딩 기회를 놓치고 있어요:
- 무료 트레이딩 앱
- 복사용 8,000 이상의 시그널
- 금융 시장 개척을 위한 경제 뉴스
등록
로그인
계정이 없으시면, 가입하십시오
MQL5.com 웹사이트에 로그인을 하기 위해 쿠키를 허용하십시오.
브라우저에서 필요한 설정을 활성화하시지 않으면, 로그인할 수 없습니다.