MetaTrader 5용 유료 Expert Advisor 및 지표 - 36

Maximize Your Trading Potential with TurboRSI Pro Introducing TurboRSI Pro, your ultimate partner for navigating the financial markets. What is TurboRSI? TurboRSI is an expert advisor designed for traders looking for substantial profits. With its robust algorithms and a focus on harnessing the power of the Relative Strength Index (RSI), TurboRSI is your key to dominating the art of trading. How TurboRSI Pro Works Upon attachment to any chart, it usess the RSI indicator to identify optimal entry

In the fast-paced and ever-evolving world of stock trading, having a reliable compass is essential for navigating the complexities of the financial markets. Meet the Stock Trade Navigator, your trusted partner in the quest for investments. Unlock the Power of Data: Our Stock Trade Navigator is not just a tool; it's your data-driven co-pilot. Harnessing cutting-edge algorithms and real-time market data, it empowers you with a comprehensive view of the financial landscape, enabling you to make inf

This utility tool helps us to open trades and set orders very simply by just double-clicking on the chart. The volume of the positions and orders can be a constant lot size or determined based on a risk of equity. Take profit limit of the positions can be determined based on a Risk to Reward Ratio or simply by just a double-click.
For Positions: 1- At first, you need to double-click on the SL price. (For a buy position, you need to click on a price below the live price, and for a sell posit

Emilian: MetaTrader 5를 위한 전문 자문기 개요 이동 평균 지수(EMA)와 상대 강도 지수(RSI 21)를 사용하여 거래를 열고 닫는 Emilian 전문 자문기를 만나보세요.
맞춤형 위험 관리 전략을 제공하는 Emilian은 Average True Range (ATR 12) 또는 특정 pip 값들을 사용하여 이익 실현과 손절 레벨을 설정합니다.
주요 특징 이동 평균 크로스오버 전략: 크로스오버 신호를 위해 빠르고 느린 EMA를 활용합니다. RSI 21 확인: RSI 21을 통해 거짓 긍정을 줄이는 추가 확인 계층을 추가합니다. 유연한 포지셔닝: 완전히 거래 선호도에 맞게 조절 가능한 롱 및 숏 포지션을 허용합니다. 동적 위험 관리: ATR 기반 또는 pip 기반 이익 실현 및 손절 설정 사이에서 선택합니다. 입력 파라미터 LongPositions: 롱/구매 포지션을 열 수 있게 합니다. ShortPositions: 숏/판매 포지션을 열 수 있게 합니다. Lo
A formidable ally for historical testing with Fixed Perspective through ZigZag and Dow Theory, while also supporting ReviewCandleChart. A recommended tool for those troubled by 'lost perspectives.
Overview The 'RCCZigZagDow' indicator is a tool that assists in making judgments based on Dow Theory in relation to ZigZag waves. By using ZigZag waves as a basis to derive continuation points according to Dow Theory, it offers the advantage of ensuring that anyone can interpret trends in the same
This is a simple utility which will put automatic Stop Loss and Take Profit on all your open trades based on ATR indicator values. Whenever you open a trade, it will put ATR times Stop Loss and Take Profit automatically. Stop loss and take profit are two important tools used by traders to manage risk and set profit targets in financial markets. The Average True Range (ATR) indicator can be a valuable tool in helping traders determine appropriate levels for these orders. Here's an explanation of

This product is converted form Trading View of Kivanc Ozbilgic to be used on MT5 and below are descriptions of developer on Trading View:
Anıl Özekşi's latest development on his precious OTT - Optimized Trend Tracker:
In this version, there are two lines of OTT which are derived from HIGHEST price values (HOTT) and LOVEST price values (LOTT) which were originally sourced to CLOSE values on default OTT.
Another significant difference is there is no Support Line (Moving Average) in this ver

This EA is a simple automated trading system for the Meta Trader 5 platform. It uses parabolic SAR to automatically adjust lot size based on market trends. By this, the EA does not take a large amount of risk, but instead steadily accumulates profits.
Main Features The EA does not use the martingale method for lot size adjustment. If a position is taken before the forex market closes, the position will be carried over to the weekend. This EA is designed to hold multiple positions at the same

제우스 지표 소개: 귀하의 궁극적인 이윤 돌파 거래 도구. 이 지표는 폭발 전략과 심층 분석 필요성을 제거하여 거래를 단순화합니다. 귀하의 설정된 시간 프레임을 기반으로 자동으로 존을 그리고, 스탑 로스 (SL), 테이크 프로핏 (TP) 및 트레일링 스탑 수준을 제안합니다. 제우스 지표는 가격이 매수 또는 매도 진입점에 다가갈 때 즉각 알림을 제공하고 시그널 화살표를 표시합니다. 또한 네 가지 다른 테이크 프로핏 레벨과 다양한 트레일링 스탑 옵션을 권장합니다. 이 도구는 초보자와 숙련된 트레이더 모두에게 적합합니다. 채널 지원: [ 여기를 클릭 ](채널 지원 링크) 상점: 여기를 클릭하세요.
MT4 버전: [ 여기를 클릭 ](MT4 버전 링크) 권장 사항: 시간 프레임: M5 또는 M15 통화 쌍: 모든 통화 쌍과 호환 가능 계정 유형: 모든 계정 유형과 호환 가능 권장 스탑 로스: 제우스 지표에서 제공하는 SL 제안 사용 권장 테이크 프로핏 레벨: 제우스 지표에서 제

Introducing US30 Innovator , the exceptional MQL5 expert advisor that's transforming the way you trade the legendary US30 pair! Developed by an experienced funded elite trader with development experience of over 10 years. US30 Innovator EA stands out from other expert advisors due to its remarkable approach to handling losing trades. First in first out, so there is no stress over holding many trades at the same period. This unique strategy allows the EA to optimize its risk management, min
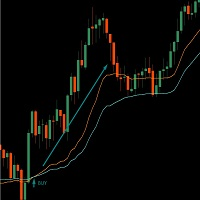
This indicator is built at the intersection of two VMA (Variable Moving Average, or VIDYA or Variable Index Dynamic Average) indicators. Flexible settings will allow you to more accurately find the entry point. The fast one crosses the slow one and this is a signal to buy or sell. Works on all instruments. Brief Description of the VMA Indicator: VMA (Variable Moving Average, also known as VIDYA or Variable Index Dynamic Average) is an exponential moving average that automatically adjusts the smo
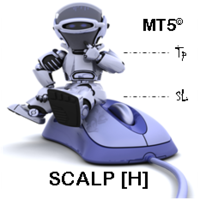
SCALP [H] is a panel-shaped robot designed to help the trader [scalper] trade on the Step Index, Step Index 200, Step Index 500, Multi Step 2 Index and Multi Step 4 Index assets [from Deriv.com broker]. From the dashboard, the trader can open new market orders and lock in the stop loss and take profit instantly. On the panel we have: the buttons to open new market orders; the buttons to select the points previously set in the inputs for stop loss and take profit and finally, the button for close

The Schaff Trend Cycle indicator is the product of combining Slow Stochastics and the moving average convergence/divergence (MACD). The MACD has a reputation as a trend indicator, but it's also notorious for lagging due to its slow responsive signal line. The improved signal line gives the STC its relevance as an early warning sign to detect currency trends. this indicator is converted from Trading View code of STC Indicator - A Better MACD [SHK]

The indicator has three main tools: Magnifier (Zoom chart), Ruler ( Time and Price scales ), and Crosshair. You can move it all around with your mouse and customize different formats for displaying , customize size and color of each element.
The Magnifier (zoom chart) allows you to display candles from any time frame and at different scales. Default hotkeys: 'Q' - higher timeframe, 'A' - lower timeframe, 'W' - decrease candle size, 'S' - increase candle size, 'Z' - show/hide zoom chart.
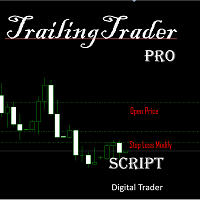
啟用TrailingTrader腳本後 報價視窗的交易品種 將會進行移動止損
設定參數 Symbol 設定需要移動止損的持倉品種 中間需要以","分隔 Magic 輸入需要移動止損的持倉單是別號 不需要識別時輸入-1 Comm 輸入 需要移動止損的持倉單是備註 不需要識別時不做任何輸入 TrailingDistance 啟動移動的點數 TrailingCallBack 移動止損的回調點數
工作原理 持倉單在獲利的條件下 市價超過設定的點數時 腳本自動設定止損線在市價回調的點數位置 當市價繼續往獲利的方向運行時 止損線會持續往運行方向調整 直到市價回調到止損線時獲利平倉 當同一品種持有多張持倉單時 移動止損會分開運行 當盈利超過一定的範圍時 移動止損線會形成同步狀況
特點 當交易員習慣手動開單 又無法長時間盯盤時 可以啟用移動止損 當持倉單一旦觸發工作 就可以確認該單會在獲利的條件下出場 可以跟EA交穿插使用 根據EA設定的Magic或Command做介入式管理
起用條件 需要使用MT5交易的電腦全天候開機運行 可以啟用腳本後 再同步到官方VPS 此時同步的腳本可以全天

Hello community, I present to you the new EA called Crash300 Sniper Boss It is used only in the Crash300 pair From the broker (Deriv) has the strategy, of a stochastic together with 2 emas of 100 and 7 periods It is used in a time frame of 5 Minutes and is used with the lot 0.50 / 1.00 according to the account balance It is recommended to start with a balance of 300 USD The recommended Stop loss and take profit is modified TP 300 SL 30000 The rest is left as it comes, It is used in time from 5 M

Volume Profile is a very useful indicator . it allows you to spot the price levels where important price action took place. It is similar to support and resistance levels but with a different logic. ( Check Out Fixed Range Volume Profile MT5 )
One of the first thing that traders mark up when analyzing a chart is support and resistance. Volume Profile can be used for doing that too.
The indicator scans the defined number of previous bars and calculates the volume of activity at each price

The VIX Fix is a volatility indicator developed by renowned trader Larry Williams. It's designed to measure volatility in assets that don't have options or futures, such as individual stocks and forex markets. Essentially, it acts as a synthetic VIX (Volatility Index) for any asset , providing a gauge of market uncertainty. This modified version of William's indicator helps you to find market bottoms and market tops. It comes with 2 styles: Stochastic and histogram style. Please see screenshots
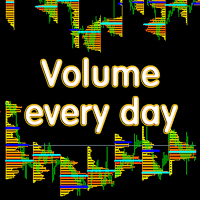
Основные отличия и преимущества индикатора Volume every day от похожего продукта Volume Profile V6 В Volume every day можно параметром Range period задать временной диапазон построения профиля, а параметром Range count задать количество профилей данных диапазонов. Например, на втором скрине Range period=1Day, а Range count=10 - это значит, что профиль будет строиться на периоде один день, десять последних дней. Важно, что переключение тайм фрейма графика не влияет на построение профиля, что т

Important Note: Trend Starter Indicator (TSI) detailed settings manual, trading strategies (coming soon) and setfiles (coming soon) are available in this LINK The Trend Starter Indicator (TSI) provides traders with precise and actionable signals for potential market entry points. By capitalizing on the unique interplay of two internal oscillators combined with astute price action monitoring, TSI optimizes and simplifies the decision-making process in the dynamic world of trading. But that'

This Automatic support/resistance indicator calculates various peaks and troughs of the price action, identifies relevant levels and draws support and resistance automatically. It uses the built-in "ZigZag" indicator in Metatrader as a data source hence, very much accurate indicator. The support and resistance lines are contineusely updated as new levels and formed. The indicator has only 5 parameters to set, and mostly it can be used with the default values: The description of the settings is

Pivot Point Super Trend is another type of famous super trend indicator which is equipped with pivot points in different way. this indicator used to be available in the Trading view and this is converted from there to the MT5 language. MT4 version of the indicator is also available and you can find in my products. there are also buy/sell signals shown on the screen.

ATR Stops is an indicator which shows Dynamic support and resistance lines by considering ATR value and also a multiplier. its highly effective to find out the trend direction and also is useful for using as stop loss levels. it could be used in different ways one usual way is to buy when line becomes green and sell when it becomes red. when its combined with money management rules and risk reward considerations there is good results.
The easy ea builder enables you to build expert advisors/robots without writing a singe line of code. It can be used by anyone. you can combine as many indicators as you want and you can also customize their settings to suit your needs. You can choose to use the robot only for alerts and notifications or for auto-trading .The tutorial video explains every thing in detail. You own all the rights to the robot you create as it comes with its source code separate from the ea builder. All the robots

Unlock the power of precise trend analysis and supercharge your trading strategy with Momentum Trend on MT5! Our cutting-edge trading tool is designed to provide traders with the essential insights and data needed to navigate the dynamic world of financial markets. Key Features: Accurate Trend Analysis : Momentum Trend utilizes advanced algorithms to accurately identify market trends, helping you stay ahead of the curve and make informed trading decisions. Real-Time Data : Stay updated with real
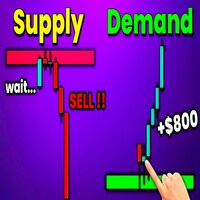
Best Solution for any Newbie or Expert Trader! This indicator is a unique, high quality and affordable trading tool because we have incorporated a number of proprietary features and a new formula. With this update, you will be able to show double timeframe zones. You will not only be able to show a higher TF but to show both, the chart TF, PLUS the higher TF: SHOWING NESTED ZONES. All Supply Demand traders will love it. :)
Trade Many Indicators is a tool that enables you combine and use 30 plus indicators at the same time without the confusion or cluttering up your chat . You receive a bullish signal when most of the indicators you turned ON indicate bullish and you receive a bearish signal when most or the indicators you turned ON give a bearish signal. All the indicators are customizable to your own needs.
It also includes a tool to automatically calculate your lot-size and open positions depending on how you p

This is the Full Version, to get the free version please contact me. The free version works on “USDJPY” charts. All symbols and time frames scanner. Contact me after payment to send you the User-Manual PDF File. OVER and UNDER
Over & Under pattern is an advanced price action trading concept in the trading industry. The Over & Under pattern is more than a confluence pattern or entry technique than a trading strategy. It is a reversal pattern that is created after a significant obvious trend. I

After every 10 sales, the price is increased by $50 and the robot will ultimately cost $1,000
Introducing our newest robot built on a brand new strategy learned in neural network strategy. The robot makes trading decisions based on indicators built into the robot's strategies and price action. Our machine uses the latest technologies and adapts to the market in real time to obtain the best possible results. Together with our team of programmers, we have created a product of the highest quali

Basic Gold Predictor is a sophisticated Expert Advisor meticulously crafted for traders and investors with a keen interest in the precious metal, gold. This advanced algorithm combines the power of multi-timeframe analysis and fundamental technical analysis to provide accurate and timely predictions for gold price movements.
Key Features: Multi-Timeframe Analysis: Basic Gold Predictor leverages multiple timeframes, from short-term intraday charts to longer-term daily charts. By considering var
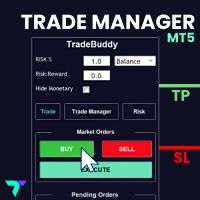
This adds an easy to use trading panel to your MetaTrader5 chart, enabling you to enter the market at lightning speed with your risk automatically calculated. Plus, it will help you automate your trade management with automatic & one click partial profits, stop loss to breakeven and more. Click here for the full Trade Buddy user guide If you want to test Trade Buddy before you purchase, please message us by visiting our profile and we will provide you with a 7 day free trial. Best of all, it’s c
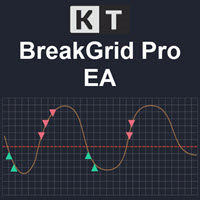
Unleash the power of precision and innovation in your trading with the KT BreakGrid Pro EA. Seamlessly blending the strategic prowess of breakout and grid trading, this expert advisor is your ultimate solution to navigating the complex Forex landscape with unmatched confidence and efficiency.
Recommendations
Symbol: EURUSD TimeFrame: M5 Account Type: Hedge Leverage: 1:500 Set Files: Not required. Default inputs provides best results.
Features Breakout-Infused Grid Strategy: Experience th

Introducing Auto Trendline Pro : Your Ultimate Trading Companion Are you tired of manually drawing trendlines on your forex charts? Do you wish for a tool that can simplify your trading while providing timely alerts? Look no further, because Auto Trendline Pro is here to revolutionize your trading experience. In the fast-paced world of forex trading, staying ahead of the curve is essential. Identifying trends, both upward and downward, can be a game-changer. This is where Auto Trendline Pro ste

The KT Trades Info indicator is useful for traders wishing to stay informed about their trading performance. This indicator provides real-time updates on the profitability of all ongoing and completed trades, enabling traders to make well-informed decisions. By incorporating key financial metrics, it provides a comprehensive picture of a trader's financial status at a glance. This means traders can monitor their performance with increased accuracy and precision, facilitating better risk manageme

- This is the exact conversion from TradingView: "Support/Resistance" By "BarsStallone". - This indicator lets you read the buffers for R/S values. - This is a non-repaint and light processing load indicator. - This is not a multi time frame indicator If you want the multi time frame version you should create a personal order and I deliver two files that you need them both to have the multi time frame indicator running on your system. - The MT4 version of the indicator is not light load from pr

Note: minimum investment 1000 usd or (100 usd is Account Cent (10000 Cent)) Run At 0.01 lot start. Trading with an Expert Advisor (EA) on the M1 timeframe (1-minute chart) can be quite challenging due to the rapid price movements and increased noise in such short timeframes. However, it's not impossible, and some traders do use EAs on the M1 chart for specific strategies. Here are some considerations for trading with an EA on the M1 timeframe: 1. Strategy Selection: Choose a trading strategy
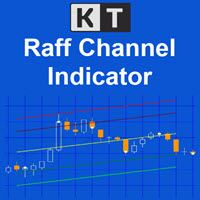
The KT Raff Channel is an enhanced and refined iteration of the original Raff channel concept pioneered by Gilbert Raff in 1996. This indicator builds upon Raff's initial work, incorporating modifications and advancements to provide traders with a more sophisticated and powerful tool. Gilbert Raff, a renowned name in the field of financial market analysis, is the developer of the Raff Regression Channel. This technical tool is designed for discerning and validating possible market price trends.

This is the Full Version, to get the free version please contact me.
The free version works on “AUDNZD” and “XAUUSD” charts.
All symbols and time frames scanner
Head and Shoulder
One of the most popular Price Action patterns is the Head and Shoulders pattern. The pattern has three local tops that resemble the left shoulder, head, and right shoulder. The head and shoulders chart pattern appears in all kinds of markets, including Forex, cryptocurrency, commodities, stocks, and bonds. The

"Triple Performance" Trading Strategy Harness the market's full potential with this dynamic strategy! Key Indicators: MACD (Moving Average Convergence Divergence): Identifies trend reversals. RSI (Relative Strength Index): Signals market conditions. CCI (Commodity Channel Index): Measures market strength. Main Benefits: Maximize profits by utilizing clear signals. Automatic position control with MACD. Easy customization with configurable RSI and CCI levels.
Works perfectly with EUR/
KT Momentum Histogram provides traders with a visualization of the momentum of a particular asset, which helps determine the strength and potential direction of a market trend. The indicator calculates and operates based on momentum in trading.
What Exactly is a Momentum Histogram
Momentum is the rate of acceleration of an asset's price or volume. In other words, it measures the speed at which the price of an asset is moving in a particular direction over a specific period of time. Positive

The indicator determines signals on a system of two components:
- correct fractals. The indicator that comes with MT4 and MT5 is quite crude, since some levels are calculated incorrectly. This indicator shows signals for the breakdown of strong levels. - wave level for fractals. Not to be confused with zigzag.
It is better to use on higher timeframes (M15 and higher), where the indicator perfectly shows entry points and reversal situations.
Of course, you can use standard indicators from

The KT Buy Sell Volume is a powerful tool traders use to gauge the strength and weakness of price movements. In the whirlwind of the Forex market, traders aim to identify and ride the waves of a bullish or bearish trend that exudes strength and potential. However, recognizing these trends necessitates a method, metric, or indicator to quantify their strength. One crucial factor that traders examine for this purpose is volume. Volume refers to the number of shares or contracts traded in a securit

Infinity Indicator MT5 1.0 Panel Asset Rate % EURUSD 96.0% GBPUSD 94.1% AUDCAD 90.5% USDCHF 87.8% BTCUSD 78.4% Panel Win Rate based on CandleMT4 Exit Button Calculates the StdDev standard deviation indicator on the RSI data, stored in the matrix similar to the keltner. input int HourCalculate = 12; RsiLength = 5; RsiPrice = PRICE_CLOSE; HalfLength = 4; DevPeriod = 100; Deviations = 0.9; UseAlert = true; DrawArrows = true; TimerWork=300; LevelUp = 80; LevelDown = 20; MoreS

Hello Traders..
Tried deals without stop-lose? :)
=-=-=-=-=--- Grid EA Robot { Simple Moving Average } crossover 4sma & 11sma Strategy ---=-=-=-=-=
BY below pics you will know what strategy doing by automatic open and close Trades.
[ BUY ]
4.sma crossover 11.sma
https://ibb.co/0XZFBf2
[ SELL ]
11.sma crossunder 4.sma
https://ibb.co/VpqsLmD
[ backtest ] - XAUUSD - settings below. Note: don't change these settings for ( xauusd pair ) -TF 1 hour
https:/

This indicator is used to find support and resistance lines
The support and pressure of different time periods can be found in the same icon cycle, and two time periods are provided here
Parameter Description:
---------------------- Main ---------------------
Timeframe //Used to select the main time period (recommended as the default PERIOD_D1);
Retracement interval //This value is the root number of backtracking k-lines (recommended to be 20 by default);

The Ultimate Forex Expert Advisor
A beast designed to conquer Automated Trading with Ease. This isn't just another Expert Advisor; it's a true powerhouse designed to revolutionize your trading experience. After 14 years of relentless testing, refining, and unwavering dedication, I am proud to present an Expert Advisor that has earned its well-deserved name and price.
Here's why it stands out from the rest: Unparalleled Flexibility:
FX-Legend works seamlessly across all currency pairs, e
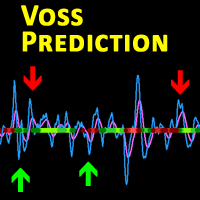
Description This is a modified version of the popular Voss Predictive Filter - A peek into the future by Dr. John Ehlers. It contains 2 lines - V-Line (blue) and F-Line (red), a trend indication and BUY/SELL signals.
Usage Buy Green dots indicate an up trend. Open a BUY position if the V-Line crosses the F-Line from below and an up trend is signaled (green dots) Close BUY position if V-Lines falls beneath F-Line again Sell Red dots indicate a down trend Open a sell position if V-Line falls

Heracles Indicator를 소개합니다. 이 지표를 사용하면 분석이 필요하지 않고 쉽게 거래할 수 있습니다. 자동으로 누적 구역, 진입 지점 및 명확한 이익 실현 수준을 식별합니다.
Heracles Indicator는 가격이 매수 또는 매도 진입 지점에 도달하면 알림을 표시하고 신호 화살표를 표시하며 이익 실현을 위한 세 가지 수준을 제안합니다.
초보자 및 전문 트레이더 모두에게 적합합니다.
채널 지원: 여기를 클릭하세요 MT4 버전: 여기를 클릭하세요
권장 사항:
시간 프레임: M5 및 M15 통화 쌍: 모든 통화 쌍 계정 유형: 매우 낮은 스프레드를 가진 ECN, Raw 또는 Razor 권장 스톱 로스: 50 픽스 또는 High/Low 지역 권장 이익 실현 수준: 25 픽스, 50 픽스 및 75 픽스
사양:
1/ 자동으로 누적 구역을 그립니다. 2/ 자동으로 매수/매도 진입 지점을 제안합니다. 3/ 높은 정확도로 세 가지 이익 실현 수준을
This EA will automatically close all open order when profit or loss is reached according to users setting. You need to select close by percentage or close by amount. If close by percentage or close by amount is set to true the EA will exit. When the setting is set to true, the value of profit and loss can not be 0. Please set to true the option for Close Order with Same Symbol or Close All Order.
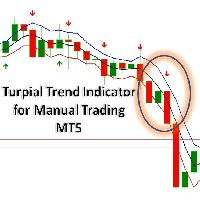
Turpial Trend Indicator for Manual Trading. Indicator (arrow) for all Symbols and Periodicity. This indicator considers a pullback strategy and a trend strategy. The strategy that is based on criteria for the Rsi, Atr and Macd indicators. The channel band corresponds to the maximum and minimum average values of three bars (Bill Williams 3-bar strategy). BUY when there is a Green Arrow. It is advisable to place the StopLoss below the bottom line of the channel. SELL when there is a Red Arrow. I

폭락률 닥터 - 시장 리듬을 마스터하는 전문가 어드바이저!
정밀 거래의 힘을 해제할 준비가 되셨나요? 폭락률 닥터를 만나보세요. 외환 시장의 다이내믹한 세계에서 신뢰할 수 있는 동반자입니다. 이 멀티-통화 전문가 어드바이저는 그저 거래 도구가 아닙니다. 시장 투자를 탁월하게 안내하는 심포니 지휘자입니다.
주요 기능을 알아보세요:
1. 트렌드 추적 전문성: 폭락률 닥터는 견고한 시장 트렌드를 발견하기 위해 검증된 방법을 사용합니다. 단순한 추측을 버리고 정보를 기반으로 한 결정을 내릴 수 있습니다.
2. 완전한 통제: 내장된 자금 관리 도구를 활용하여 거래 전략을 직접 조정하세요. 언제든지 열 포지션의 수와 거래 크기를 어떻게 증폭할지를 결정할 수 있습니다. 이것은 여러분만의 전략서, 여러분만의 방식입니다.
3. 폭락률 마에스트로: 이름에서 알 수 있듯이 이 EA는 시장 폭락률을 측정하고 모방하는 데 중점을 둡니다. 물이 그릇의 모양을 취하는 것처럼 시장 조건에 맞

O SupRes Master é ferramenta essencial para traders, fornecendo alertas instantâneos sempre que o preço de um ativo fecha acima de uma resistência crucial ou abaixo de um suporte vital.
Além disso, ele simplifica a análise técnica ao destacar esses níveis críticos no gráfico, usando cores distintas para identificar níveis de suporte em azul e níveis de resistência em vermelho.
Essa abordagem visual torna mais fácil para os traders identificarem oportunidades de entrada ou saída, melhorando s

In the ever-evolving world of Forex trading, understanding the different trading sessions is paramount to making informed trading decisions. Each trading session brings its own unique characteristics, opportunities, and challenges, and recognizing these can greatly enhance your trading strategies. Whether you're a novice or a seasoned trader, the Forex market's three main trading sessions – Asian, London, and New York – are crucial milestones that dictate market behavior and potential trade set
차트 범위(Chart Range)는 종가를 기준으로 지지선과 저항선을 분석하는 전문가 자문입니다.
Expert Advisor는 2012년부터 2022년까지 각 실제 틱에 대해 백테스트를 거쳤으며, 각 교차에 대한 예금은 10.000$(센트 계정의 100$)입니다.
통화 세트에 대해서는 댓글을 확인하세요.
라이브 신호 : https://www.mql5.com/en/signals/2058817
권장사항:
통화쌍: GBPUSD,AUDNZD,AUDCAD,EURGBP,AUDUSD,NZDCAD 기간: H4
Chart Range is an Expert Advisor that works on Support and Resistance based on closing prices . Expert Advisor was backtested from 2012 to 2022 on each real tick, with deposit for each cross of 10.000$
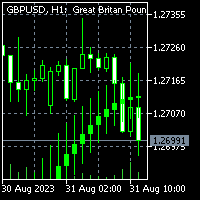
To get access to MT4 version please click here . This is the exact conversion from TradingView: "Smoothed Heiken Ashi Candles v1" by " jackvmk ". This is a light-load processing and non-repaint indicator. All input options are available. Buffers are available for processing in EAs. You can message in private chat for further changes you need. This is not a multi time frame version.

The SuperTrend AI indicator is a novel take on bridging the gap between the K-means clustering machine learning method & technical indicators. In this case, we apply K-Means clustering to the famous SuperTrend indicator. USAGE Users can interpret the SuperTrend AI trailing stop similarly to the regular SuperTrend indicator. Using higher minimum/maximum factors will return longer-term signals. (image 1) The displayed performance metrics displayed on each signal allow for a deeper interpretat
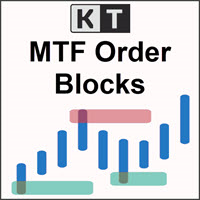
The KT MTF Order Blocks automatically plots the institutional order blocks by using a unique blend of price action with comprehensive multi-timeframe analysis. This advanced approach reveals the area of price reversal, originating from significant buy and sell orders strategically placed by major market players.
Features
Algorithmic Precision: A refined and distinctive order block algorithm meticulously crafted to precisely identify the most pivotal order blocks, often triggering price reve
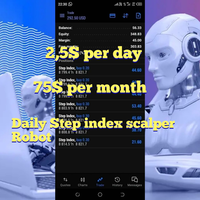
https://youtu.be/WoCdfvmJmhw?si=Nekf90qeuS5lXBko Si vous etes a la recherche d ' un robot capable de vous généré des profits par jour alors vous etes tomber sur le bon robot
Ce robot a pour objectif de vous générer 2.5 $ par jours sur un actif spécifique step index et 75$ par mois
le dépot requis pour trader Step Index est = 1000$ minimum
Actifs a trader: Step Index Que vous pouvez avoir chez mon broker https://track.deriv.com/_uLzSi0hVVMZBMfcXPt5VjGNd7ZgqdRLk/1/ parmis les indic
VOLATILATY 10 Vixy 10 ,I s a automatic robot that has the level of professional decision when to take a trade without any emotion. The bot will help in your scalping decision making with its own TP (take profit). This is a down trend based scalping ,looking on whats happening in real time charts no repainting of any signals. The robot helps in making decisions on the candle stick pattern opened and closed lat price with the help of RSI ,MA and Ichimoku cross for support and confirmation to take

BOOM 500 CYPHER
!! LIMITED TIME OFFER !!
This is the ideal EA to trade on Boom 500 market by Deriv. The EA has been developed to trade in a up trading market. No sell positions will be traded as the market is a uptrend market that gives big upwards spikes. It is very important to make sure the chart is on 1 minute timeframe Allot of time and effort went into the EA with extensive testing and adjusting to get it to just the right spot. EA makes use of different timeframes to determine the

Always backtest before using.
MintyGrid is a simple EA that has an RSI indicator. On winning trades MintyGrid will take profit based on configuration. On losing trades MintyGrid uses a grid strategy to place resistance points using a martingale/reverse-martingale strategy to be prepared for when the market swings in the opposite direction. MintyGrid can be configured to run on many currency pairs simultaneously and will work as long as the pairs are similar in price. MintyGrid always trades w

Introducing the uGenesys Psychological Levels Indicator – Your Key to Precision Trading with Real-Time Alerts! Are you tired of guessing where the market might turn? Do you want a tool that can accurately identify psychological levels and notify you when price touches a key level? Look no further – the uGenesys Psychological Levels Indicator is here to revolutionize your trading experience. Imagine having a tool that not only identifies psychological levels with unmatched accuracy but also aler

Safety Control: Your Ultimate Balance Management Solution for Prop Firm Challenges Overview Tired of manually monitoring your trading activities in prop trading challenges? Meet Safety Control, an advanced Expert Advisor for MetaTrader 5 that will change the way you trade forever. This proprietary software aims to help you manage your balance effortlessly during prop firm challenges. Features Automated Drawdown Control : Safety Control continuously monitors your account's balance and equity in r

CRASH500 CYPHER
!! LIMITED TIME OFFER !!
This is the ideal EA to trade on Crash500 market by Deriv. The EA has been developed to trade in a downtrading market. No buy positions will be traded as the market is a downtrend market that gives big downward spikes. It is very important to make sure the chart is on 1 minute timeframe Allot of time and effort went into the EA with extensive testing and adjusting to get it to just the right spot. EA makes use of different timeframes to determine the

Take control of your operations efficiently at trading, mannaging by an smart way the risk of your positions. Whit this tools, you can:
Estimate the potencial profits or losses from your operations, either in money or pips. You also can visualize profits or losses by substracting the spread cost previusly configured in the tool’s input parameters. Calculate the lot size or margin required for your orders. Estimate the risk/reward ratios of your positions. Study the negative impact of the sprea

Contact On Whatsapp to get 50% off +639128730715
MT4 Version Here : https://www.mql5.com/en/market/product/104491 Signal : https://www.mql5.com/en/signals/2058574
This EA is exclusive for those using the affiliate broker links or IB's. This Is the TREND today Get it so that you can manage to give youre clients a good profits while you are making money on commissions. This EA is very simple to use just attached the EA to chart and load the setfiles and its done.
Message me directly if yo

По стратегии "Торговый Хаос" ( Билл Уильямс) .
Индикатор, окрашивает бары в цвета awesome oscillator,
а также, окрашивает бар в синий цвет, при возникновении *приседающего* бара MFI. Красный бар - бар находится в отрицательной зоне. Зеленый бар - бар находится в положительной зоне. Индикатор является составной частью торговой системы. Не забудьте установить на график т акие индикаторы, как индикатор Аллигатора, Осциллятор Awesome, индикатор Фракталов.

Presenting breakout strategy indicator, influenced by the insightful Smart Money Concept. This sophisticated tool aims to assist traders in spotting potential trading opportunities characterized by breakouts in the market. The foundation of the Smart Money Concept lies in the actions of seasoned investors and astute market participants. It's important to clarify that this indicator does not guarantee profits; rather, it's designed to empower traders with valuable insights into
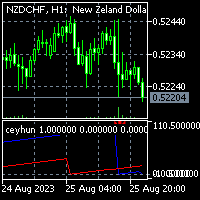
To get access to MT4 version please click here . This is the exact conversion from TradingView: "Top Bottom Indicator" by "ceyhun". This is a light-load processing and non-repaint indicator. All input options are available. This is not a multi time frame indicator. Buffers are available for processing in EAs. Extra option to show buy and sell signal alerts. You can message in private chat for further changes you need.
Introducing the True Range MACD Indicator – Your Ultimate Trading Companion! Tired of missing out on profitable trading opportunities? Wish you could predict buy and sell signals ahead of time? Look no further! The True Range MACD Indicator is here to revolutionize your trading game and take your success to new heights. Unleash the Power of True Range Convergence and Divergence Unlike the conventional MACD you find in MT5, the True Range MACD goes above and beyond by analyzing true rang
MetaTrader 마켓은 거래 로봇과 기술 지표들의 독특한 스토어입니다.
MQL5.community 사용자 메모를 읽어보셔서 트레이더들에게 제공하는 고유한 서비스(거래 시그널 복사, 프리랜서가 개발한 맞춤형 애플리케이션, 결제 시스템 및 MQL5 클라우드 네트워크를 통한 자동 결제)에 대해 자세히 알아보십시오.
트레이딩 기회를 놓치고 있어요:
- 무료 트레이딩 앱
- 복사용 8,000 이상의 시그널
- 금융 시장 개척을 위한 경제 뉴스
등록
로그인
계정이 없으시면, 가입하십시오
MQL5.com 웹사이트에 로그인을 하기 위해 쿠키를 허용하십시오.
브라우저에서 필요한 설정을 활성화하시지 않으면, 로그인할 수 없습니다.