MetaTrader 5용 유료 Expert Advisor 및 지표 - 20

The Expert Advisor will help you forward all alert from MetaTrader 5 to Telegram channel/ group. All alert must save to folder <Data folder>MQL5\Files\Alerts\ , text file with format *.txt and screenshot with format *.gif or *.png.
Parameters: - Telegram Bot Token: - create bot on Telegram and get token. - Telegram Chat ID: - input your Telegram user ID, group / channel ID - Forward Alert: - default true, to forward alert. - Send message as caption of Screenshot: - default false, set true

Welcome to SMC Structure Shift EA for MT5 This automatic trading system works on a simple but efficient smart money concept, which consists in identifying the current market structure and a bias, finding the last high and low and open a position on the continuation of the trend.
No martingale or grid systems are used with this EA.
Only pending orders are placed depending on an identified Bias.
There is always only one trade open at a time, which makes this strategy safer.
Each position

Tax Buddy creates a simple, sortable trading report which you can send to your local tax authorities alongside your annual declaration. I've been using this kind of report for the German Finanzamt in order to declare my capital gains ("Kapitalerträge") in a readily comprehensible manner. For testing purposes, the Demo version places random trades in the Strategy Tester on the symbol of your choice and creates a demo report for them.
Conveniently, all reports are stored in the common path for a

RISK TO REWARD TOOL for MT5 with UI on chart: (creates similar RR boxes like on tradingview) -creates and deletes draggable boxes on chart, ANY SYMBOL, ANY TF. Menu buttons:
NEW BUY, NEW SELL, DELETE ALL, ( and minimize) -draggable target TP level
-draggable SL limit level
-text labels with pips SL TP, RR ratio-there is no limit of boxes
-but program remembers first 100 boxes after changing input. there is parameter "delete_on_init" so false = every created box stays as it is,

*This is trading view indicator converted in mql5*
The HA Market Bias Indicator is a popular tool used in trading and technical analysis, designed to help traders identify market bias and potential trend reversals. It is commonly used in conjunction with candlestick charts and provides valuable insights into market sentiment. The indicator is based on the Heiken Ashi (HA) candlestick charting technique, which aims to filter out market noise and provide a smoother representation of price actio

MACD (short for M oving A verage C onvergence/ D ivergence) is a popular trading indicator used in technical analysis of securities prices. It is designed to identify changes in the strength, direction, momentum, and duration of a trend in a security's price.
History Gerald Appel created the MACD line in the late 1970s. Thomas Aspray added the histogram feature to Appel's MACD in 1986.
The three major components and their formula 1. The MACD line: First, "PM Colored MACD" employs two
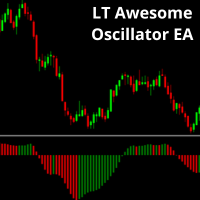
Are you ready to take your trading to the next level? Our Awesome Oscillator Expert Advisor is here to help you make more informed and profitable trading decisions. Packed with four unique trading strategies, advanced features, and customizable filters, this EA is the ultimate tool for both novice and experienced traders. Key Features : Four Proven Trading Strategies : Our EA offers four distinct trading strategies based on the Awesome Oscillator indicator. Whether you prefer trend-following, re
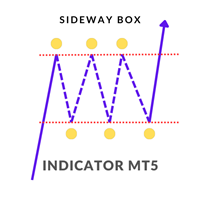
Sideway Box Indicator
The Sideway Box Indicator is an advanced trading tool designed to help traders identify and capitalize on sideways market conditions. This powerful indicator detects periods when the market is in a sideways (ranging) phase, providing traders with clear visual cues. Key Features
Sideways Market Detection : The Sideway Box Indicator accurately identifies sideways market conditions, allowing traders to recognize when the price is consolidating within a specific range. Buy/S

What you can do with CandleStick CandleStick is a useful indicator for doing MTF analysis. This indicator displays the CandleStick of another time frame on the chart . By understanding the information in multiple time charts at the same time, it is easier to understand the overall market view. It is also a useful tool for validating and studying past quotes and trades. There are similar products made by others, but I designed and developed it so that it is easy for me to use.
Features of Candl
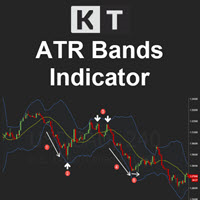
KT ATR Bands draws the volatility envelops and bands using a combination of Average True Range and Moving average. They are typically used to identify the potential reversal points and the periods of high and low volatility.
Features
Multi-Timeframe Ability: For example, you can have the atr bands from the daily timeframe on the H1 timeframe. Smart Alerts: You can turn on/off alerts for each band separately. Also, you can choose a minimum time interval between each alert to stop unnecessary,

I am placing the indicator obtained as a result of market analysis, it may be useful to someone. The indicator shows how quickly the price changes (where there is a trend), and where there is no obvious trend. With the right settings, you can know the beginning of the trend in advance.
The indicator measures the slope / rate of change / ratio of the moving average on the current bar relative to the previous bar.
The settings specify the ratio limit for a downtrend and a ratio limit for an u

Triangular Arbitrage Expert Advisor Maximize your trading potential with our advanced Triangular Arbitrage EA for MetaTrader 5. Designed for precision and efficiency, this EA identifies and exploits triangular arbitrage opportunities in the Forex market. Key features include: Automated Trading : Seamlessly opens and manages triangular arbitrage positions. Robust Algorithm : Efficiently scans for profitable opportunities, ensuring optimal trade execution. User-Friendly Settings : Easily customiza

This is an advanced multi-timeframe version of the popular Hull Moving Average (HMA) Features Two lines of the Hull indicator of different timeframes on the same chart. The HMA line of the higher timeframe defines the trend, and the HMA line of the current timeframe defines the short-term price movements. A graphical panel with HMA indicator data from all timeframes at the same time . If the HMA switched its direction on any timeframe, the panel displays a question or exclamation mark with a tex
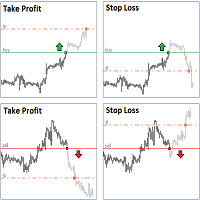
StopLoss and TakeProfit Utility MT5 for automatic setting of stop loss and take profit levels. Created by a professional trader for traders. The utility works with any market orders opened by a trader manually or using advisors. Can filter trades by magic number. The utility can work with any number of orders simultaneously.
WHAT THE UTILITY CAN DO: Set virtual stop loss and take profit from 1 pip Real stop loss and take profit W ork with each order separately ( stop loss and take pr

Gold Master EA is an Expert Advisor (EA) purposefully designed for trading the most sought-after precious metal, gold. It stands out by avoiding risky trading strategies such as martingales, grid strategies, or hedging. Instead, it relies on simple and effective strategies, eliminating unnecessary complications. Gold Master EA is not designed to promise impressive gains overnight. On the contrary, it targets traders seeking low drawdown and long-term profit stability. This cautious approach favo

Introducing the Order Block Indicator , the pinnacle of trading technology. Order blocks, the large cluster of buy or sell orders placed by institutional traders, significantly influence market direction. They form at critical price levels and can act as robust support and resistance zones. Our cutting-edge indicator allows you to harness the full potential of these influential market dynamics, providing a never-before-seen level of precision and customization. Here's why this tool stands apart:

Addition to the standard Relative Strength Index (RSI) indicator, which allows to configure various notifications about the events related with the indicator. For those who don't know what this indicator is useful for, read here . This version is for MetaTrader 5, MetaTrader 4 version - here . Currently implemented events: Crossing from top to bottom - of the upper signal level (default - 70) - sell signal. Crossing from bottom to top - of the upper signal level (default - 70) - sell signal. Cro

Indicator introduction: A channel and trend line indicator, which is a good tool for manual trading, and also can be used for creating new EAs, without drifting or repainting. It applies to any timeframes and any symbols. The work of the indicator is shown in the screenshots. For any novice and programming trading friend, you can write the signal into the EA to play freely, buffer 0 corresponds to the bold trend line, buffer 4 and 5 respectively corresponds to the channel's upper and lower f
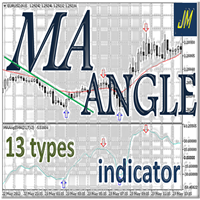
"MA Angle 13 types" is an indicator that informs of the inclination angle of the moving average curve that is displayed on the screen. It allows selecting the MA method to use. You can also select the period, the price and the number of bars the angle is calculated for. In addition, "factorVisual" parameter adjusts the information about the MA curve angle displayed on this screen. The angle is calculated from your tangent (price change per minute). You can select up to 13 types of MA, 9 standa
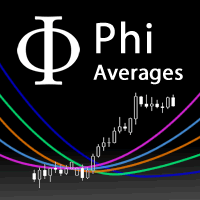
A fan of special weighted moving averages, able to predict tendency reversal and give references about price movements during consolidation and drawbacks. This special moving average is based on Phi fractals and is not available on others indicators. Reproduce this method with another kind of average will not have the same results. The fan has the following averages: 17: Purple 34: Blue 72: Orange 144: Green Blue 305: Dark Blue 610: Grey How to use the fan to analyze price behaviour: If the pric

Enhance Your Trading with Buraq Bars Indicator! Take your trading to the next level with Buraq Bars ! This easy-to-use indicator draws bars on your chart whenever the RSI (Relative Strength Index) crosses above or below the levels you choose, giving you clear signals to help you trade better. Key Features: Set Your Own RSI Levels: Choose the levels for overbought and oversold that work best for you. Clear Visual Signals: Bars appear on your chart when the RSI crosses your levels, making it easy

KT Know Sure thing is a momentum oscillator based on the smoothed rate of change over four different timescales and was developed by Martin Pring. In 1992, Pring published the initial description of the indicator in Stocks & Commodities magazine's "Summed Rate of Change (KST)" article. KST creates a momentum oscillator by combining the price momentum measurements from four different price cycles. Traders can utilize KST to search for bullish or bearish divergences, signal line crossovers, and ce

This utilities can constantly monitors and handle the equity/ balance account to prevent drawdowns and protect your account. This Utilities can handle manually order and automatically order by other Expert Advisors. If the conditions are reached, the open position will be close/ all close (depending your setting).
How to use :
attach this utilities on new chart (same pair) you need to handle make sure magic number is same with other EA you need to handle entry magic number '0' if you need h
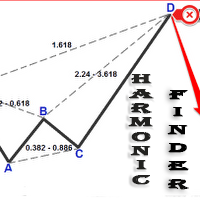
Automatically finding harmonic patterns has been made easy for traders. For those who do not know harmonic patterns : it is a method of technical analysis based on Fibonacci ratios in the markets and patterns made of these. Kind of like patterns such as triangles and double tops, but with precise measurements which makes computerized measuring tools especially appealing for trading these patterns. Some highlights from this Indicator include: Efforts to reduce the amount of screen clutter thro

An indicator to draw a graph of account current and historical state such as Balance, Equity, Margin, Free Margin, Margin Level, Drawdown, Account Profit, Deposit and Withdrawals.
Indicator Inputs : Draw Balance Graph Draw Equity Graph Draw Margin Graph Draw Free Margin Graph Draw Margin Level Graph Draw Drawdown Graph Draw Account Profit Graph Hide Data on Chart and Buffers Connect Gaps by Lines Sign of DDs on Profit Sign of DDs on Loss
Tips : The Indicator will draw historical balance gra
The KT QQE Advanced is a modified version of the classic QQE oscillator to depict it more accurately using the colored histogram with fast and slow Trailing Line(TL).
Unlike the classic QQE, the KT QQE Advanced consists of a histogram with overbought/oversold levels.
Applications
Find quick buy/sell signals across all the timeframes using the MTF scanner. Find the trend direction more accurately. Detects overbought/oversold market. Shows the price momentum.
Inputs RSI Period Smooth Per
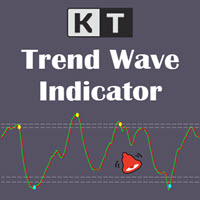
KT Trend Wave is an oscillator based on the combination of Price, Exponential, and Simple moving averages. It usually works great to catch the short term price reversals during the ongoing trending market. The bullish and bearish crossovers of the main and signal lines can be used as buy/sell signals (blue and yellow dot). It can also be used to find the overbought and oversold market. The buy and sell signals that appear within the overbought and oversold region are usually stronger.
Feature

The Quick trade report separately by symbols script will be useful for simultaneous trading on multiple instruments. It provides the ability to assess the effectiveness of trading on each symbol separately. It is possible to set a time period for making the reports. The report visualizes the changes in the balance for deals on each symbol. Also, the following key trading parameters are calculated for each instrument: Total net profit - the financial result of all trades. This parameter represent

GG TrendBar Indicator - Your Multitimeframe ADX Trading Solution Experience the power of multi-timeframe trading with the "GG TrendBar MT5 Indicator." This versatile tool, built upon the ADX indicator, offers precise insights by considering multiple timeframes, ensuring you make well-informed trading decisions. Basic Details : Indicator Type : GG TrendBar Indicator (Multi-Timeframe ADX) Key Metrics : Real-time ADX analysis across multiple timeframes. Customization : Enable or disable specific ti

This Currency Meter Calculates Strength Using a currency basket of 28 pairs? This Currency Meter uses a basket of 28 currency pair to define strength. This is very important because it gives an wholesome view of the strength of a currency by considering its reaction to all major currencies paired with it.
This Currency Meter is Multi-timeframe!!! Majority of the currency strength indicators around the market today only has a single time frame view. Even with the so called multi-timeframe versi

50% off. Original price: $60 Triangle Finder is a multi symbol multi timeframe dashboard that finds symmetrical triangle pattern in 28 symbols and 9 timeframes with a deep scan feature to scan all market watch symbols (up to 1000 instruments!).
Download Demo here (Scans only M1, M5 and M10) Settings description here MT4 version here
Triangle Finder features: Realtime monitoring of 28 customizable instruments and 9 timeframes at the same time. Deep scan mode to scan all market watch sym
The utility (Expert Advisor) is designed for monitoring and controlling the total drawdown, as well as closing all positions after reaching the specified levels or upon the occurrence of a specified time with the ability to disable the operation of the automatic EAs running in the same terminal. It is capable of tracking the status of the entire account, as well as individual pairs. It works with the positions opened manually or by other automatic EAs. It tracks the open trades in real time mode

This new version includes all MT5 timeframes (M1, M2, M3, M4, M5, M6, M10, M12, M15, M20, M30, H1, H2, H3, H4, H6, H8, H12, D1, W1 & MN1). The TD count for each timeframe is displayed on the top left corner. You don't need to do analysis anymore, as the scanner does all the analysis and updates every 1 second, allowing users to see real-time data for informed decision-making. Alerts are set on by default (can be turned off), which notifies users at the completion of every TD9. If you need a sca

IceFX VelocityMeter Mini is a very unique indicator on MetaTrader 4 platform which measures the speed of the Forex market . It is not a normal volume or other measurement indicator because IceFX VelocityMeter Mini is capable to understand market speed movements which are hidden in ticks and those valuable information cannot be read in an ordinary way from the candles. The software monitors the received ticks (frequency, magnitude of change) within a specified time range, analyzes these info and

Two Period RSI + Alerts compares long-term and short-term RSI lines, and plots a fill between them for improved visualization. Fill is colored differently according to an uptrend (short period RSI above long period RSI) or a downtrend (short period RSI below long period RSI). Short-term RSI crossing long-term RSI adds a more robust trend confirmation signal than using single period RSI alone. This is a tool to help visualize and confirm RSI trends. We hope you enjoy!
Alerts Email, message, and
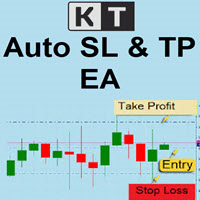
KT Auto SL TP automatically sets the stop-loss and take-profit as soon as it detects manually placed orders on the chart. It can effortlessly place the stop-loss and take profit for the market, limit and stop orders simultaneously.
Features
It can set the stop-loss and take-profit for all the active symbols from a single chart. Equipped with trailing stop-loss with steps. Seamlessly works for the market and pending orders. Shows the informational text information on the chart.
Inputs Cur

A flat market can refer to a trade in which the currency pair has not moved significantly up or down and, therefore, has no large gain or loss attributed to the forex trading position. Usually traders not trading when the market is flat.
This is a self-explanatory indicator - do nothing when the current price in a "cloud". The input parameters nPeriod and nMethod are used for calculating aqua clouds.
Please contact me with any questions: https://www.mql5.com/en/users/abduljalilmridah
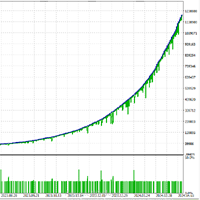
Also add me as a friend. For more profit, please change Lots_Equity 100 to 500 / 1000 / 3000 / 5000 etc and change Risk_Percent in the input level. It's only good works on GBPUSD Daily Timeframe. This robot is profitable. Minimum deposit for default setup: $1000. You can get good results with it. You can test it first . It will increase the volume in a certain ratio as the equity increases. You don't need to

Angle of Moving Averages This indicator is very simple yet powerful concept which constantly calculate the slope of the current bar moving average with respect to the N bar before moving average value. This no only give a good entry and exit signal but also it shows traders the strength of the signal. It shows positive green histogram when market is moving toward upward direction and red histograms for downtrend. When large histograms found means market has very strong trend. Inputs Available

Fair Value Gap (FVG) Indicator: Master the ICT Method in Forex Trading
What Traders Are Saying: " Transformed my trading approach with its precise gap spotting ..." – J. Doe " The alert feature is a lifesaver, never miss a trading opportunity.. ." – Alex P. " A crucial tool for anyone following the ICT methodologies in Forex. .." – Samantha R. Unlock the secrets of price movement in the Forex market with the revolutionary Fair Value Gap (FVG) Indicator. Designed for precision and ease of use,

A top-quality implementation of the famous Super Trend indicator, which needs no introduction. It is completely loyal to the original algorithm, and implements many other useful features such as a multi-timeframe dashboard. [ Installation Guide | Update Guide | Troubleshooting | FAQ | All Products ] Easy to trade It implements alerts of all kinds It implements a multi-timeframe dashboard It is non-repainting and non-backpainting Input Parameters
ATR Period - This is the average true range per

A personal implementation of the famous Bollinger bands indicator as a trend following mechanism, which uses a moving average and the standard deviation to define what a trend is and when it changes. Bollinger bands are usually used as an oversold/overbought indicator only, but in my opinion, the trading approach is more complete using the trend variant as an exit strategy. [ Installation Guide | Update Guide | Troubleshooting | FAQ | All Products ] Easy to trade Customizable colors and sizes I

Dynamic Range and Target Indicator: Your Reliable Trading Partner
Introducing an innovative indicator that revolutionizes how you analyze markets and make trading decisions. Whether you're a beginner seeking clear guidance or an experienced trader looking to enhance your strategy, this tool is designed to meet your needs.
Key Features:
1. Dynamic Range Determination: The indicator continuously analyzes the market, identifying the most recent significant price ranges.
2. Clear Suppor

Daily Bias Simplified is a user-friendly tool designed to help traders effortlessly identify the daily market direction and potential liquidity levels. This indicator not only displays the daily bias but also allows you to customize the appearance of the price level line, making it a powerful addition to any trading strategy. Key Features: Daily Market Bias : Automatically displays whether the market is bullish or bearish for the day. Liquidity Levels : Draws a horizontal line indicating the pos

This new unique indicator Actual tick footprint (volume chart) is developed for using on Futures markets, and it allows seeing the volume of real deals right when they are performed. The indicator Actual tick footprint (volume chart) represents a greatly enhanced tick chart that includes additional information about the volume of deal performed at a specific price. In addition, this unique indicator for MetaTrader 5 allows to clearly detecting a deal type – buy or sell. Alike the standard tick c

This EA offers following features to automatically increase the volume of the lot received from your signal: you can manually set the multiplier using the "multiplier" parameter; Risk control is implemented. You can set the maximum lots-to-account balance ratio using the "ratio" parameter; The "stop loss" an "take profil" levels are synchronized from the corresponding signal tickets; One-to-one replication. Each signal ticket corresponds to a copied ticket; MT4 version: https://www.mql5.com

Now, you have your own AUTO-CLOSE program ! Once your account target or drawdown hits, all open orders will be closed automatically. ========================================== INPUTS: Account target: Put the exact account target. Once the equity hits it or went above that, all orders closed. Please add buffer to consider slippage. Use fixed value or dynamic value: Choose whether you will need a fixed value or dynamic value for drawdown. DYNAMIC SETTINGS: Equity-based or Balance-based drawdo

This indicator accurately identifies and informs market reversals and continuation patterns by analyzing and signaling the Three White Soldiers / Three Black Crows pattern. It also offers a "real-time backtesting" panel in the indicator itself in a way that every change made on the indicator parameters will immediately show the user how many signals are occurred, how many take profits and stop losses were hit and, by having these informations, the Win Rate and the Profit Factor of the setup bas
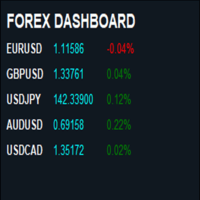
What’s the Forex Dashboard All About? Alright, so you’re diving into the world of forex trading, and you’ve probably heard about dashboards. But what are they exactly? Think of it as your command center for keeping tabs on multiple currency pairs all at once. It’s like having a radar that tells you what’s happening in the forex market without having to sift through tons of charts and data. What Does It Show You? Currency Pairs : You’ll see a list of popular currency pairs, like EUR/USD (Euro to

Functional in the Forex market. Functional on the B3 market - Bolsa Brasil Balcão. Motivation The Price Guide indicator is a tool that helps you insert support and resistance points at the chosen price and in the quantity you want, it depends on the agility of its configuration. This FULL version will work in Meta Trader 5 on all accounts and Strategy Tester . To test on the DEMO account , download the free version at: https://www.mql5.com/pt/market/product/111620 Operation The method

AABB - Active Analyzer Bulls and Bears is created to indicate the state to what extent a candlestick is bullish or bearish. The indicator shows good results on EURUSD H4 chart with default settings. The Strategy of the Indicator When the indicator line crosses 80% level upwards, we buy. When the indicator line crosses 20% level downwards, we sell. It is important to buy or sell when a signal candlestick is formed. You should buy or sell on the first signal. It is not recommended to buy more as w
Reverse TradeCopier for Followers can copy trades from an account that is running Reverse TradeCopier Source . Features: Copies trades from one source (master) account to multiple following (slave) accounts. Allows investor (read only) password for source (master) account. There are no complicated settings and input parameters, everything is easy. Works with different brokers. Works with different quotes symbols (EURUSD_FX, eurusd_m, etc.). Can copy orders from 4-digit quotes platform to 5-dig
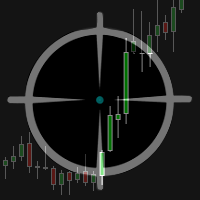
The Multicharts Crosshair draws a cross hair in any linked chart. The indicator can be used for comparison of symbol price levels in different time frame or to compare candles of different instruments in the same time frame
How it works: It can works from every linked charts where the indicator is installed towards the others or from the chart where is istalled towards the following linked charts . It can be shown just pressing a the key of keyboard. After installing the indicators in the cha
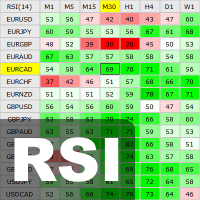
This indicator shows the current RSI values for multiple symbols and multiple timeframes and allows you to switch between timeframes and symbols with one click directly from the matrix. With this indicator, you can analyze large number of symbols across multiple timeframes and detect the strongest trends in just a few seconds.
Features Shows RSI values for multiple symbols and timeframes simultaneously. Colored cells with progressive color intensity depending on the RSI values. Ability to chan

Master Close via Telegram can help you perform some management tasks on MT4/MT5 remotely via your Telegram by one click, easy to set up & use. ************************************************************************************ LIST OF COMMANDS: info_acc - Get account info info_pen - Get pending orders details info_pos - Get positions details info_pos_sum - Get positions summary
close_pen - Delete all pending orders close_pos_all - Close all positions close_pos_buy - Close all Buy

Description of the Indicator The indicator "BullsBearsPulse" is designed for MetaTrader 5 and provides a visual representation of the Bulls Power and Bears Power indicators. These indicators are useful tools for technical analysis, particularly for the EUR/USD currency pair, to help traders identify potential trading opportunities. Functionality Bulls Power : This indicator measures the strength of the bulls (buyers) in the market. It calculates the difference between the highest price and a 20

The Volume Heatmap indicator visually shows the INTENSITY of the volume taking into account the concept of standard deviation. Purpose of the Indicator: High volumes are common where there is a strong consensus that prices will increase. An increase in volume often occurs at the beginning of a new upward trend in the price of an asset. Some technical analysts do not rely on trend confirmations without a significant increase in volume. Low volumes usually occur when an asset is heading for a down
This Expert Advisor measures the broker execution time in milliseconds. Every 10 seconds (Refresh Seconds) , the EA opens a buy stop order far away from current price (1.5 x Ask), then modifies the (price, stop loss and take profit) of the created order by 5 pips then deletes it immediately.
Inputs Refresh Seconds: Number of seconds for each re-test, default 10 seconds.
Display Last: Last Execution time Min: Fastest execution time Max: Slowest Maximum execution time Avg: Average ex
This EA trades untested fractals using pending orders. It offers many trading behaviors and flexible position management settings, plus many useful features like customizable trading sessions and a martingale mode. [ Installation Guide | Update Guide | Troubleshooting | FAQ | All Products ] Easy to use and supervise It implements 4 different trading behaviors Customizable break-even, SL, TP and trailing-stop Works for ECN/Non-ECN brokers Works for 2-3-4-5 digit symbols Trading can be NFA/FIFO C

THIS EA IS DESING TO USED IN BTCUSD
Do you want to accompany Criptotrading to the next level of bitcoin trading?
You just have to download it and try it yourself. Also testing it is free. Are you not going to try them?
Criptotrading it is a Secure Automated Software for trade Forex market and indices.
The architecture is a Fully Automatic Autonomous Robot Expert capable of independently analyzing the market and making trading decisions
Criptotrading It is an advanced and profe
This EA trades using the Stochastic Indicator. It offers many trading scenarios and flexible position management settings, plus many useful features like customizable trading sessions, a martingale and inverse martingale mode. [ Installation Guide | Update Guide | Troubleshooting | FAQ | All Products ] Easy to use and supervise It implements three different entry strategies Customizable break-even, SL, TP and trailing-stop Works for ECN/Non-ECN brokers Works for 2-3-4-5 digit symbols Trading can

If you use the MFI (Money Flow Index) indicator, the waiting time till the next signal can be long enough. Now you can avoid sitting in front of the monitor by using MFI Alerts. This is an addition or a replacement to the standard MFI oscillator . Once there appears an MFI signal on the required level, the indicator will notify you with a sound or push, so you will never miss a signal. This is especially significant if you follow the indicator in different timeframes and currency pairs, which ca

Currency Strength Meter is the easiest way to identify strong and weak currencies. This indicator shows the relative strength of 8 major currencies + Gold: AUD, CAD, CHF, EUR, GBP, JPY, NZD, USD, XAU. Gold symbol can be changed to other symbols like XAG, XAU etc.
By default the strength value is normalised to the range from 0 to 100 for RSI algorithm: The value above 60 means strong currency; The value below 40 means weak currency;
This indicator needs the history data of all 28 major curre

Elysium is a fully automated trading robot based on Price Action and Momentum. The EA's unique trading strategy has a high probability of winning.
Elysium is optimized for use with low spread currency pairs. EA does not need complicated settings, no need set files. ONLY 10 COPIES OUT OF 10 LEFT AT $ 99! After that, the price will be raised to $490. Info:
Working symbol EURUSD or GBPUSD or USDJPY Working Timeframe: M1 Min deposit $1500 with Stop Loss settings (or equivalent in cents ) The mi
The EA identifies divergences in two correlated currency pairs and trades in the direction where they converge back. Working timeframe: M30
Input parameters MagicNumber - identification number for the EA. OrdersComment - comment to order, automatic if an empty value is set. Lots - lot size. DepoPer001Lot - automatic lot calculation (specify the balance per 0.01 lot) (if 0, the value from 'Lots' parameter is used). TimeFrame - working timeframe. Symbol #2 - correlated currency. Symbol #2 revers
This EA has been developed, tested and traded live on EURUSD M30 TF. Everything is ready for immediate use on real account. Very SIMPLE STRATEGY with only FEW PARAMETERS. Strategy is based on KELTNER CHANNEL BREAKOUT. It enters if volatility raise after some time of consolidation. It uses STOP pending orders with ATR STOP LOSS. To catch more profits there is a TRAILING PROFIT function in the strategy. EA has been backtested on more than 18-year long tick data with 99% quality of modeling and ve
Looking to boost your trading performance on MT5? Introducing the signal indicator that will become your reliable ally on the path to success! This unique indicator utilizes arrows and a color-changing moving average to simplify your trading decisions. When the trend shifts upwards, the indicator turns the line blue, alerting you to potential price increases. If the trend reverses downwards, the line turns red, signaling a potential price drop. Additionally, arrows precisely indicate the optimal

"ONE SHOT, ONE KILL" - Trade like a Pro SNIPER . The best EA for anyone who loves the ACCURACY, PATIENCE, PERFECTION. The EA works like a sniper who hidden and waits until the best chance coming. So that, it only places about one order per month on average. While waiting, it takes time to analyze the market to find a unique pattern with the highest win rate (you can see it takes time in the backtesting). - This EA isn't suited for people who want to trade a lot of orders per day, trade every day

MACD strategies EA is a EA that can support multiple MACD strategies. Purchasing this EA can save you the time taken to automate your existing MACD strategy through coding a custom EA and it also helps you discover profitable MACD strategies as its fully compatible with the strategy tester and all settings are editable. The EA supports both scalping, short term and long term strategies. The various supported settings are explained below: NOTE: The default settings in the EA are s

"Wouldn't we all love to reliably know when a stock is starting to trend, and when it is in flat territory? An indicator that would somehow tell you to ignore the head fakes and shakeouts, and focus only on the move that counts?" The Choppiness Index is a non-directional indicator designed to determine if the market is choppy (trading sideways) or not choppy (trading within a trend in either direction). It is an oscillating indicator between -50 (very trendy) and +50 (very choppy). There are man
MetaTrader 플랫폼 어플리케이션 스토어에서 MetaTrader 마켓에서 트레이딩 로봇을 구매하는 방법에 대해 알아 보십시오.
MQL5.community 결제 시스템은 페이팔, 은행 카드 및 인기 결제 시스템을 통한 거래를 지원합니다. 더 나은 고객 경험을 위해 구입하시기 전에 거래 로봇을 테스트하시는 것을 권장합니다.
트레이딩 기회를 놓치고 있어요:
- 무료 트레이딩 앱
- 복사용 8,000 이상의 시그널
- 금융 시장 개척을 위한 경제 뉴스
등록
로그인
계정이 없으시면, 가입하십시오
MQL5.com 웹사이트에 로그인을 하기 위해 쿠키를 허용하십시오.
브라우저에서 필요한 설정을 활성화하시지 않으면, 로그인할 수 없습니다.