MetaTrader 5용 유료 Expert Advisor 및 지표 - 157

유동성 및 이동 평균에 따라 달라지는 지표 > 98%의 정확한 매수 및 매도 결정을 제공합니다. 그리고 거래를 마감할 시간. PRICE는 수시로 증가할 것이며 첫 번째 EA가 출시되는 시기는 이 지표에 따라 2k 이상이 될 것입니다. 1 - 매수 또는 매도 포지션을 열 때(두 라인 X의 교차에 따라 다르며 포인트 계산은 선택한 프레임에 따라 다름) (십자가는 색칠된 영역 밖에 있어야 함) 촛불은 십자가 후에 또는 (첫 번째 또는 두 번째에서 다섯 번째까지) 십자가에 닿아야 합니다. 마지막 조건이 십자가 아래에서 직접 확인되었을 때 계산되는 포인트(스크린샷이 있는 표 참조.. 더하기 도구를 사용하여 면적 계산) 2-다음 영역 외부의 노란색 라인 시작 곡선이 위치를 닫으라는 신호일 때 3-works on Frames (1m 5m 10m 15m 30m 1h 4h 매일 주간 및 월간)(모든 쌍>및 모든 상품) 전공 권장 4- ..(55%)의 이득을 얻은 후 트레일 스톱 1000$ 스택에

THE MAIN IDEA. First of all, this is the fourth of an EA family, based on same strategy applied to different indicators.
This means that the same strategy and same money management is applied to different indicators with spread main filtering.
All EAs are sensitive to TF, please optimize H4, H1, M30. There is great difference.
Final goal is to design an EA with higher success rate possible, with lowest losses overall.
This peculiarity, will grow confidence in EA usage, for long term

THE MAIN IDEA. First of all, this is the third of an EA family, based on same strategy applied to different indicators.
This means that the same strategy and same money management is applied to different indicators with spread main filtering.
All EAs are sensitive to TF, please optimize H4, H1, M30. There is great difference.
Final goal is to design an EA with higher success rate possible, with lowest losses overall.
This peculiarity, will grow confidence in EA usage, for long term satisfactio

다중 통화 Expert Advisor는 거래 수단과 포지션 볼륨 간의 상관 관계 시스템을 기반으로 합니다.
핵심 역할은 자본 관리 시스템과 열린 거래의 수와 방향의 고유한 비율에 의해 수행됩니다.
Expert Advisor는 스캘퍼가 아닙니다. Expert Advisor의 자신감 있는 운영에는 주문 실행 속도가 중요하지 않습니다.
거래 수단: EURUSD, GBPUSD, EURJPY, USDCAD, USDJPY, GBPJPY, EURGBP, AUDCHF, USDCHF, AUDCAD, AUDUSD, AUDJPY, CADCHF, CHFJPY, CADJPY.
EA는 완전 자동화된 거래를 위한 준비가 되어 있습니다. 추가 설정이 필요하지 않습니다. Live signal: https://www.mql5.com/en/signals/1328312
시작하려면 하나의 차트에 Expert Advisor를 설치해야 합니다. 설정: 작업 쌍 - 거래 수단; 신호 TF - 메인 타임프레임; 이

1.自動売買ソフトウェア(EA)の特徴 当自動売買ソフトウェア(EA)の特徴を詳しくお伝え致します。 FX 証券会社:CryptoGT、FXGT etc... プラットフォーム:MT5 専用 取引通貨:ビットコインドル (BTCUSD) 取引スタイル:スキャルピング~中期 取引時間軸:15 分足 (M15) まず、チャート上では、インジケーターなどは必要ありません。 当 EA へ全て組み込まれています。 推進はビットコインドル (BTCUSD) 15 分足用です。 ビットコインはご存じの通り、値動きが激しいです。 ほとんどがレンジですが、ブレイクするととんでもないほど動きます。 保有ポジション損失リスクを抑えたハーフ&ハーフのトラップ&リピートタイプ EA 利益はあっても保有ポジションによる損失(ロスカット)を減らす工夫として 値幅設定レンジ中央値より上では売りのトラップ&リピート、 中央値より下では買いのトラップ&リピートを行います。 パラメーター設定では、注文範囲の調整・フィルターによる発注抑制・トレーリングストップ の機能を備えています。 トラップ&リピートタイプの取引では、弱点
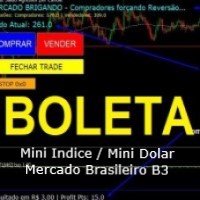
BoletaLira is a fundamental tool focused on beginning and advanced users so that they can enter operations with the main input signals such as:
- Market Trend: High or Low, always taking into account the moving average pre-defined in the setup.
- Correlation between 2 assets: In the case of Brazilian B3 we can use the BoletaLira for Mini-Index but using the Dollar signs so that we can have greater security, for those who do not generally know the Index x Dollar assets try to go in the opposit

Reversible indicator.
You need to understand that any indicator is just a visual waveform. Currency pairs never rise or fall in a straight line. Their rises and falls are alternated by pullbacks and turns.
The Reversible indicator contains an entire trading system, processes information from several technical instruments and the appearance of its signals is the final calculation result. The indicator itself evaluates how strong a signal appears in the market and when to change direction, sign

BTC/USD SCALPING
スキャルピング型EA
こちらは仮想通貨向け自動売買プログラムとなっております。 シグナル公開予定
通貨ペア :BTC/USDに最適なナンピン及び利確設定をしております ロット数:0.01~ パラメータ ・ロット数:最初の注文ロット数を入力してください。これを基準に、ナンピンに増加していきます。 ・ナンピン:ONにするとナンピンを行いますので、ONにしてご利用ください。 ポジション数: 最大21ポジション 時間足 :M1 注文条件 ・EA起動後、一定の値動きで逆張りを行います。 ・100BTC/USDごとにナンピンを行います。(ただし証拠金維持率が500%以上のあいだ) ・一定の利益にて全決済を行います。 その他 ・マーチングゲールではありませんが、ナンピンを行うため、ある程度のリスクがございます。 ・証拠金は1000USD以上を推奨しております。
BluePrint TimeFrame: M5 or above . BluePrint is an Expert Advisor based on Price Action and Martingale.
Configurations: +---------------------------------- BLUEPRINT | EA Settings ----------------------------------+ Magic Number: ID that should be changed if you want to install Expert Advisor on different graphics, without interfering with each other and behaving like a single Expert Advisor. Max Spread By Tick Size: The maximum Spread difference that you want to trade. Lots Mode: You
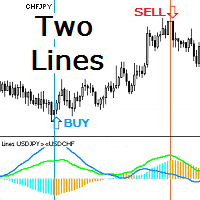
Индикатор показывает две линии динамики движения двух инструментов. Если один из коррелирующих инструментов убегает, другой будет его догонять. Этот принцип даёт точки входа в сделку по их кроссу или для синхронной покупки и продажи в парном трейдинге. Гистограмма индикатора показывает значение дистанции между линиями инструментов. При уменьшении и увеличении дистанции гистограмма принимает разные цвета. Треугольный значок показывает текущее состояние линий: расхождение ( Divergence ) или схо

One of the most popular methods of Technical Analysis is the MACD , Moving Average Convergence Divergence, indicator. The MACD uses three exponentially smoothed averages to identify a trend reversal or a continuation of a trend. The indicator, which was developed by Gerald Appel in 1979 , reduces to two averages. The first, called the MACD1 indicator, is the difference between two exponential averages , usually a 26-day and a 12-day average.

For Meta Trader 5. We have all experienced a situation where the market wipes out our stoploss before it turning in the direction we had anticipated. This experience is more frequent when you use a trailing stoploss. If only there was a way to place and trail the stoploss just the perfect amount of pips away. Well, there is... The Average True Range (ATR) is a one of the most popular technical analysis indicator, introduced by J.Welles Wilder, that measures Market Volatility for a given numbe

VR 시스템 은 단순한 지표가 아니라 금융 시장 거래를 위한 전체적으로 균형 잡힌 거래 시스템입니다. 이 시스템은 고전적인 거래 규칙과 지표 이동 평균 및 Donchian 채널 의 조합을 기반으로 구축되었습니다. VR 시스템 은 시장 진입 규칙, 시장 포지션 보유 규칙, 포지션 청산 규칙을 고려합니다. 간단한 거래 규칙, 최소한의 위험 및 명확한 지침은 VR 시스템을 금융 시장 거래자에게 매력적인 거래 전략으로 만듭니다. 설정, 세트 파일, 데모 버전, 지침, 문제 해결 등은 다음에서 얻을 수 있습니다. [블로그]
다음에서 리뷰를 읽거나 작성할 수 있습니다. [링크]
버전 [MetaTrader 4] 거래 시스템은 이동 평균과 Donchian 채널이라는 두 가지 결합 지표로 구성됩니다. Donchian 채널 – 금융 상품의 현재 상태를 결정하기 위해 설계되었으며 추세 또는 평면을 결정하는 고전적인 규칙에 따라 구성되었습니다. 새로운 로컬 최대값이 이전 것보다 높고, 새로운 로컬

Recommended TimeFrame >= H1. 100% Non Repainted at any moment. Use it carefully, only with Trend Direction.
Trading Usage: 2 Variants: as Range System or as BreakOut System (Both Only With Trend Direction)::: (Always use StopLoss for minimise Risk);
[1] as Range System: (Recommended) in UP TREND: - BUY in Blue Line , then if price goes down by 50 points (on H1) open Second BUY. Close in any Profit you wish: TrailingStop(45 points) or Close when Price touches upper Gold Line.
in DOWN TREND

ECHO INDICATOR V2.2 Update
A top-quality indicator works with trend and pattern. The tool is a good assistant for the traders use various levels in trading.
When price approaches a level, the indicator produces a sound alert and (or) notifies in a pop-up message, or via push notifications. A great decision making tool for opening orders. Can be used any timeframe and can be customized
Easy to trade It implements alerts of all kinds It implements a multi-timeframe
Trade with Trend + signa

The adviser uses a strategy based on trading in the daily interval of the chart using the M5, M15, M30 timeframe. Advisers calculates the signal using technical indicators and only on the daily time intervals. The EA uses an intelligent algorithm for partial closing of an order in profit, thereby minimizing the lot size and in case of a price reversal, the loss will be small. Each position is strictly protected by stop loss. A multi-currency adviser trades in 26 currency pairs. Use multicurrency
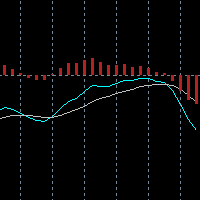
The built-in MACD does not properly display all the different aspects of a real MACD. These are: The difference between 2 moving averages A moving average of (1) A histogram of the difference between (1) and (2) With this indicator you can also tweak it as much as you want: Fast Period (default: 12) Slow Period (default: 26) Signal Period (default: 9) Fast MA type (default: exponential) Slow MA type (default: exponential) Signal MA type (default: exponential) Fast MA applied on (default: close)

Recovery Bad Order MT5 (System to recovery lost trader whit recovery algorithm).
This system used algorithm in the ea for initial recovery algorithm, this system close one part of loses trader, whit algorithm recovery. (the lot recovery is a factor o lot used in the entry recommended used 0,1 for lot and 0,01 for recovery lot). https://youtu.be/FlpOhpiy7Pc Recovery Bad Order MT5 is an Expert Advisor for recovering losses of positions that were opened in the wrong direction (that were opened b
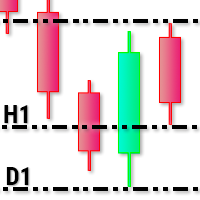
This utility tool draws timeframes top/bottom horizontal named lines on the chart, which highlight important regions and can assist in decision making for trading. Inputs: Timeframes Top/Bottom Lines: H1 (1 hour), H4 (4 hours), D1 (Daily), W1 (Weekly), MN1 (Monthly): You can choose to enable or disable timeframes top/bottom named lines. Lines Color: You can choose your favorite from the available colors or type in a custom RGB color (values from 0 to 255, e.g.: 100, 128, 255). Lines Style: You c
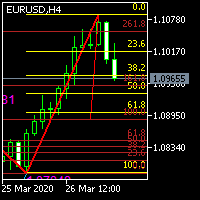
Two-way Fibonacci indicator. The function is to facilitate traders to find their retracement and entry and exit points. The principle of the workpiece of this indicator: First, draw a V shape for the high and low points formed by the fractal indicator, and then draw a golden section proportional line for the V line, which can be applied to any period and currency pair.
The expert is designed for single scalping at the daily opening of MICEX trades ( It starts working a few seconds after 10=00 ). It is advisable that the expert should work at 1 hour timeframe. The expert considers integer number of lots specified by the user, verification is minimal, martingale is not provided. The expert at the beginning of work (market opening + selected delay in seconds)) opens 2 pending orders of users volume specified by the parameter of an offsets, thet are relative to c

Unique trend trading algorithm with advanced filtering and many features which should become a part of your trading arsenal. This indicator can give you also trading advisors (with take profit target), success rate scanner and much more. TrendMagiX PRO comes with built-in multi-pair and multi-timeframe scanner which is fully adjustable. User can select own symbols and time-frames to monitor. + ALL the features of standard TrendMagiX indicator
Important information For additional detailed inform

This EA was researched and coded for years to come to life. It was tested with 99.9% tick data with spread swap and commission on all the currencies. The package includes fully tested and stress tested set files.
Always use the latest set files from the comment section!
Recommendations:
Minimum 1000$ starting deposit VPS for better trading experience The set files are for H1 timeframe At least 1:10 leverage
Introducing the Leopard EA for MT5: This Expert Advisor has been meticulously develop

Vol 2 DPOC volume vol 2 DOC-dynamic horizontal volume indicator for any time periods
Main settings of the indicator: Volume Source -selecting data for volumes (tick or real) DPOCOn -enabling / disabling the indicator DPOCFrom -calculation start date DPOCTo -settlement end date The indicator allows you to manually select areas on the chart to analyze changes in the maximum volume over time.
You can do this by using vertical lines and moving them along the chart. Or by setting specific dates in
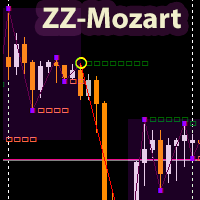
The ZigZagMozart indicator is based on the calculation of the advanced ZigZag. Displays trend break points (white squares), resulting points (yellow circles), flat zones (purple dots). The only indicator parameter: “ pivot in points ” - the minimum shoulder between the peaks of the indicator. The indicator uses market analysis based on the strategy of the famous modern trader Mozart. https://www.youtube.com/watch?v=GcXvUmvr0mY.
ZigZagMozart - works on any currency pairs. If the parameter “pivo

1. Record the price data for each Tick transaction. Data file contents: "Tick time", "ASK price", "BID price", "SPREAD SPREAD", "Tick quoted quantity". 2. Meanwhile, generate a quotation data file with a 1-minute period. Content of 1min data file: "ASK time", "ASK OPEN price", "ASK HIGH price", "ASK LOW price", "ASK CLOSE price", "BID time", "BID OPEN price", "BID HIGH price", "BID LOW price", "BID CLOSE price", "Tick quoted quantity". 3. Save all quotation data in one file every day, which is c

トレンド順張り型EA
こちらは仮想通貨向け自動売買プログラムとなっております。 シグナルも公開中
通貨ペア: 全ての通貨ペアに使用できますが、トレンド性の強い仮想通貨がおすすめです。 ロット数: 自動計算 パラメータ ・リスク:証拠金に対するロット数の割合です(0.01~3が推奨値です) ・マジックナンバー:EAを識別するためにご利用ください。 ポジション数: 最大1つとなっておりますのでリスクは最小限となっております。 時間足 :内部的に1H足を使用してますのでどの時間足でもエントリーは同じになります。 注文条件 ・一定期間の高値、安値を監視することでトレンドに対して順張りを行います。 ・トレンドを検知した時点で順張りを行い、トレンドが反転するまで追い続けます。 ・トレンドが反転したら決済&反対方向へのエントリーを行います。 その他 ・もちろん自己判断で途中で決済していただくことも可能です。決済後は再度トレンドが検知した際に順張りを行います。
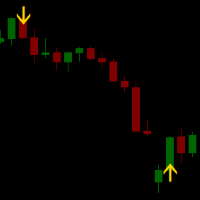
Signal RSI printa no gráfico os melhores momentos de entrada segundo o indicador RSI.
No gráfico aparecerá uma seta indicando o momento e a direção de entrada para a operação. O encerramento da operação se dá ao atingir o lucro esperado ou o stop. Se estiveres com uma operação aberta e aparecer outra seta de sentido inverso, inverta a mão e aproveite! Amplamente testado em gráficos de mini índice e mini dólar, bem como ações e FIIs.
Gráficos recomendados: 5, 10, 15 min.

Several techniques use volume as an important point in the trade. Whether to indicate strength, exhaustion, pullback weakness, among others.
In chief I quote Richard Wyckoff's theory, which said about the importance of looking price and volume.
However, there are several possibilities to filter what is volume that should be noticed.
PVRSA/PVA users use an indicator with specific colors, which assist in identifying the volume and type of movement that the price has made.
Will the high volume

Expert Advisor for use in all Market. For more details visit: Telegram group: https://t.me/SlakingFXEA Parameters Set Name Magic Number Allow Buy Allow Sell PipStep (points) Max Martingale Orders (0 unlimited) Max Loss $ day (0 don´t use) Mas Loss % day (0 don´t use) Max Profit $ day (0 don´t use) Mas Profit % day (0 don´t use)
K Period D Period Slowing Overbought Oversold Type of smoothing Calculation method
Lots Auto Lot Initial Balance for autolot calculate Martingale (1 don't use) Take Pro

#Multicurrency #Hedging #Martingale #28Symbols @AUD @CAD @CHF @JPY @NZD @USD @EUR @GBP In the globalisation process that the world economy has undergone in the last two decades, financial markets have played a leading role. The easy and fast access to information, together with the growing economic interdependence between the different commercial blocks, have caused more and more economic agents to participate in non-national financial markets. Even small investors, thanks to the Internet and

GO IT - it is a Secure Automated Software for trade Forex market and indices.
ONLY RECO M ENDED FOR GBPUSD AND EURUSD Can used this EA whit 100$ in your account
The architecture is a Fully Automatic Autonomous Robot Expert capable of independently analyzing the market and making trading decisions
GO IT It is an advanced trading system. This is a fully automatic Expert Advisor. It is a 100% automatic system, the system controls both the inputs and the

SupeRobot is a fully automated trend robot working on the long run based mainly on the stochastic signal improved to work best with the EURUSD pair. After the backtest, it gave promising results from 2019 until today. It's recommended to have at least 300 $ on your trading account before using this robot to trade. In order to get the best results : Set "MaxPositions" up to 10. it's set by default to 1. (it sets the number of the maximum opened positions at the same time) Set leverage to 1:500. M

The advantage of the Price Surfing indicator is the search algorithm for the extremes of the price of the instrument. Most indicator signals are located at local maximums and minimums of the price . For the convenience of the trader, the potential profit of each signal is displayed on the chart. The indicator does not repainting, the signal appears after the bar is closed. MT4 version https://www.mql5.com/en/market/product/46054 Parameters SendAlert - enable alert of a new signal SendEMail

Introduced expert system Stable Ex MT5 works with the EURUSD currency pair and only with it. This system implemented the principle of five orders - that is, a maximum of five orders can be placed in one direction, after which the total position of the series must be closed by stops, either real or virtual. The trading system is designed to work separately with a series of buy orders and separately with a series of sell orders. which makes the trading system versatile enough. The expert passes a

Learning to trade on indicators can be a tricky process. Volatility Index indicator makes it easy by reducing visible indicators and providing signal alerts Entry and Exiting the market made possible through signal change Works well with high time frame to reduce market noise simplicity in trading guarantees success and minimal losses Our system creates confidence in trading in case of any difficulties or questions please send message

One of the Best Volume Indicators, with the addition of a Moving Average for weighting volume over time average.
If the "Current Candle" Volume is X% greater than the Moving Average value, we will have a sign of increasing volume.
It can be a sign of Beginning, Continuity, Reversal or Exhaustion of the Movement.
Fully configurable and all options open, you can color and set ALL values as you see fit.
The 'Volume Break' shows volume bars in the same color as the candlestick, in addition to b

Benefits: A new and innovative way of looking across multiple timeframes and multiple indicators on any chart. Provides instant multi-timeframe analysis of any market. i.e. forex currency pairs, cryptocurrency pairs, commodities, etc. It offers precise indications across multiple timeframes of volatility as measured by RSI, ADX and STOCH within one chart. Helps you determine high probability trading setups. See example strategy in comments. Can see bullish/bearish volatility building across mult

Bearish/Bullish divergent bar . One of the signals of the "Trade Chaos" system of Bill Williams. (First wiseman)
When bar moving away from the "Alligator" indicator and there is divergence on the Awesome Oscillator indicator, it shows a potential point of movement change.
It is based on the opening/closing of the bar, the position relative to the previous ones, the Alligator and AO.
When trading, the entrance is at the breakthrough of the bar(short trade - low of bar, long trade high of bar), a

The Price Control indicator determines a short-term and long-term trend. The analysis is based on the selected timeframe. The indicator shows the points of opening deals for sale or purchase, and also indicates the direction of the trend at:
Short term Long term
The indicator not only signals an immediate purchase or sale. It indicates a short-term and long-term trend. The indicator allows you to examine in more detail the real and historical market trends!

Professional innovative system for trading on a live account. Based on patterns of closing gaps in price movements. The ability to adapt to any market. Minimum deposit of $ 10.
Features of the trading strategy In the graphs of the movement of currency pairs, gaps are often formed. Usually they occur after days off or holidays. This is due to a change in some fundamental factors of the markets during the absence of trading. Therefore, immediately after the opening of the market, one can observe

Forex Driver is a great tool for detecting peaks and valleys on a chart. This indicator uses a modified peak and trough detection algorithm. This algorithm includes the Fractals indicator and the ZigZag indicator.
This tool should be used to analyze peaks and valleys, as well as to detect patterns, or for other purposes. You can use this powerful tool for your own purposes at your own risk.

This bot is based on the analysis of adaptive moving averages. The expert is distinguished by stable signals, which can be used as accurate short-term signals. This is a semi-scalping system that analyzes the market using reliable indicators. Scalper is a system or not, depends on the parameters TakeProfit and StopLoss. Using this adviser, you need to understand that this bot requires optimization. The bot works both on netting accounts and on hedging accounts. But the settings must be optimize
Trend Reversal Indicator This indicator works effectively in the early stages of a trend, helping to identify trend reversals. Trading Recommendations: The signal is generated on the current candle. It is recommended to enter the trade on the next candle. The target profit is 20-30 pips. There are three stop-loss options: Exit the trade upon receiving an opposite signal. Place the stop-loss directly behind the signal. Set the stop-loss at the nearest high or low. It is advisable to avoid tradin

Strategy Manager is a Multi-Time-Frame & Multi-Currency Dashboard for Metatrader 4 and 5. Thanks to a free, external graphical user interface, build your own strategy by combining any indicators and loading them into the dashboard to see the result ! In addition, you can precisely set-up your Auto-trading & Notifications and use indicators for Stop-Loss, partial profit or limit. Filter your automatic trading & notifications with forex calendar and more. Open and Manage your orders directly w
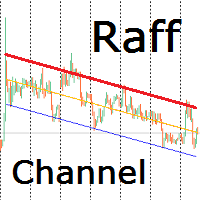
Индикатор строит канал Раффа на основе линейной регрессии. Красная линия тренда может использоваться для принятия решения о покупке или продаже внутрь канала при подходе цены к ней. Настройками можно задать ширину канала по коэффициенту отклонения от базовой линии или по максимальному и минимальному экстремуму. Так же можно включить продолжение канала вправо от текущих цен. Индикатор канала регрессии Раффа – удобный инструмент, значительно облегчающий работу современного трейдера. Он может быть

*Non-Repainting Indicator Bruce Webb Explains How To Use Bruce's Price Predictor In Detail And Free Forex Strategy https://youtu.be/hfoB1tZZpTo Bruce's Price Predictor is an indicator that shows precise price reversals. A great arsenal to add to any chart. Bruce's Price Predictor points price reversals with high degree of accuracy and it is great for scalping on the 1min time frame, Or swing trading on the 1hr time frame. Buy and sell arrows are shown on the chart as for entry signals. They do

Description adviser NatalySix1. Automatic advisor based on 3 MA, also adjustable moving average method, you add adjustable commission, compared to the currency you use, tp points and step in case if it enters wrong position, when changing buy or sell conditions, director closes all positions if he or she exceeds a certain level, for example 10 euros, use a director preferably with a lot that does not exceed 0.01, 0.02 a risky strategy to avoid daring to use with larger lots ,, to decrease the

XETERA MULTI TP MANAGER Xetera Multi TP Manager for Vix75 is an Expert Advisor specially designed for Volatility 75 Index on the Meta Trader 5 platform to manage trades even while you are away or asleep. Many Forex Signal Services out there use multiple take profit levels such as TP1, TP2, and TP3. The signal services give you multiple target levels to increase your profit, but the problem is you always need to monitor your trades and move the Stop Loss, trailing. So, we fixed this issue by d

XETERA MULTI TP MANAGER Xetera Multi TP Manager for FX is an Expert Advisor specially designed for Forex on the Meta Trader 5 platform to manage trades even while you are away or asleep. Many Forex Signal Services out there use multiple take profit levels such as TP1, TP2, and TP3. The signal services give you multiple target levels to increase your profit, but the problem is you always need to monitor your trades and move the Stop Loss, trailing. So, we fixed this issue by developing our EA t

Yellow mouse scalping Yellow mouse scalping is a fully automatic Expert Advisor designed for night trading on a calm market. The strategy is night scalping. The standard RSI and ATR indicators are used to find entry points. Closing of transactions takes place according to the author's algorithm, which significantly improves the risk control and security of the deposit. Risky strategies like "martingale" are not used. Monitoring of the advisor's work, as well as my other developments, can be vie

Only profit! This is a smart grid trading robot. It works on my original algorithm! At medium risks, it shows more than 100% profit per year. ( Tested exclusively on real ticks and real accounts ) This robot is created to receive income more than any bank offers. It trades automatically around the clock on any currency pair! ( I do not recommend "exotic" currency pairs ) Adjustable risks. Adjustable position volume. Adjustable mesh pitch. Adjustable profit level. Not tied to a time f
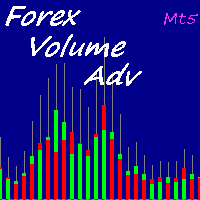
Forex is the most liquid market in the world. For this reason real volumes are not available. Some indicators use the number of ticks, in other cases the broker can supply volumes informations but they will be only data about that broker. Volumes are important becase they will form the price and volatility of the market. Using an algorithm this indicator can give you a very good approximation of the volumes for each candle.
How to read the indicators?
This version provides you many visualizati

This indicator plots VWAP with 4 Standard Deviation bands. In finance, volume-weighted average price (VWAP) is the ratio of the value traded to total volume traded over a particular time horizon (usually one day). It is a measure of the average price at which a stock is traded over the trading horizon. VWAP is often used as a trading benchmark by investors who aim to be as passive as possible in their execution. Many pension funds, and some mutual funds, fall into this category. The aim of usi

Pulsar it is a Secure Automated Software for trade Forex market and indices.
The architecture is a Fully Automatic Autonomous Robot Expert capable of Independently analyzing the market and making trading decisions.
Pulsar It is an advanced trading system. This is a fully automatic Expert Advisor.
NO INPUT TO SELECT FOR THE TRADER ALL AUTO MATED
THIS SYSTEM IS ALWAIS IN THE MARKET IN THE TWO DIRECCTION MAKE WINING CYCLES
PULSAR . It is a 100% automatic system, the system controls

Sentiment Liner This is a steroidised Daily-Weakly-Monthly high-low and open, must have indicator. With this stuff user can determine the average of (daily-weakly-montly) open levels. 4 example: if you in day mode switch the average to 5, you get the 5 day sentiment. In weakly mode turn the average to 4, than you get the 4 weak sentiment,...so on. Naturally one can us as a simple day-week-month high and low indikator. S1: high S2: low Pivot: open, Average: averager

표시기는 다음을 보여줍니다(선택 사항): Spearman의 순위 상관 계수, Pearson의 선형 상관 계수, Kendall의 순위 상관 계수 및 Fechner의 부호 상관 계수. 이 오실레이터는 가격이 과매수 및 과매도 수준을 넘어설 때 가능한 시장 반전 지점을 보여줍니다. 얻은 값의 추가 필터링에는 단순, 지수, 평활, 선형 가중치의 4가지 방법이 있습니다. 막대가 닫힌 후 값이 고정되고 다시 칠하지 않습니다. Spearman 계산을 사용할 때 알려진 SSRC를 얻지만 이 표시기에서는 실제 계수가 계산되고 계산 결과에 평활화가 적용되어 값을 다시 칠하지 않습니다. 매개변수:
Calculation mode/period/price - 모드/기간/상관 계수 계산을 위한 사용 가격 Smoothing period/method - 기간/결과 값 평활 방법

Daklak MT5 is a EA which use the martingale strategy. This EA has been tested for 20 years historical data with good result and acceptable drawdown. Note: 1. The default setting is set for AUDUSD 30M chart. 2. Minimum deposit: $1000 3. Account type: Hedging Account Parameters Lot Size per 1000=0.01- Mean the starting lot size will be 0.01 per 1000 unit balance. (ex: if the balance is $3000, the first trade lot size will be 0.01)
Start Distance Rate=5.0- Mean the distance rate of the first

reference:
"High Frequency Trading, A Pratical Guide to Algorithmic Strategies and Trading Systems (Aldridge, Irene)"
Characteristics The calculation of VWAP is in accordance with the literature. 4 types of VWAPs, daily, monthly, yearly, moving. Note: Daily is the most popular form, the calculation is performed from the beginning to the end of each trading session (Market benchmark). In the moving, the calculation is carried out from n periods past to the current period, as with the famous m

The Exp Crassula expert Advisor can start working with a minimum Deposit of $ 20. it is possible to enable automatic lot increase (calculated from the result of the last transaction.) The expert is working around the clock in fully automatic mode.
The expert showed good results on the history of the EURUSD H1 pair.
You can enable it on other timeframes and currency pairs by first testing and selecting the minimum size for the calculation in paragraphs parameter. it is recommended to use from 5

Trend Trader is an intelligent, fully automated EA. It's combining Institutional Levels (for stop loss and profit targets), and 3 indicators for buy and sell signal at same time. When 3 indicators agree with each other for trend, or changing trend, EA will open position, stop loss will be set on last low, or high, depending on direction, and targets profit are made on levels (on default settings, you can change it). Indicators its using are Expert Market Edge (custom made indicator https://www.

ULTIMATE SCALPING MT5는 FOREX 시장에서 작동하도록 설계된 자동화된 전문 스캘핑 Expert Advisor입니다. 이 전략은 최고의 시장 진입점을 결정하기 위해 RSI 상대 강도 지수와 ATR 평균 실제 범위를 사용합니다. Expert Advisor는 숙련된 트레이더와 초보자 모두에게 적합합니다. 가장 변동성이 큰 쌍은 GBPUSD, USDCAD, EURUSD, USDJPY, USDCHF, AUDUSD, NZDUSD와 같은 작업에 적합합니다.
MT4 버전: https://www.mql5.com/en/market/product/46512
옵션:
TIMEFRAME_ATR - ATR 시간 프레임; PERIOD_ATR - ATR 기간; MIN_VALUE_ATR, MAX_VALUE_ATR - 최소값/최대값; TIMEFRAME_RSI - RSI 시간 프레임; PERIOD_RSI - RSI 기간; APPLIED_PRICE - 계산을 위한 가격 선택. CALCULATE_
Советник локирует убыточную позицию или сетку с указанным Magic number и в дальнейшем пытается свести убыток к нулю, или минимуму. Продолжительность операции зависит от параметров советника и может продолжаться от нескольких дней до нескольких месяцев. Параметры советника и их назначение: What position is locked Какого направления позицию или сетку позиций локируем. Buy или Sell.
Magic number Magic number позиции которую локируем. Width lock
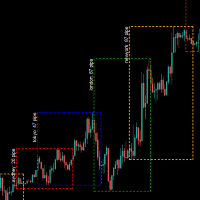
Forex market time indicators, including Sydney, Tokyo, London, New York 4 market times Considering server daylight saving time switching and daylight saving time switching in each market
input ENUM_DST_ZONE InpServerDSTChangeRule = DST_ZONE_US; // Server-side daylight saving time switching rules According to New York or Europe
input int InpBackDays = 100; // maximum draw days, for performance reasons
input bool InpShowTextLabel = true; // display text label which market, current volatility i

Scaner indicator.
Currency pairs never rise or fall in a straight line. Their rises and falls are alternated by pullbacks and turns. Each growth and each fall is reflected in your emotional state: hope is replaced by fear, and when it passes, hope reappears. The market uses your fear to prevent you from taking a strong position. At such times, you are most vulnerable.
Everything will change if you use the Scaner indicator.
The Scaner indicator was created to neutralize temporary pauses and r
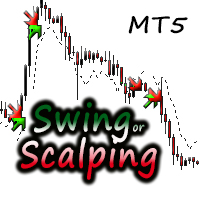
Continuous Coloured dot lines under and above price when conditions are met. Arrows Red and Green for entry Points. User can change the colours of the arrows in the colour section of the indicator. It is consider a great scalping tool on lower time-frames, while higher time frames will have fewer opportunities but trades will possibly last longer. There is an input for Alert on or off. This can be used effectively on M15/M30 Chart until up to H4 chart time. It is best if the user has some

This indicator improves the "DMI Trend" so that the trend signal reacts faster than before.
---The indicator allows you to simplify the interpretation of signals produced by the classical ADX indicator.
The position of the hight bars of the histogram relative to zero and the histogram coloring indicate the direction of price movement determined by the intersection of DI+ / DI-.
The position of the hight bars of the histogram relative to zero and the color indicate the strength of the price mo

Martha is an Expert Advisor (EA) that built based on grid method.
The idea is place buy or sell simultaneously when they are negative, wait and take the profit when the price is going back or passed the TakeProfit value. So this EA requires user adjustment setting itself between OrderLots with balance are used in the account. If you set TakeProfit value is negative, so this EA will waiting profit until price going back to the first price where order has been taken.
But the new order will be t
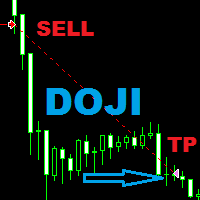
This expert uses suport and resistance in combination with ATR to place pending orders at those levels . For closing it uses Doji candle pattern or the closing at the end of the day . It is mainly built for the EUR/USD pair , M 15 Timeframe . Every position has Stop Loss and Take Profit , does not use grid , martingale or other dangerous trading methods . Test it with the Risk Percent parameter set to 4 and see what it can do. EUR/USD only - M 15 Timeframe .
MetaTrader 플랫폼 어플리케이션 스토어에서 MetaTrader 마켓에서 트레이딩 로봇을 구매하는 방법에 대해 알아 보십시오.
MQL5.community 결제 시스템은 페이팔, 은행 카드 및 인기 결제 시스템을 통한 거래를 지원합니다. 더 나은 고객 경험을 위해 구입하시기 전에 거래 로봇을 테스트하시는 것을 권장합니다.
트레이딩 기회를 놓치고 있어요:
- 무료 트레이딩 앱
- 복사용 8,000 이상의 시그널
- 금융 시장 개척을 위한 경제 뉴스
등록
로그인
계정이 없으시면, 가입하십시오
MQL5.com 웹사이트에 로그인을 하기 위해 쿠키를 허용하십시오.
브라우저에서 필요한 설정을 활성화하시지 않으면, 로그인할 수 없습니다.