MetaTrader 5용 Expert Advisor 및 지표 - 65

Introduction MT5 ships with the Envelopes indicator. This indicator allows you to create equidistant bands from a moving average by specifying a “deviation.” Unfortunately, the deviation is an arbitrary number. You might determine that 0.220 works well to contain 95% of close prices for USDCHF,H1, but when you change the period to H4, most of the bars are now outside the bands. So, I created this self-tuning indicator. Instead of specifying a percent “deviation,” you specify the percent of bars
FREE

SYMPHONY 8a is an advanced speculation system developed by 8aSistemas that uses intelligent input/output and management algorithms with sophisticated filtering methods.
There is nothing special here, no Holy Grail testing, just a strict rules-based trading approach, which allows you to maximize returns while keeping risks under control.
RECOMMENDED Currency Pairs: EURCAD
IT CAN DEVELOP IN ANY CURRENCY PAIR AS LONG AS IT IS OPTIMIZED IN EACH PAIR.
SYMPHONY OPERATES WHEN THE MARKET IS IN A
FREE

In the SM Trend Cloud indicator, two buffers are used for calculation and rendering. One of the main advantages of this tool is its simplicity, while its signals can be quite accurate. But, again, we have a trend indicator in front of us, and therefore it will generate false signals mainly in conditions of consolidation. At the same time, I do not advise using the indicator in its own form, there is no way to do without additional filters. As an additional signal, I suggest using ZigZag indicat
FREE
SaTo EA simple for free. 1. Double MA indicator for Entry signal 2. RSI for trend filter (Uptrend: RSI value greater than RSI level, Downtrend: RSI value less than RSI level ) 3. MACD for trend filter (Uptrend: MACD greater than signal , Downtrend: MACD less signal ) Buy signal : Fast MA greater than Slow MA, RSI value greater than RSI level, MACD greater than signal Sell signal : Fast MA less than Slow MA, RSI value less than RSI level, MACD less signal
FREE

There are thousands, if not millions, of strategies on the internet, but only less than 10% work and of those even less have stood the test of time. Very few strategies have successfully weathered the 2008-2009 financial crisis, 2020 covid effects on the markets and all other unforeseen events that have affected the market in the last 2 decades. That being said, the strategy I feature in this episode does just that, the epitome of stability as I’ll show in a 20 year back-test.
The source of th
FREE

"Driver Road Bands" indicator that is designed to be used in the 1H, 4H and 1D timeframes in the most ideal way. If we compare timeframes to roads and streets; main streets and highways with high traffic volume are similar to high-time timeframes in technical analysis. If you can interpret the curvilinear and linear lines drawn by this indicator on the graphic screen with your geometric perspective and develop your own buy and sell strategies; you may have the key to being a successful trader.
FREE

You can use this tool to create as many pending orders (limit order) as you want in one button press. All inputs must be in points. You can use this useful tool when such as FED speech times. User Inputs:
MagicNumber = Magic number DeviationPoint = Deviation point number for limit orders Level = You can choise how many level do you want to create pending orders. BuyOrder = true/false SellOrder = true/false StartDistance = Distance between each level. StepDistance = Distance to be added increment
FREE

Property of Vertical Capital Edition: Gugol_Quants About USA INDEXES QUANT_INDICATOR: This is a indicator created by math modulation to be used as a trading tool, which was developed in MQL. (MT5) This indicator is for use only with US500(S&P500), NAS100(Nasdaq Composite) and US30(Dow Jones). Signals are activated on "Open" Candle. It’s based on Intraday/Swing Trades whose main timeframe is H1, H2, H3 and H4. However you can use it with other assets by testing with the appropriate settings. *
FREE

FREE SafeGuard Trader EA - Professional Trend Following Strategy Created by EA Trading Academy team using Expert Advisor Studio , this free trading robot implements a professional trend-following strategy with built-in safety features to protect your account. You can find a detailed documentation about the properties and inputs on our knowledge base . Key Strategy Features: Combines ADX and Bulls Power indicators for precise entry signals Advanced exit strategy based on price action analys
FREE

SterlingSniperBot is an advanced trading algorithm meticulously designed for the GBP/USD currency pair, specifically tailored to operate on 4-hour bars and synchronize seamlessly with brokers in the UTC+2 time zone. This sophisticated bot stands out as a precision instrument in the world of forex trading. Key Features: Timeframe Optimization: Operating exclusively on 4-hour bars, SterlingSniperBot focuses on capturing strategic trading opportunities within this specific time frame, aligning with
FREE

INTRODUCING G-SPIKES ASISTANT — Your ultimate trading assistant designed to simplify and enhance your trading experience. Developed by Kwaku Bondzie Ghartey, This powerful tool provides intuitive controls and automation to execute trades efficiently and manage risk effectively. Whether you are a beginner or a professional trader, this tool is crafted to adapt to your trading needs. Support: Regular updates and support from the developer, Machofxgh, with easy access to the community via Tel

FREE

HiperCube VIX에 오신 것을 환영합니다. 다윈엑스 제로 25% 할인 코드: DWZ2328770MGM 이 지표는 sp500/us500의 시장 거래량에 대한 실제 정보를 제공합니다.
정의 CBOE 변동성 지수로 알려진 HiperCube VIX는 널리 알려진 시장 공포 또는 스트레스 측정 지표입니다. S&P 500 지수를 광범위한 시장의 대리 지표로 사용하여 주식 시장의 불확실성과 변동성 수준을 나타냅니다. VIX 지수는 S&P 500 지수의 옵션 계약 가격을 기준으로 계산됩니다.
특징: 사용자 정의 색상 사용자 정의 차트 색상 주요 그래프를 명확하게 유지하기 위한 하위 창에 표시기 표시 해석하기 쉬움 완전한 사용자 정의 Chat gpt와 AI를 사용하여 개발되었습니다.
사용 예: VIX는 실제 시장에 대한 우수한 정보를 제공하는 볼륨 표시기이며, 이 표시기의 높은 값은 높은 변동성을 의미합니다. 높은 변동성은 시장 움직임에 접근하고 시장에 빠르게 진입하고 종료하기에 좋은
FREE

Exploring market limits and seizing every opportunity is the essence of the ZenithNadir Blueprint strategy. The ZenithNadir Blueprint, a unique trading strategy, is designed for those brave investors who seek opportunities at the market's nadir and decisively pull back at its zenith. Inspired by the classic Martingale doubling strategy, it aims to maximize investment returns through a meticulously planned entry and exit mechanism.
However, like all lofty dreams that require a solid foundation,
FREE

MetaTrader 5 (MT5)용 Wormhole 시간대 지표는 단순한 거래 도구가 아닙니다. 그것은 금융 시장에서의 경쟁 우위입니다. 초보자와 전문가 모두를 염두에 두고 설계된 Wormhole은 데이터 분석과 의사결정 방식을 변화시켜 항상 한 걸음 앞서 나갈 수 있도록 도와줍니다. 왜 Wormhole 지표(무료)가 필요한가 경쟁자를 능가하십시오: 동일한 차트에서 두 가지 시간대를 동시에 볼 수 있다는 것은 항상 한 걸음 앞설 수 있다는 것을 의미합니다. 차트 간 전환을 더 이상 할 필요 없이 모든 필요한 정보가 바로 눈앞에 있습니다. 숨겨진 기회를 발견하십시오: 전통적인 시간대를 변형하고 다른 거래자들이 놓친 패턴을 발견하십시오. 5분 차트의 범위를 00:01에서 00:06으로 변경하여 00:00에서 00:05까지의 표준 시간 대신 분석할 수 있습니다. 이러한 미세한 변화는 독특한 시장 동향을 드러낼 수 있습니다. 실행 가능한 통찰을 얻으십시오: 트렌드, 반전 및 지지/저항 수준
FREE

Volume pressure and oscillator overbougth - oversold condition togedther. Signals appears on chart. Turnig points, trading ranges, support- resistance levels also. Change parameters in the trendscalp settings. TTF bars can be set: 8, or, 15, or 45, 150. Greather periods are very useful at strong support - resistance areas. IF ONE OF OUR FREE INDICATOR IS NICE TO YOU, FEEL FREE TO BUY AT LEAST OUR CHIEPST PRODUCT TO DONATE US. "Lots of small peace can be a mountain" ( nathan rothschild, john len

This indicator allows to know the remaining time before the closing of the candle. It works on every timeframe. It is very usefull when your trading strategy depend of the close or the open of a specific candle. So use it like you want. Don't forget to leave a comment or a request for a EA or an indicator. Also spread it to your friends and don't hesitate to visit my profile to see others tools.
FREE

To get access to MT4 version please click here . This is the exact conversion from TradingView: "Candle body size" by "Syamay". This is a light-load processing indicator. This is a non-repaint indicator. Buffers are available for processing in EAs. All input fields are available. You can message in private chat for further changes you need. Thanks for downloading
FREE
The Percentage Average True Range (ATR) indicator measures market volatility by calculating the ATR of a selected asset and expressing it in one of three customizable formats: Percentage (%) relative to the current price, enabling easy comparison across assets with different price ranges. Basis Points (bps) , where 1 bps equals 0.01%. Real ATR values , representing the raw ATR in price terms. By normalizing ATR values using percentage or basis points, this indicator allows for direct comparison
FREE
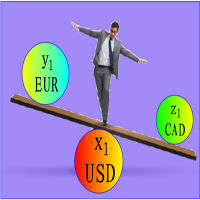
1. The principle of ImbalanceEurUsdCad3 intelligent trading system: The three currency hedge unbalanced arbitrage is the extension and continuation of the triangle arbitrage. As a common arbitrage method, triangle arbitrage has been used by many investors in foreign exchange trading. Triangle arbitrage is based on cross exchange rates, which is the basis of triangle arbitrage. The so-called cross exchange rate refers to the price of a non-US dollar currency expressed by another non-US dollar c
FREE

1. The Expert Adviser is built with a basic, simple and stable trading strategy with a touch of Price Action Principle that is highly effective and accurate for a sniper entry system. The EA have a good money management System.. 2. The expert advisor works best as from 5minutes time frame and above, The higher the time frame, the more accurate is the signal.... 3. The expert advisor work with all broker all currency pair and synthetic indices... 4. Use a reasonable lot size and correct settings
FREE

Trade Sentiment or trade assistant is a MT5 Indicatior. That show buy or sell signal of different indicator to assist to take trades. That will help you to take right trades or to get confirmation for your trade. You don't need to have this indicators. Including indicators like RSI , STOCH , CCI. And the signals are Based on different Timeframes like 5M , 15H , 1H and 4H.
FREE

Price and Spread Indicator
Version: 1.0 Developer: Creative Tech Solutions Website: https://www.creativetechsolutions.co.uk
Overview The Price and Spread Indicator is a great tool for MetaTrader 5 that displays the Ask and Bid prices along with the spread directly on the chart. This indicator provides real-time updates and allows traders to make informed decisions based on accurate price information.
Features - Real-time Price Updates: Continuously updates Ask and Bid prices. - Spread Disp
FREE

GenMA MTF
The signal indicator WITHOUT REDRAWING gives recommendations on the direction of trading.
When the price moves through the internal channel, it gives signals (red and blue arrows) that recommend a possible change in the direction of the price movement up or down.
When the price crosses the external channel, it gives signals (yellow arrows), warning that a strong price movement is possible, which will not immediately change the direction of trading.
When the price crosses the avera
FREE
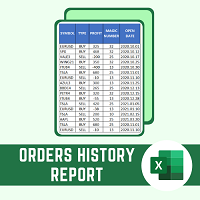
This script will create a report with all history orders in CSV format. The report is useful for those who run multiple EA's with different magic numbers in the same account. You can define some filters to generate your orders history report: 1) Initial date for assets in orders history. 2) Final date for assets in orders history. 3) Asset name. 4) Orders magic number. 5) Add balance/costs.
QUESTIONS ABOUT THE INSTALLATION OF PRODUCTS AT META TRADER You can also find some instructions on how
FREE

1. The principle of AsymmetryEurUsdJpy1 intelligent trading system: The asymmetrical non-balanced arbitrage in three-currency hedging is an extension and continuation of the triangular arbitrage. Triangular arbitrage is a relatively common arbitrage method that many investors have used in foreign exchange trading. Triangular arbitrage is based on the cross exchange rate, which is the basis of triangular arbitrage. The so-called cross exchange rate refers to the price of one non-US dollar curren
FREE

If you love this indicator, please leave a positive rating and comment, it will be a source of motivation to help me create more products <3 Key Takeaways Bulls Bears Eyes is another version of Laguerre RSI. Use Bull/Bear Power to calculate. One use of the Bulls Bears Eyes is to identify trends. This is done by looking for sustained periods when the indicator is above or below the 0.5 line. Also, a buy signal is generated when the Bulls Bears Eyes line crosses above the 0.15 level, while a s
FREE

Defining Range ( DR ) and Implied Defining Range ( IDR ) indicator Pro with added features from free version
Show DR and IDR ranges Sessions on the chart for RDR Regular defining range (New York Session)
ADR After defining range (Asian session) ODR Outside defining range (London Session)
Buttons on chart to enable / disable :
Show Imbalance ( IMB ) Show Volume Imbalance ( VIB ) Show Gap's between open and close
Show Standard Deviation ( SD )
Show last 3 Sessions or Back

Switch symbols and timeframe by arrow buttons 1. You can switch multiple symbols of one or all charts. 2. You can set list of symbols to switch between them or get them from Market Watch. 3. You can change timeframe of one or all charts. List of timeframes here [M1, M5, M15, M30, H1, H4, D1, W1, MN1]. Switch symbol of all charts: indicator check current symbol of the chart to get index of it in list and change for next or previous. Key functions: - Right arrow key: switch to next symbol. - Left
FREE
1. The principle of UnbalanceEurUsdAud2 intelligent trading system: The three currency hedge unbalanced arbitrage is the extension and continuation of the triangle arbitrage. As a common arbitrage method, triangle arbitrage has been used by many investors in foreign exchange trading. Triangle arbitrage is based on cross exchange rates, which is the basis of triangle arbitrage. The so-called cross exchange rate refers to the price of a non-US dollar currency expressed by another non-US dollar c
FREE

An easy indicator that simply shows the moment we connect to the market. We can easily see what has happened while we were gone because the line has two different colors that show the start time. It is only that, a visualization aid that allow us to mark the market behavior while it was night time in our country, or if we have stopped several hours. Input: Server start working date: Day of month Month Year Hour Minutes
FREE

An Fast Bucks MT5 Expert Advisor combines the power of indicators and moving averages to create a robust trading strategy within the MetaTrader 5 platform. This expert advisor utilizes the Moving Average indicator in conjunction with a custom indicator (let's call it "CustomIndicator Expert Advisor") for enhanced decision-making in trading.
The Moving Average indicator serves as a foundational tool, offering insights into the market trend and potential entry/exit points based on the moving ave
FREE

Double Line Donchian Channel MT5/Meta Trader 5 Indicator, this is customized Indicator to show only 2 Lines of Highest and Lowest PRICE line where you can add a MA (MOVING AVERAGE) for center line. What is Donchian Channel?
Donchian Channels are three lines generated by moving average calculations that comprise an indicator formed by upper and lower bands around a midrange or median band. The upper band marks the highest price of a security over N periods while the lower band marks the lowest p
FREE

Stat Monitor is a good information indicator.
Benefits of the indicator: The indicator provides useful information - the current spread, the cost of one lot of the symbol, trading leverage and the recommended lot size for trading. You can use the indicator on the MetaTrader 5 trading platform of any broker. The indicator provides useful information.
Version of the Stat Monitor indicator for MetaTrader 4 I wish you all good luck in trading and stable profit!
FREE

RSI Scanner, Multiple Symbols and Timeframes, Graphical User Interface An indicator that scans multiple symbols added from the market watch and timeframes and displays result in a graphical panel. Features: Multi symbol Multi timeframe Alerts and Notifications Live Monitoring Sorting modes One click to change symbol and timeframe Inputs for RSI and scanner settings
FREE
S imple arrow with alert on chart. This is NOT an entry indicator but a direction indicator. It uses MACD signal line to show you possible future direction of a trend. Please use it with other filters or confirmations to trade properly. Recommended for scalping and short term trades. Made for EURUSD M5 but it should work on every major pair on M5 timeframe. For MT4 version please go here! *If you need fully automated trading system. Please check this EA here! FEATURES: Very simple directional i
FREE

This expert advisor (EA) leverages a sophisticated Bias(ICT) detection strategy, ensuring that your trades align with the prevailing market direction. Whether you're looking to capture trend continuation or anticipate market reversals, this bot provides the tools you need to trade with confidence.
Transparent Testing: We have performed fully transparent testing on symbols such as US30, ETHUSD, and XAUUSD(GOLD) in the strategy tester. These results give you a clear view of our bot's performance
FREE

This indicator can help you clearly identify trend changes in both bullish and bearish markets. The indicator compares the closing price of the last candle with the closing price of the candle "X" periods ago (input parameter). In an uptrend, an initial number '1' is plotted if a candle closes higher than the closing of a candle "X" periods ago. In a downtrend, an initial number '1' is plotted if a candle closes below the closing of a candle "X" periods ago. Subsequent numbers are plotted when e
FREE

Algo Edge EA -DE40/ Tec100 EA working with high and low from last Candle. Self learning EA just set the EA on the Chart and Start no Settings optimization.
AUD/USD, EUR/USD, DE40, US30, Tec100 and much more. Multifunctional Expert Advisor can trade with every Forex Pair or Indize. EA can Trade with every Broker. M1 high, M30 medium, H1 low Risk. Functions: For other Indize example US30: Change the Robot Worktime in Europe to 16:30-21:30
-inp1_ =Robot Worktime inp_2 and inp_4 VolumePercent =
FREE

Pairs Navigator is a simple and easy-to-use tool that allows you to view all of your charts in a single window. This eliminates the need to open multiple charts from the Market Watch window, saving you time and effort. Pairs Navigator is also very lightweight, so it will not put a strain on your RAM or cause your MT4/5 platform to hang. To use Pairs Navigator, simply drag and drop the currency pairs you want to view into the Pairs Navigator window. You can then easily switch between charts by
FREE

Multi-timeframe trend indicator, based on the ADX / ADXWilder indicator The indicator shows trend areas using ADX or ADXWilder indicator data from multiple timeframes. The impulse mode of the indicator allows you to catch the beginning of a trend, and several "Screens" with different timeframes allow you to filter out market noise.
How the indicator works: if PDI is greater than NDI, then it`s bullish movement; if PDI is less than NDI, then it`s bearish movement; to determine any trend, it is
FREE

The ICT Unicorn Model indicator highlights the presence of "unicorn" patterns on the user's chart which is derived from the lectures of "The Inner Circle Trader" (ICT) .
Detected patterns are followed by targets with a distance controlled by the user.
USAGE (image 2) At its core, the ICT Unicorn Model relies on two popular concepts, Fair Value Gaps and Breaker Blocks. This combination highlights a future area of support/resistance.
A Bullish Unicorn Pattern consists out of:

ATR is a measure of volatility introduced by market technician J. Welles Wilder Jr. in his book, "New Concepts in Technical Trading Systems". In general, traders are accustomed to seeing the ATR in the form of a sub-window indicator. What I am presenting here is a simplified version of ATR - just the current ATR number - very useful for monitoring just the very moment of the current chart. If you want to monitor several timeframes in the same chart, just add the ATR Monitor indicator several tim
FREE

Looking for a more effective way to identify support, resistance, and evaluate trends? Moving Average Band transforms the moving average into a band that dynamically adjusts to market volatility, offering a more realistic view of price movements. What is it? ️ Moving Average Band is a tool that represents the moving average as a dynamic band. ️ It automatically adjusts the width of the band based on market volatility. What does it provide me? ️ A more realistic view: By incorporating volatili
FREE

Multi Diver EA trades symbols from Marketwatch . The strategy is based on the daily ranges and also on the RSI indicator. Risk management as well as breakeven and trailing stop accompany your positions and protect you from larger losses! You can use an indicator filter to weed out unwanted symbols. EA has been tested in EURUSD, USDCAD, USDJPY, XAUUSD and US30 H1 in the strategy tester and defaulted to these symbols. Please suggest your ideas in discussion. I will implement this as quickly as pos
FREE

Algo Trader Exposure Chart Exposure Chart - MetaTrader 5에서 시장 익스포저 시각적 모니터링 Exposure Chart 는 트레이더가 MetaTrader 5 차트에서 실시간으로 랏 분포와 리스크 익스포저를 시각적으로 확인할 수 있는 필수 도구입니다. 동적 원형 차트 를 통해 각 거래 자산을 추적할 수 있어, 포트폴리오 분산 관리가 쉬워지고 자산 배분 전략을 빠르게 조정할 수 있습니다. 주요 기능 시각적이며 사용자 맞춤 설정이 가능한 패널 각 자산별 거래된 랏 비율을 보여주는 인터랙티브 원형 차트 표시. 거래가 개시되거나 종료됨에 따라 실시간 자동 업데이트 . 사용자 맞춤 설정이 가능한 인터페이스 , 색상 및 차트 크기 조정 가능, MetaTrader 5 레이아웃에 최적화 가능. 익스포저 모니터링 포트폴리오 내 자산 분포를 명확하고 직관적으로 추적. 특정 자산에 대한 과도한 집중을 감지하여 리스크 관리 지원. Forex, 주식, 지수, 암호
FREE

https://www.mql5.com/en/signals/2252642 ----------------------------------------------------------------------------- V3.51:
SymbolsToTrade: USDJPY,AUDCAD,EURJPY,AUDJPY,NZDCAD TimeFramesToTrade: 120 2016 - -----------------------------------------------------------------------------------------
선택한 한 쌍과 시간대에서 기본 설정으로 시작하세요. 중요하지 않습니다. Expert는 모든 필요한 쌍과 시간대를 어디서나 자동으로 거래합니다. 2016년부터 전략 테스터, 백테스트, 포워드 테스트(2019.01.01+)에서 지속적으로 수익성이 있었으며 결과는 동일합니다.
입력 매개변수: FixedLots(RiskPercent = 0인 경우 사용)
FREE

이 무료 도구가 마음에 드신다면 별 5개 등급을 남겨주세요! 매우 감사합니다 :) "위험 관리 보조원" 전문가 자문 컬렉션은 다양한 시장 상황에서 위험을 효과적으로 관리함으로써 거래 전략을 향상시키도록 설계된 포괄적인 도구 모음입니다. 이 컬렉션은 평균화, 전환 및 헤징 전문 자문의 세 가지 주요 구성 요소로 구성되며 각각은 다양한 거래 시나리오에 맞는 뚜렷한 이점을 제공합니다.
이 EA는 시장의 표준 위험 관리 전략을 개발한 것입니다.
https://www.mql5.com/en/blogs/post/756961
1. "평균화 도우미" EA: MT4 : https://www.mql5.com/en/market/product/115468 MT5 : https://www.mql5.com/en/market/product/115469 2. "스위칭 어시스턴트" EA : MT4 : https://www.mql5.com/en/market/product/115478 MT5 : https://
FREE

Position Management EA Light (FREE) The Position Management EA Light is a simplified and user-friendly Expert Advisor (EA) designed to automate basic trade management functions effectively on MetaTrader 5. This free version is perfect for traders who want automated market or stop order execution with straightforward risk management features. Main Features: Order Types Supported: Market Orders (Buy & Sell) Stop Orders (Buy Stop & Sell Stop) Static Stop Loss & Take Profit: Predefined SL and TP val
FREE

불리쉬 스캘퍼 EA – 똑똑한 알고리즘 트레이딩의 세계로 오세요! 불리쉬 스캘퍼 EA 는 외환, 지수, 주식 에서 여러분의 트레이딩을 신나게 도와줄 슈퍼 트레이딩 솔루션입니다! 스마트한 포지션 관리와 트레일링 스톱 기술로 다양한 시장에서 여러분의 거래를 더욱 즐겁게 최적화해 드립니다. 멋지지 않나요? 초강력 특징들 (여러분이 좋아할 만한!): 자동 거래 실행 – 정확하게 트레이딩 기회를 찾아내는 마법 같은 능력! 첨단 트레일링 스톱 – 위험 관리를 위해 손절매를 춤추듯 동적으로 조정해요~ 멀티 시장 호환성 – 외환, 지수, 주식 어디서든 함께 놀아요! 맞춤형 파라미터 – 시장 상황에 따라 설정을 여러분 마음대로 꾸며보세요 MQL5 지원 & 문서 – 도움이 필요하면 MQL5 메시징으로 언제든 수다 떨어요! 권장 설정 (친구처럼 알려드려요!): 외환 (EUR/USD) 랏 크기 : 0.01 (작게 시작해서 안전하게~)
The EA uses scalping strategy at night, trading consists of three algorithms and each algorithm works in its own time interval. The EA uses many smart filters to adapt to almost any economic situation. Pending orders are used for the least slippage when trading scalping. The adviser is safe and does not require any settings from the user, just install it on the chart and you are ready. The EA sets a protective stop order, so the trader does not have to worry that the robot will allow significant

Live Monitoring: https://www.mql5.com/en/signals/2252642 Quant ML US30 is a bot designed for Dow Jones index-related instruments, operating on the H1 timeframe. It supports: .US30Cash CFD YMMxx, YMUxx futures Any instrument with an underlying Dow Jones Industrial Average index (exact names may vary by broker). This bot is generated and validated by machine learning algorithms, focusing on strategy stability. It: Uses only market entries with fixed ATR-based SL and TP levels. Does not use tr
FREE

MA Alert Indicator
You do not need anymore to constantly and tediously look at the chart . If your strategy uses any type of moving average with any settings, just add this indicator to the chart according to your required settings
You will be notified whenever the price hits your MA , whether touch or candle close by crossing it. Also, an arrow symbol will be displayed on the chart based on movement.
If you d o not have access to your computer, just set your MetaTrader notification by the

This is the first EA built using the free and open source library AlgoTradingHub that i develop and mantain. The library aims to simplify and streamline the development of Expert Advisors (EAs) for MetaTrader 5 (MT5) using the MQL5 programming language. By providing reusable components, developers can quickly create highly customized and maintainable trading strategies, reducing the complexity of building EAs from scratch. It can be found on my GitHub profile at: GiacomoGhi/AlgoTradingHub
FREE

NOW FREE!!
Introducing RichRush EA, This expert advisor, armed with cutting-edge trading strategies, can assist on your path to navigating the forex market. Optimized specifically for EURUSD, RichRush EA operates on moving averages, and calculated lot sizes to manage risks. The EA interprets market movements, adjusts to volatility, and aims to identify entry points. As part of our commitment to providing top-tier trading tools, we invite you to explore our range of premium products designed to
FREE

O Afastamento da Média Móvel, é uma poderosa ferramenta de análise técnica projetada para fornecer uma representação visual do afastamento entre o preço atual e uma média móvel específica. Este indicador, desenvolvido para o MetaTrader, oferece aos traders uma perspectiva clara das mudanças na dinâmica de preço em relação à tendência de médio prazo.
Versão MT4: https://www.mql5.com/pt/market/product/111705
FREE

This software uses classical rules to the entry and exiting of the trades when trading using the ichimoku style. The EA trades in the current timeframe on the charts. According to testing results yielded more than $1k using the 1hr chart in the past year. The EA should not be expected to perform well when the price is ranging and too volatile. The best results should be achieved when the EA is turned on in the trending market only and under a solid money management plan. The results shown on the
FREE

The concept is simple: Plotting Price behavior within several periods of time. Some Symbols behave very well during the trading day - with this I mean Intraday trading - and this behavior ends up plotting effectively well with the proposed Exponential Moving Averages in this indicator... Obviously that this behavior could not be seen in all Symbols, but you can give it a try... Just drop this indicator in a chart and you will see for yourself...
This indicator is intended for "Feeling the Trend"
FREE

The Indicator indicator draws 2 clouds based on Donchian Channels indicator values. The upper cloud is formed by the upper lines values and the lower cloud by the lowers lines values. The indicator allows to change the Channels parameters and the clouds colors the period of the base line and the multiplier of each Donchian Channels instance. The indicator holds 5 buffer index as follow: [0] - Outer values of the upper cloud [1] - Inner values of the upper cloud [2] - Base/Center line values [3
FREE

DailyBox2 is an advanced automated trading system designed based on trend-following and hedging strategies. This EA executes up to two trades per day and utilizes a smart recovery feature to minimize losses and maximize profits. Its risk management feature ensures safe trading by aligning with the user’s specified risk levels. When used in conjunction with IAMFX-Agent , it can achieve both risk management and profit maximization. Additionally, when used alongside our BandPulse , it can lead to
FREE

Advanced Volume Flow Indicator A professional volume analysis tool that helps traders identify potential market reversals and trend confirmations through advanced volume flow calculations and smart filtering algorithms. Main Features Advanced volume analysis with precision filtering Real-time trade signals with price levels Smart alert system for automated trade detection Clear visual representation with color-coded volume bars Multi-timeframe optimization Professional-grade calculat
FREE
The version of Kali IndicOptimizer for Metatrader 5. This tool is not only an Expert Advisor, it is used to optimize your indicators, to design your own Expert Advisor, to analyze the buffers of your indicators without having access to the source code. I searched for quite some time how I could optimize my indicators without having to program or modify an expert each time. With this tool, anyone can get started in strategy design or even have their own personalized Expert Advisor. It can optimi
FREE

Live Signal - My trading portfolio using two EAs on different symbols: https://www.mql5.com/en/signals/2283067 For installation assistance and customization, contact us directly after purchase.
Overview
UltraX Scalping Master MT5 is an forex EA scalper designed for XAUUSD, GBPUSD, USDJPY, AUDUSD (and more). Developed by seasoned traders with over 8 years of expertise, this EA redefines automated trading with precision, profitability, and unparalleled risk control. No Repaint
No Hedge
No Gri

This Expert Advisor is designed for news trading. This version is the free version for MT5. The amount of news to handle is limited to 5 news in USDPY (0.01 Lot). Please find below the other versions of this expert (The Pro versions have not limitations) : News Advisor MT5 Pro. News Advisor MT4 Pro. News Advisor MT4 Free. The main advantage of this expert is that it’s offering backtesting capabilities (something that is not found in most news expert advisors). This ability gives you the opportun
FREE
Heikin Ashi candlesticks smooth out the price data to help traders spot trends and patterns in the market. By averaging the price values, these candlesticks provide a clearer visual representation, making it easier to identify trends and predict future movements without the noise of standard candlesticks. We at Minions Labs are revisiting this topic because of our fellow Swing Traders, who love Heikin Ashi.
WHY SHOULD I CARE about the Smart Heikin Ashi? The Smart Heikin Ashi is an innovative to
DESCRIPTION 3 Bar Break is based on one of Linda Bradford Raschke's trading methods that I have noticed is good at spotting potential future price volatility. It looks for when the previous bar's High is less than the 3rd bar's High as well as the previous bar's Low to be higher than the 3rd bar's Low. It then predicts the market might breakout to new levels within 2-3 of the next coming bars. Must also be traded during the active hours of the market you want to trade. EG EURUSD 7am - 5pm This
FREE

The SpreadTracer and TimeLeft indicator is a powerful yet straightforward tool designed for traders who want to keep a close eye on market conditions directly on their chart. This custom indicator provides essential real-time information about the spread and candle time, making it easier to make informed trading decisions. Key Features: Current Spread Monitoring : The indicator constantly displays the current spread of the trading pair, helping you assess the cost of entering or exiting a positi
FREE

This indicator displays fractal symbols and bars Use this indicator to show different symbols for bearish and bullish fractals: Choose from 144 symbols (refer to table below) Colors, size and offset of fractals can be modified Fractal price bar or candle color can be changed Hide fractals and show fractal price bar only Frequency in fractal calculation can be changed
How to use 1. Select which symbols to use for bearish and bullish fractals; 2. Select which colors to use for bearish and bullis
FREE

This indicator looks for 3 rather strong patterns: Spinning Top pattern Hammer or Hanging Man Inverted Hammer or Shooting Star These patterns may indicate a trend continuation or its reversal, depending on the location of the patterns.
Input parameters Distance - distance between the signal and the formed signal Note: the higher the timeframe, the greater the value should be used in Distance to display the signal correctly
Indicator Features Suitable for any currency pair Operating timeframe:
FREE

DETECT THE TREND AND THE BEST PRICE TO ENTER A TRADE
Trend Detection for perfect entry - Distinguish the direction of thetrend and its strength, showing a line of different colors depending on whether the trend is strong bullish, weak bullish, strong bearish or weak bearish.- Best Entry point for perfect entry - Shows an area with the best entry in favor of trend. Never trade against the trend again.
Entry signals and alerts - When the price is in a valid zone, it sends pop up alerts, telephon
MetaTrader 플랫폼 어플리케이션 스토어에서 MetaTrader 마켓에서 트레이딩 로봇을 구매하는 방법에 대해 알아 보십시오.
MQL5.community 결제 시스템은 페이팔, 은행 카드 및 인기 결제 시스템을 통한 거래를 지원합니다. 더 나은 고객 경험을 위해 구입하시기 전에 거래 로봇을 테스트하시는 것을 권장합니다.
트레이딩 기회를 놓치고 있어요:
- 무료 트레이딩 앱
- 복사용 8,000 이상의 시그널
- 금융 시장 개척을 위한 경제 뉴스
등록
로그인
계정이 없으시면, 가입하십시오
MQL5.com 웹사이트에 로그인을 하기 위해 쿠키를 허용하십시오.
브라우저에서 필요한 설정을 활성화하시지 않으면, 로그인할 수 없습니다.