MetaTrader 5용 Expert Advisor 및 지표 - 47
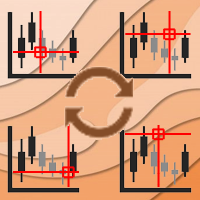
Async Charts is an indicator to synchronize charts and display a customized crosshair (cursor) on all selected charts. This is a useful utility for traders using multiple timeframes of analyzing multiple symbols for trade entry or exit.
Main Features : Real time Crosshair Synchronization on All Selected Charts
Supports Multiple Timeframes and Multiple Symbols at the same time
Auto Scroll Option
Graphical Adjustment of Color, Font, Size, ...
Locking All or Locking Specific Charts
More and

Welcome to Investment Castle products This product is exclusively available in the MQL5 market and is not available and will not be available anywehere else. The Combined indicator is a multi-time frame indicator and it is built using 3 indicators: Bands indicator which draws the support and resistance key levels using up to 5 different time frames Patterns indicator which draws the chart patterns using up to 6 different time frames Spots indicator which shows the common candlestick patterns Yo

RsiGridEA ist ein vollautomatischer Handelsroboter (Expert Advisor) für den MT5.
Er handelt 24/5 ohne Nachrichtenfilter, er ist einfach einzurichten und funktioniert mit den meisten MT5 Forex Brokern.
Plattform: Metatrader 5 Währungspaare: Alle Währungspaare auch Indices Zeitrahmen: H1 Zeitrahmen und Alle anderen. Stunden: rund um die Uhr DD : bis zu 50% Einzahlung: ab 100 Euro für Lot 0,01 Strategie: RSI Grid - Strategie
Das System: Hauptsignal Rsi 70/30 Strategie Variable

The double top bottom pattern is arguably one of the technical analysis's most popular chart patterns. These patterns are used to capitalize on recurring patterns and identify trend reversal patterns, thereby creating well-placed entry and exit levels. The KT Double Top Bottom is based on these patterns and fine-tunes the trade signal development process for traders.
Features
It's based on one of the most reliable trading patterns and brings some fine-tuning and automation to the process. A

The Didi Index is an indicator that helps in the identification of the so called “Didi Needles” (Agulhada do Didi), a method created by the experienced Brazilian trader Odir Aguiar (Didi).
DIDI NEEDLES EXPLAINED
The concept of the needles is simple: 3 moving averages are added to the chart (by default 3, 8 and 20 periods, simple mode), and whenever all 3 averages pass simultaneously inside the real body of a candle, the needling occurs. It was named after the movement of passing a thread th

KT OBV Divergence shows the regular and hidden divergences build between the price and OBV - On Balance Volume oscillator.
Features
Unsymmetrical divergences are discarded for better accuracy and lesser clutter. Support trading strategies for trend reversal and trend continuation. Fully compatible and ready to embed in an Expert Advisor. Can be used for entries as well as for exits. All Metatrader alerts are available.
What is a Divergence exactly?
In the context of technical analysis, i

The utility places trailing stop, breakeven, stop loss and take profit. It is necessary to allow automated trading in the terminal settings. In testing mode, the utility opens Buy or Sell positions on the first ticks, which allows you to visually observe the given logic, changing the utility parameters. In real mode, the utility does not open positions. Parameters magic - magic number. If less than 0, positions with any magic number are tracked. only_this_symbol - only chart symbol. If fals

Thank you for checking out One Man Army Pro
USE THE DEMO FEATURE - Start with $10000 with 0.02 lots on any pair and any time frame and watch the profit come in.
**PAIRS** Look for ranging pairs Such as USD Pairs **Timeframe** 15 m (Recommended) **Lots** 0.05 for every $ 1000 in your account
**LIVE SIGNAL COMING SOON**
Come trade with us: https://discord.gg/KrZ8rqWEJ5
Variables: (See Screenshots for a recommended settings) Mode_Of_Strategy: Use only Strategy_4 – This is th

The GGP SuperTrend MT5 Indicator is a technical analysis tool that can assist investors in identifying market trends. The indicator is based on ATR and is very useful for capturing the direction of an asset’s momentum and is widely employed when looking at stocks, currencies, and commodities. It plots a line on the price chart, which acts as a dynamic level of support or resistance, helping traders and investors make informed decisions about entry and exit points. This indicator is MT5 conversi

This indicator is used to identify key levels where the trend in price has a greater probability of halting and possibly changing direction. Interpretation of the degree of significance of a level depends on a trader's time frame. It is great to see how the prices respect each level of this support and resistance. This Indicator works for me very well. If you have good knowledge of Price Action then you can make profitable trades with this indicator. If candle take support or resistance on any o
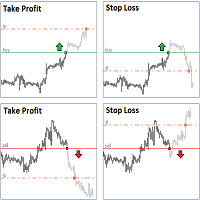
StopLoss and TakeProfit Utility MT5 for automatic setting of stop loss and take profit levels. Created by a professional trader for traders. The utility works with any market orders opened by a trader manually or using advisors. Can filter trades by magic number. The utility can work with any number of orders simultaneously.
WHAT THE UTILITY CAN DO: Set virtual stop loss and take profit from 1 pip Real stop loss and take profit W ork with each order separately ( stop loss and take pr

Trend Scanner is a trend indicator that helps to determine the current and forecast market direction using an advanced algorithm. Thanks to flexible alert settings, the indicator will promptly warn you about a trend reversal. The indicator is intuitive and easy to use, and will be an excellent filter in your trending trading strategies. The lines of this indicator are also an excellent dynamic level for stop loss, and is used as one of the types of trailing stop in Trading Panel . To fine-tune t
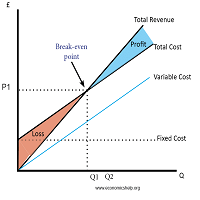
Breakeven Utility MT5 automatically setting breakeven levels, transfers trades to breakeven when passing a given distance . Allows you to minimize risks. Created by a professional trader for traders. Utility works with any market orders opened manually by a trader or using advisors. Can filter trades by magic number. The utility can work with any number of orders simultaneously.
WHAT THE UTILITY CAN DO: Install virtulnoe levels bezubytka from 1 pip I nstall real levels o
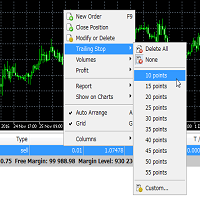
Trailing Stop Utility MT5 for automatic closing of deals by trailing stop levels. Allows you to take the maximum from the profit. Created by a professional trader for traders. Utility works with any market orders opened manually by a trader or using advisors. Can filter trades by magic number. The utility can work with any number of orders simultaneously.
WHAT THE UTILITY CAN DO: Set virtual trailing stop levels from 1 pip Set real trailing stop levels W ork with each order separ
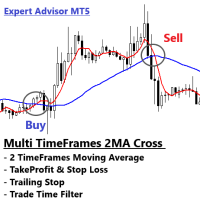
Multi Timeframes of 2 Moving Averages Cross Timeframes 1 = Executor Position (MA1 Cross MA2 from bottom = buy, MA1 Cross MA2 from Upper = sell) Timeframes 2 = Trend Detector (MA1 > MA2 = Uptrend, MA1 < MA2 = Downtrend)
How it works If MA1 > MA2 in Timeframes 2, then MA1 Cross MA2 from bottom in Timeframes 1, output = Buy If MA1 < MA2 in Timeframes 2, then MA1 Cross MA2 from Upper in Timeframes 1, output = Sell
Expert Advisor Features - Fixed Lot - Stop Loss and TakeProfit - Trailing Stop -

MacdGridEA is a fully automated trading robot (Expert Advisor) for the MT5.
Plattform: Metatrader 5 Currency Pairs: All Currency Pairs Timeframe: H1 TimeFrame. Hour: A round the clock Leverage: 1:400 DD : until 50% Deposit: from 500 Euro for lot 0.01 Strategy: Macd Grid - Strategy
The System: Main signal Macd Retail size individually adjustable. AutoLot switched ON/OFF Money and Risk Moneymanagment Indicator individually adjustable. Time & Weekend filter

Introducing the revolutionary ICT Silver Bullet Strategy Indicator for MT5, a groundbreaking tool designed to usher in a new era of trading for beginners and experienced traders alike. This advanced indicator seamlessly translates the intricate ICT Silver Bullet strategy into a simplified visual representation on your charts, offering not just comprehension but a path to profitable trading. A Strategy Simplified: Navigating the complexities of the ICT Silver Bullet strategy has never been easie

OPTMIZE EA BEFORE BACKTEST AND USE. YOU MUST UNDERSTAND THIS BEFORE PURCHASE FTMO Minute Master is a trading Expert Advisor made for the FTMO Intraday Prop Trading program. This EA operates exclusively on XAU/USD 1-minute charts, leveraging lightning-fast algorithmic strategies to identify and execute precise entry and exit points in the world of intraday trading. Its primary goal is to optimize risk management while seeking consistent profits in the dynamic intraday market environment. FTMO Mi

This indicator uses the chart information and your inputs to display the lot size and associated stop for long or short positions. It uses an ATR based percent volatility position sizing calculation. You can use this indicator to learn more about a better position size calculation than a fixed lot system. The indicator adds text directly to the chart to show you the current position size calculation, the risk % input, the ATR Range input, the ATR value from the prior bar, the account equity at r
FREE
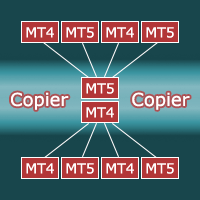
Copier for the MetaTrader5 terminal. Designed to copy trade from one terminal to another. Works both on netting and hedging accounts. Copying from a netting account can be performed simultaneously to both netting and hedging accounts. Also, from a hedging account, copying can be performed simultaneously to both netting and hedging accounts. Compatible with the version for the MetaTrader4 terminal; if available, copying can be performed between different terminals (also regardless of the type of

Addition to the standard Relative Strength Index (RSI) indicator, which allows to configure various notifications about the events related with the indicator. For those who don't know what this indicator is useful for, read here . This version is for MetaTrader 5, MetaTrader 4 version - here . Currently implemented events: Crossing from top to bottom - of the upper signal level (default - 70) - sell signal. Crossing from bottom to top - of the upper signal level (default - 70) - sell signal. Cro

Call/Put Ratio is one of the most well-known indicators of the market sentiment. The indicator has been developed by Martin Zweig. It is based on real volumes of the CBOE option market. As we know, a Call option gives its owner the right to buy the underlying asset at a predetermined price. A Put option gives the right to sell it. Thus, increasing volumes for Call options indicate the increasing demand. The growth of Put option volumes shows that supply starts exceeding demand. If we divide the

Your search for a perfectly simple ICT Killzone indicator for MT5 is now over because here it is. If you trade ICT concepts, then you know what ICT Killzones are. ICT Killzones (by default is adjusted to EST New York Time, no recalibrating to your timezone needed. Just load it onto your chart and you're good to go): Asian Open Killzone (06:00PM - 12:00AM EST New York Time) London Open Killzone (02:00AM - 05:00AM EST New York Time ) New York Open Killzone (07:00AM - 9:00AM EST New York Time )

Imbalance / FVG MTF Mark Imbalance on chart of Selected Multi Time frames. Trend is Manually set to filter signals in the chosen direction by a button on the chart. .
Futures Auto Mark Imbalance / FVG on chart on selected time frames
Select time frames by buttons on chart
Popup Alert, Push Notification or email when New Imbalance Form
Popup Alert, Push Notification or email when Imbalance is Taken out
Select Alert Mode to be a single or multiple Imbalance ( OR / AND option ) when Imbalan
Any MA
Any Moving Average draws a moving average of * any indicator in a sub-window. Many Indicators included with MT5 are supported by default. You can add custom indicators as well. Settings Name Description Timeframe Select timeframe for calculation Source Indicator Select Indicator Custom Indicator Name Enter Custom Indicator Name ( when Source Indicator is set to Custom) Indicator Settings Source Indicator parameters ( separated by comma ) Moving Average Settings Moving Average pa

MT5. Определяет торговые каналы и флет актуальные на текущий момент. Принцип построения канала основан на волновой теории поведения цены. Индивидуальная разработка. Канал можно рассматривать как тренд. С закрашенным фоном это основные импульсные каналы. Коррекционные каналы без фона. Границы пробитых каналов выделены трендовыми линиями. Они будут являться линиями поддержки и сопротивления. Это не стандартные каналы. Они вычисляются по новому принципу. В алгоритм заложена закономерность пове
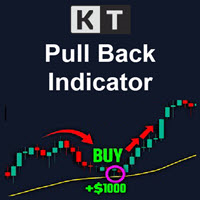
The KT Pull Back Arrows shows the pull back arrows using the RSI (Relative Strength Index) to identify suitable pull-back entry areas within the overbought and oversold zones. The indicator effectively pinpoints favorable moments for initiating pull-back trades by leveraging these RSI thresholds. Trend trading is often considered the most profitable strategy in the Forex market. It is the equivalent of riding the wave, going with the flow, and capitalizing on market momentum. However, timing is

This indicator informs the user when the ATR is above a certain value defined by the user, as well as when the ATR prints a percentage increase or percentage decrease in its value, in order to offer the user information about the occurrence of spikes or drops in volatility which can be widely used within volatility-based trading systems or, especially, in Recovery Zone or Grid Hedge systems. Furthermore, as the volatility aspect is extremely determining for the success rate of any system based o

Every trader knows the drill: we place positions in the market, and gauging their profit potential can be a challenge. But even more critical is understanding the risk we’re taking on. This is where the "RiskVisualizer" EA excels, calculating not just for a single set but for multiple Take-Profit (TP) and Stop-Loss (SL) levels concurrently. With this innovative feature, RiskVisualizer provides a comprehensive risk assessment for your entire portfolio in real-time. Why the 30€ investment pays off

The KT 4 Time Frame Trend is an invaluable forex indicator for traders seeking to identify the trend direction across 4-time frames accurately. This innovative indicator allows users to simultaneously observe and analyze price trends across four different timeframes. Whether you're a beginner or an experienced trader, this tool offers an enhanced understanding of trend dynamics, leading to improved trading strategies on your trading platform. The capability to concurrently monitor multiple timef
It's a well-known fact that most of the financial markets trend only 30% of the time while moving in a closed range rest 70% of the time. However, most beginner traders find it difficult to see whether the markets are trending or stuck in a range. KT Chop Zone solves this problem by explicitly highlighting the market phase into three zones as Bearish Zone, Bullish Zone, and Chop Zone.
Features
Instantly improve your trading by avoiding trade during the sideways market (Chop Zone). You can al

KT Trend Magic shows the trend depiction on chart using the combination of market momentum and volatility. A smoothing coefficient is used to smooth out the noise from the signal.It can be used to find out the new entries or confirm the trades produced by other EA or indicator.
Features
Drag n drop MTF scanner which scans for the new signals across multiple time-frames. Find new entries in the trend direction. Improve the accuracy of other indicators when used in conjunction. Can be used as a

The Expert Advisor is used to create Renko chart, realtime updates, easy for technical analysis. Backtest your strategy with all indicators with Renko chart in MetaTrader 5.
Parameters Box Size : input the number of box size. Show Wicks : if true , draw a candle with high/low. History Start: input the date to creat first candle.
Maximum Bars: limit number of bars on renko chart
How to use Attach the Expert Advisor to a chart (timeframe M1), for which you want to create a renko. Input box siz

10 COPIES OUT OF 10 LEFT AT $70 ---> NEXT PRICE $140 PLEASE READ ALL THE DESCRIPTION BEFORE USE IT LL Tetra EA is an expert advisor based on 4 different strategies , designed and optimized to work on EURUSD, GOLD (XAUUSD) and high volatility pairs (like GBPJPY) . The core strategy of the EA has been studied and applied for years, based on price action it could be applied on different timeframes with the appropriate modifications. Thus was born the idea of programming an algorithm that would
The KT QQE Advanced is a modified version of the classic QQE oscillator to depict it more accurately using the colored histogram with fast and slow Trailing Line(TL).
Unlike the classic QQE, the KT QQE Advanced consists of a histogram with overbought/oversold levels.
Applications
Find quick buy/sell signals across all the timeframes using the MTF scanner. Find the trend direction more accurately. Detects overbought/oversold market. Shows the price momentum.
Inputs RSI Period Smooth Per
Advanced MA Crossover Alert System The FX AlgoTrader Advanced Moving Average Crossover Alert System is a highly configurable MT5 indicator which incorporates a fully automated alert system for monitoring two trader defined moving averages. The indicator is designed to alert traders when two moving averages crossover. The trader has a wide range of control over how the MA Crossover alerts are generated which is detailed below. Key Features Automatic display of trader defined fast and slow movin

50% Off Today Only! Price Goes Back Up at 11 PM (EST)
uGenesys Volume Indicator: Your Key to Mastering Market Volume Analysis What Traders Are Saying: "A must-have indicator...really a game-changer." – wuzzy66 "Amazing indicator...strongly recommend to beginners." – joinbehar Understanding Market Volume: Volume in the market is a critical indicator of movement and opportunity. The uGenesys Volume Indicator is specially crafted to pinpoint when the market has the most volume, allowing you t
The KT Risk Management Indicator provides a comprehensive overview of the profit/loss and risk management characteristics of your Metatrader account, offering valuable insights and information. It efficiently categorizes the displayed information at account and symbol levels, ensuring a clear and organized presentation of crucial data. Risk is inherent when trading the Forex market - a reality that seasoned traders acknowledge and beginners quickly realize. To succeed in this volatile market, t

Awesomo - это инновационный полностью автоматизированный скальперский советник, который работает по стратегии прорыва линий поддержки и сопротивления. С помощью этого советника можно торговать с фиксированным лотом или настроить автоматический расчет значения лота в зависимости от заданного уровня риска. Стоит отметить, что Awesomo использует стоп-лосс для каждого ордера и алгоритм ступенчатой фиксации прибыли. Его алгоритм не использует никаких индикаторов, хеджирование, сетку, мартингейл и арб
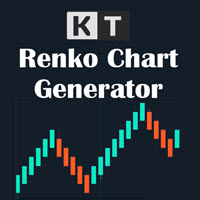
KT Renko Live Chart utility creates the Renko charts on MT5 that can be further used for speculation or live trading. The Renko chart created by this utility supports most of the custom indicators and automated Expert Advisors. Fully compatible with our Renko Patterns indicator and Renko Patterns EA .
Features
A simple and straightforward Renko utility that provides the Renko chart on MT5 without any complicated settings. It supports most of the custom indicators and Expert Advisors for 100%
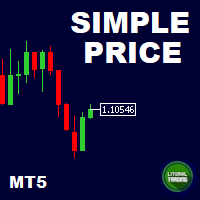
This is our simplest tool! With it you hide the Bid and Ask lines from chart and have only a small rectangle showing what current price is. This tool is useful for those who want the cleanest chart possible. You can also show the Ask price only, instead of the Bid (most common). To further assist you in cleaning the chart check out our other tool: https://www.mql5.com/en/market/product/41835 Any questions or suggestions, please contact us. Enjoy!
FREE

Classic RSL This is the classic indicator "Relative Strength Levy" (RSL), according to Dr. Robert Levy's study, called "The Relative Strength Concept of Common Stock Pricing", which was released as a hardcover book in late 60's of the last century.
Key concept Use this indicator on various instruments to compare their relative strength: The resulting analysis values will fluctuate around 1 The strongest instruments will have the highest RSL values (above 1) and the weakest instruments

KT Volume Profile shows the volume accumulation data as a histogram on the y-axis providing an ability to find out the trading activity over specified time periods and price levels.
Point of Control (POC) in a Volume Profile
POC represents a price level that coincides with the highest traded volume within the whole volume profile histogram. POC is mostly used as a support/resistance or as an essential price level where market retest before going in a specific direction.
Features Very easy

Dear users, January will be the last month that I will keep LL Gold Miner EA for sale at the price of $45 . From next month I will update the prices bringing the lifetime license to $250 , in order to guarantee the exclusivity of the strategy . However I will unlock the ability to rent the EA for 1/3/12 months while keeping the prices reasonably lower. So this really is your last chance to secure your lifetime copy of this fantastic strategy at this price . Don't miss the opportunity. Thank you

Swing Points are those places on the chart where price changes direction. This is an MT5 version of my MT4 Swing Points Indicator. Found on the code base at https://www.mql5.com/en/code/15616 and in the market at https://www.mql5.com/en/market/product/22918
The beginning input parameters allow you to configure your alerts. Turn on screen alerts allows you to turn on and off screen alerts. True is on, false is off. Turn on push to phone alerts allows you to turn on and off push to phone ale
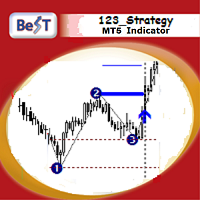
BeST_123 Strategy is clearly based on the 123 Pattern which is a frequent Reversal Chart Pattern of a very high Success Ratio .It occurs at the end of trends and swings and it’s a serious indication of high probability for a change in trend.Theoretically an 123_pattern is valid when the price closes beyond the level of #2 local top/bottom, a moment when the indicator draws an Entry Arrow, raises an Alert, and a corresponding Position can be opened.
The BeST 123_Strategy Indicator is non-repai

Ladies and gentlemen, let me explain a simple tool that can help adjust stop-loss positions based on historical data and customized distance. Tool Name: Trailing Stop Pro Description: A trailing stop is a risk management tool commonly used in trading. It allows traders to set a dynamic stop-loss level that automatically adjusts as the price moves in their favor. Here’s how it works: Initial Stop-Loss: When you enter a trade, you set an initial stop-loss level. This is the price at which you’re
FREE

KT XMaster Formula is a buy & sell signal indicator that works magically on most of the timeframes and currency pairs when used correctly.
The indicator uses calculations based on moving averages, RSI, and MACD. It is usually appropriate for scalping and trend trading - whether you are a novice or an experienced trader, the signals generated by this indicator are simple to understand and implement.
Overview The indicator comprises green and red dots arranged in wavy lines. These dots corre

GoldSupreme Essentials is a sophisticated Expert Advisor meticulously crafted for navigating the complexities of the gold market (XAUUSD). Utilizing a blend of advanced technical indicators and stringent selection criteria, GoldSupreme Essentials is engineered to sift through market noise and pinpoint optimal trading opportunities in gold, ensuring maximum profit potential while mitigating risk. Key Features: Selective Trade Execution: GoldSupreme Essentials harnesses a suite of technical indica
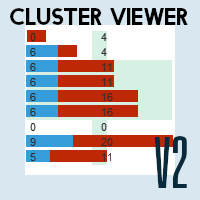
Dominate the Market with Accurate Insights: Meet Cluster Viewer V2 for Metatrader 5! Have you ever wondered how the most successful traders identify the best trading opportunities? With Cluster Viewer V2, you will have access to a comprehensive set of analytical tools designed to provide accurate and in-depth insights into financial markets. Developed for the Metatrader 5 platform, our EA takes your trading strategy to the next level. Features:
Purchase and Sale Volumes by Price Range: View

Parabolic SAR strategies EA is a Parabolic SAR EA that can support multiple strategies. Purchasing this EA can save you the time taken to automate your existing PSAR strategy through coding a custom EA and it also helps you discover profitable Parabolic SAR strategies as its fully compatible with the strategy tester and all settings are editable. The EA supports both scalping, short term and long term strategies. The various supported settings are explained below: NOTE: The default settings in

The script creates account summary report in a separate window. The report can be created for all deals and on deals for selected financial instruments.
It is possible to specify a time interval of calculation and save report to htm-file.
The script creates account summary report in a separate window. The report can be created for all deals and for deals of the selected financial instruments. It is possible to specify a time interval of calculation and save report to htm-file.
Input paramet

Divergence is one of the vital signals that depicts the upcoming price reversal in the market. KT Stoch Divergence shows the regular and hidden divergences build between the price and stochastic oscillator.
Limitations of KT Stoch Divergence
Using the Stochastic divergence as a standalone entry signal can be risky. Every divergence can't be interpreted as a strong reversal signal. For better results, try to combine it with price action and trend direction.
Features
Marks regular and hidde

KT Auto Fibo draws Fibonacci retracement levels based on the ongoing trend direction. The Highs and Lows are automatically selected using the Maximum and Minimum points available on the chart. You can zoom in/out and scroll to adjust the Fibonacci levels accordingly.
Modes
Auto: It draws the Fibonacci levels automatically based on the chart area. Manual: It draws the Fibonacci levels only one time. After that, you can change the anchor points manually.
Usage: Helps to predict the future p

This indicator is a conventional analytical tool for tick volumes changes. It calculates tick volumes for buys and sells separately, and their delta on every bar, and displays volumes by price clusters (cells) within a specified bar (usually the latest one). The algorithm used internally is the same as in the indicator VolumeDeltaMT5 , but results are shown as cumulative volume delta bars (candlesticks). Analogous indicator for MetaTrader 4 exists - CumulativeDeltaBars . This is a limited substi

Pointer synchronization MT5 is an indicator with which the pointer can be synchronized in all the visible graphics of the terminal. It shows a cross cursor on all the visible graphics of the terminal, in position relative to the cursor of the active graph. To activate the indicator, simply press the button that appears in one of the corners of the chart once the indicator is added to the chart. To deactivate the indicator, simply press the button again. Once the indicator has been deactivated,
Reverse TradeCopier for Followers can copy trades from an account that is running Reverse TradeCopier Source . Features: Copies trades from one source (master) account to multiple following (slave) accounts. Allows investor (read only) password for source (master) account. There are no complicated settings and input parameters, everything is easy. Works with different brokers. Works with different quotes symbols (EURUSD_FX, eurusd_m, etc.). Can copy orders from 4-digit quotes platform to 5-dig
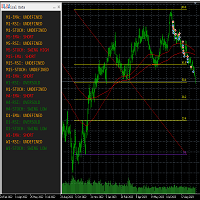
This tool helps to get a quick overview of a market. In one panel, indicators show trend, swing highs/lows and overbought/oversold information of various time frames (M1,M5,M15,H1,H4,D1,W1). Fibonacci can be used to identify different price levels. The input parameters of all indicators can be set by the user. The time frames can be changed as desired. The user can decide for himself which indicators he would like to see in the panel. Fibonacci appears on the chart at the next minute change at t
FREE
OCTOBER SALE!!! OCTOBER SALE!!! OCTOBER SALE!!!
Heiken Ashi Short Grid is an EA that is using the Heiken Ashi Indicator for the initial trade and uses grid trades when the the trade is on the losing side.
OPTIMIZED SETTINGS ARE AVAILABLE IN THE COMMENT SECTION!!! Optimized Currency Pairs: - AUDCAD - USDCAD - AUDUSD
Parameters: - Initial Volume 1 = 0.01 Lot will not open a martingale system 3 = 0.03 Lot for every $10,000 - Grid Size - Multiplier - Take Profit HEIKEN ASHI SETT

This is an utility for automatic scaling of a chart and making at least 140 bars visible in it. This is necessary for a correct wave analysis according to the Bill Williams' strategy "Trading Chaos". The utility can be used on any timeframe available in МetaТrader 5. It draws a vertical line through the first bar the calculation starts from. This line allows you to see the probable starting point of the wave sequence along with a sufficient number of bars displayed in the chart. It also makes th

Laguerre SuperTrend Clouds adds an Adaptive Laguerre averaging algorithm and alerts to the widely popular SuperTrend indicator. As the name suggests, Laguerre SuperTrend Clouds (LSC) is a trending indicator which works best in trendy (not choppy) markets. The SuperTrend is an extremely popular indicator for intraday and daily trading, and can be used on any timeframe. Incorporating Laguerre's equation to this can facilitate more robust trend detection and smoother filters. The LSC uses the

Description This is a Utility tool for MT5 which will make our chart analysis task quite more efficient and save large amount of time. As for chart analysis, some are watching out several symbol simultaneously with single timeframe and others are trading only one single pair with multi timeframe analysis. For both, a common troublesome issue is “scroll chart to look back” or “draw chart objects” in multi charts at the same time. Especially for those who are trading with multi timeframe soluti

This EA use Moving Average crossover Hedging Buy/Sell + Grid strategy. This EA can make 100% profit in 2022 and 2023 from backtesting.
Supported any currency pairs: EURUSD is recommended
Recommended timeframe: H1 Features: Solid backtest and live performance
No need to adjust GMT
Very easy to use: just read 3 lines of instructions below How to install The EA must be attached to ONLY on H1 chart If your broker uses a suffix (e.g. EURUSD.c) you should update names in the

THIS EA IS DESING TO USED IN BTCUSD
Do you want to accompany Criptotrading to the next level of bitcoin trading?
You just have to download it and try it yourself. Also testing it is free. Are you not going to try them?
Criptotrading it is a Secure Automated Software for trade Forex market and indices.
The architecture is a Fully Automatic Autonomous Robot Expert capable of independently analyzing the market and making trading decisions
Criptotrading It is an advanced and profe

If you use the MFI (Money Flow Index) indicator, the waiting time till the next signal can be long enough. Now you can avoid sitting in front of the monitor by using MFI Alerts. This is an addition or a replacement to the standard MFI oscillator . Once there appears an MFI signal on the required level, the indicator will notify you with a sound or push, so you will never miss a signal. This is especially significant if you follow the indicator in different timeframes and currency pairs, which ca

Advanced Bollinger Bands Scanner is a multi symbol multi timeframe Bollinger bands dashboard that monitors and analyzes the Bollinger Bands indicator from one chart. This panel scans the Bollinger bands indicator in up to 28 configurable instruments and 9 timeframes for price overbought/oversold, price consolidation (Bollinger bands squeeze), and consolidation breakout (squeeze break) with a deep scan feature to scan all market watch symbols (up to 1000 instruments!).
Download Demo here

Moving Average Trend Scanner is a multi symbol multi timeframe triple MA crossover dashboard that helps traders to monitor, and identify potential market trends from one chart. This panel scans 3 moving averages in up to 28 configurable instruments and 9 timeframes for triple moving average alignment and moving average crossover with a deep scan feature to scan all market watch symbols (up to 1000 instruments!).
Download Demo here (Scans only M1 and M6) Settings description here MT4 v

마지막으로 인터페이스가 편리 해졌습니다. 지금 당신은 마우스로 표시 기간을 제어 할 수 있습니다. 버튼을 클릭하고 마우스 휠을 스크롤하여 참조 기간을 늘리거나 줄이십시오. 이 버튼은 편리한 장소에 배치 할 수 있으며 한 번의 클릭으로 고정 및 사용할 수 있습니다. 하나의 차트에 여러 지표를 설정하고 개별적으로 또는 한 번에 모두 관리 할 수 있습니다. 차트에 간단한 설치를 사용하면 각 표시기의 매개 변수 이름 바꾸기 또는 변경에 대해 걱정할 필요가 없으며 자동 알고리즘 자체가 필요한 개체의 이름을 바꾸고 생성 할뿐만 아니라 사용 후 삭제할 수 있습니다. 이 인터페이스는 가능한 한 편리하며 실제로 수동 개입이 필요하지 않습니다. 이 구성 요소는 종종 자신의 거래 전략에 참조 표시기를 사용하는 사람들을 위해 이상적입니다. 차트에 지속적으로 작업 할 수 있습니다! 테스터에서 작동하지 않습니다. 이 무료 제품에 대한 귀하의 의견을 남길 수있는 큰 요청. 설치 방법:
-차트에"버튼"을
FREE
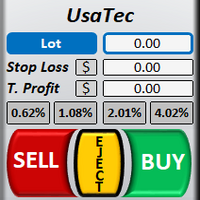
Welcome to TradeX Chart Trading
This utility allows you to send orders quickly and easily. With it you can operate directly from the chart using the shortcut keys SHIFT to buy and CTRL to sell. It is also possible to set Stop Loss and Take Profit, in price or points, directly on the TradeX. Use one of the four risk options (0,5%, 1,0%, 2,0% or 4,0%) to get the pending order volume according to the size of the last closed candlestick and the account balance. Once positioned, it offers Breakeven

UPDATE MAR/20 OBS: Please after purchase contact US via CHAT to suport. This Product is a Market Scanner based on Didi Index Indicator. He can scan all time frames of Symbols in Market Watch, client can customize according the demand, its can scan a single symbol or more than 100.
Manual: Link Driver Link do Manual Video: LINK The Scanner informs 4 kind of signals, all alerts are providing from Didi Index Indicator:
1 - Didi Index - Alert of Buy : Cross up of "Curta" short moving averag
MetaTrader 마켓 - 거래자를 위한 로봇 및 기술 지표는 거래 터미널에서 바로 사용할 수 있습니다.
The MQL5.community 결제 시스템은 MQL5.com 사이트의 모든 등록된 사용자가 MetaTrader 서비스에서 트랜잭션을 수행할 수 있습니다. 여러분께서는 WebMoney, 페이팔, 또는 은행 카드를 통해 자금을 예치하거나 인출하실 수 있습니다.
트레이딩 기회를 놓치고 있어요:
- 무료 트레이딩 앱
- 복사용 8,000 이상의 시그널
- 금융 시장 개척을 위한 경제 뉴스
등록
로그인
계정이 없으시면, 가입하십시오
MQL5.com 웹사이트에 로그인을 하기 위해 쿠키를 허용하십시오.
브라우저에서 필요한 설정을 활성화하시지 않으면, 로그인할 수 없습니다.