MetaTrader 5용 Expert Advisor 및 지표 - 39

You can use this tool to create as many pending orders (limit order) as you want in one button press. All inputs must be in points. You can use this useful tool when such as FED speech times. User Inputs:
MagicNumber = Magic number DeviationPoint = Deviation point number for limit orders Level = You can choise how many level do you want to create pending orders. BuyOrder = true/false SellOrder = true/false StartDistance = Distance between each level. StepDistance = Distance to be added incremen
FREE

Forex 시장에서 성공하고 싶나요? 우리의 혁신적인 AI Swing Trading 지표는 성공적이고 수익성 있는 거래를 위한 비밀 열쇠입니다. 우리는 다음과 같은 독특한 도구를 여러분에게 소개합니다.
우리 지표에는 방대한 양의 데이터를 분석하고 변화를 식별하며 가격 변동을 예측할 수 있는 신경망이 내장되어 있습니다. 이 기술을 사용하면 심층적인 시장 분석을 바탕으로 정보에 입각한 거래 결정을 내릴 수 있습니다. 지표 알고리즘은 피보나치 수준, 가격 조치 및 거래량을 기반으로 합니다. 이를 통해 수학적 패턴을 기반으로 잠재적인 진입점과 시장 진입점을 정확히 찾아낼 수 있습니다. AI Swing Trading은 M30 시간대의 EURUSD 통화 쌍에 사용해야 합니다! AI Swing Trading 표시기가 가만히 있지 않습니다. 작업 과정에서 끊임없이 최적화되어 변화하는 시장 상황에 적응합니다. 이는 시장이 변화하더라도 항상 한 발 앞서 나갈 수 있음을 의미합니다.
VR 템플릿 스위처는 메타트레이더 터미널에서 차트 템플릿 작업을 할 수 있는 강력한 유틸리티입니다. 이제는 템플릿을 업로드, 저장 및 삭제하기 위해 많은 작업을 할 필요가 없습니다. VR 템플릿 스위처 유틸리티를 사용하면 모든 지표, 레벨 및 설정으로 현재 차트 템플릿을 저장하고 한 번의 클릭으로 다른 차트 템플릿을 로드할 수 있습니다. 다른 금융 상품에 대한 템플릿이 있으십니까? VR 템플릿 스위처는 템플릿을 로드할 때 필요한 기간과 금융 상품을 설정합니다. VR 템플릿 스위처에서는 다음과 같은 추가 기능이 제공됩니다. 차트 템플릿을 자동 저장 템플릿의 백업용 사본 생성 PC의 다른 메타트레이더 터미널과 차트 템플릿 동기화 차트 템플릿 변경 시, 새 템플릿뿐만 아니라 차트의 기간 및 금융 상품 즉시 변경 유틸리티는 템플릿의 모든 설정, 지표 및 변경 사항을 저장합니다. 템플릿을 로드하면 모든 것이 복원됩니다. 이는 차트 템플릿이 녹색으로 저장된 경우, 이 차트를 로드 할 때 VR
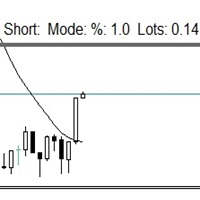
이 작은 도구는 차트에서 간단한 선을 드래그하여 위험 관리를 정의하는 데 도움이 됩니다. 계정 % 또는 라인에서 직접 고정 금액으로 계산된 실제 로트 크기를 보여줍니다.
당신이 해야 할 일은 키보드의 "t" 키를 눌러 라인을 활성화하고 라인을 손실 정지 지점으로 드래그하는 것입니다. 그게 다야.
설정에서 선과 텍스트의 색상과 너비, 선과 오른쪽 사이의 텍스트 공간을 정의할 수 있으며 계정 비율 또는 고정 금액 크기로 위험을 설정할 수 있습니다.
질문이나 희망사항이 있으시면 언제든지 문의해 주세요.
이 작은 도구는 차트에서 간단한 선을 드래그하여 위험 관리를 정의하는 데 도움이 됩니다. 계정 % 또는 라인에서 직접 고정 금액으로 계산된 실제 로트 크기를 보여줍니다.
당신이 해야 할 일은 키보드의 "t" 키를 눌러 라인을 활성화하고 라인을 손실 정지 지점으로 드래그하는 것입니다. 그게 다야.
설정에서 선과 텍스트의 색상과 너비, 선과 오른쪽 사이의
FREE

RSI ALARM (For Metatrader 5)
This indicator works like a normal RSI with all its settings (Periodicity, colors, levels, etc),
but additionally, alarms can be set at the upper and lower level (Example 70 and 30), with the possibility of adjusting these levels by moving the blue and red lines to establish the upper and lower levels.
You can also turn on and off an additional function that creates an arrow on the chart when the expected upper or lower RSI is met.

Convenient tool for measuring the number of points between the prices directly on the chart. Displays in the measurement between points in percentage, points (financial) and time (bars ). Compatible with all graphical timeframes. When fixed on the chart is displayed in all timeframes. Press Ctrl, click the first point, move the mouse and will now display the measurement. Click again and fix. Very fast tool that does not occupy much space. Input Parameters Line Color Line Style Text Color Text Si
FREE
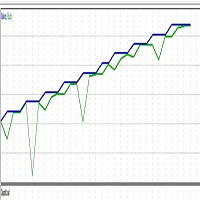
Trading is a skill where you can have your own skill and your own process. So, he advice that you try do what work for you. Trading is not a get rich quick scheme. when you stick to it long enough, it could change your live. Psychology and emotion is very important. Taking basic long and short trades automatically based on MACD and bear power. The robot is a test project by chrisdgenius aim to increasing profitablility.
FREE

This is an unusual representation of the Average Directional Movement Index. The indicator has been developed at the request of a trader and for the purposes of learning the development of indicators in MQL5. The line shows the same as the standard Average Directional Movement Index (ADX); The upward histogram shows the difference between +DI and -DI, when +DI is above -DI; The downward histogram shows the difference between +DI and -DI, when +DI is below -DI.
FREE

Introducing our advanced Expert Advisor (EA) meticulously crafted to navigate the forex market using two prominent technical indicators: Moving Average Convergence Divergence (MACD) and Relative Strength Index (RSI). MACD is a versatile trend-following momentum indicator that highlights changes in strength, direction, momentum, and duration of a trend. Meanwhile, RSI is a popular oscillator that gauges the speed and change of price movements, identifying potential overbought or oversold conditio
FREE

For those Price Action traders who love to trade strong Price points, like today's Opening Price (or even yesterday's Price), here is an indicator to ease the identification of those values, drawn directly on your chart! Opening Price will automatically draw a line showing you this point for you, AND, if you like any OPENing price in the past, not just today's price. A must-have in your Price Action toolbox!
SETTINGS
How many past days do you want to be drawn? Do you want to draw the current
FREE

The VR Close orders script is designed to close positions in the terminal at a profit or loss mark set by the trader. The program is written as a script and can work together on the same chart with any other indicators and expert advisors. The program has a simple visual panel and is easy to configure with the mouse. With this program's help, the trader can automatically close positions and delete orders depending on the conditions set. There is often a situation when you need to close position
FREE

Make simple your trading strategy used PDH & PDL to get funding "faster!" 2 signal entry methods for Breakout or Reversal PDH-PDL. We recommend doing a backtest first on your demo account before using it on a real account.
for GOLD Entry SL: 3000 Points (30pips) TP: 15000 Points (150Pips) RR 1:5. For BreakOut OpenPosition = true. For Reversal OpenPosition = false. Include Reset All Variable For New Day. Youtube Tutorial Here >>

Strangely enough, everyone seems to have their own idea of how you should measure support and resistance. Not every support and resistance zone is strong. The strongest support or resistance levels will more often than not be with trend . What this means is, if we are in a bull trend, pullback levels to support will more often than not be ‘stronger‘ than resistance levels above. These expert advisors use several mathematical models and statistical models to determine the strongest support and r
FREE

Golden Sniper Indicator 를 소개합니다. 이는 트레이더들이 거래 경험을 향상시키고자 하는 강력한 MQL5 도구입니다. 6년 이상의 경험을 가진 팀에 의해 개발되었으며, 이 인디케이터는 뛰어난 정확성으로 거래 기회를 식별하는 신뢰할 수 있는 방법을 제공합니다. 주요 기능 : 알림 및 시그널 화살표 : Golden Sniper Indicator는 적시에 알림과 시각적인 시그널 화살표를 제공하여 트렌드 반전을 식별하는 데 도움이 됩니다. 리스크 관리 : Risk-Reward Ratio (RRR)를 기반으로 적절한 이익 실현 및 손실 제한 수준을 제안합니다. 적응성 : 초보자든 전문 트레이더든 이 인디케이터는 스윙 트레이딩과 스캘핑을 포함한 다양한 거래 스타일에 적응됩니다. 사용자 정의 가능한 설정 : 인디케이터를 사용자의 선호에 맞게 조정할 수 있습니다. 추천 사항 : 타임프레임 : Golden Sniper Indicator는 모든 타임프레임에서 잘 작동합니다. 스캘핑
Scalper 3D EA is a professional scalping EA using the updated scalp strategies and using extended mathematical and statistical theories by analyzing all 28 major and cross pairs for more than 20 years of the history on the market. The product is using smart algorithms to adjust entry conditions based on each symbol and timeframe. So it is not needed to take time for adjusting hard understanding input parameters. All of such parameters are removed.
Usage : You can use EA on all 28 major and cro

TradeCopy is an efficient MT4, MT5 trade copy software,using as EA on MT4 real account. You can download the Demo unlimit version to test on Demo account: Trade Copy MT4 Demo Free Trade Copy MT5 Demo Free
Features: 1.Can achieve cross-MT4 and MT5 trade copy . 2. The Sender and the receiver are in the same file, which is convenient to use. 3.Can achieve cross-broker trade copy. 4.More trade copy style, you can copy by balance,equity, lot ratio or fixed lot . 5.Can enlarge or reduce the amou
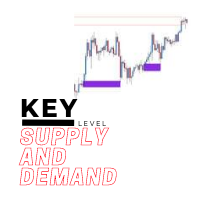
The key level supply and demand indicator is the first supply and demand indicator with options to change settings to show different zones, giving you the choice to pick the zones you see are being respected the most and saving the settings.
Advantages
The key level supply and demand DOES NOT REPAINT unlike other supply and demand currently in the market. This gives you a massive advantage to scroll back and see how price reacted on previous levels. The key level supply and demand

DLMACD - Divergence Local (Wave) MACD . The indicator displays divergences by changing the color of the MACD histogram. The indicator is easy to use and configure. It was created as an addition to the previously published DWMACD . For the calculation, a signal line or the values of the standard MACD histogram can be used. You can change the calculation using the UsedLine parameter. It is advisable to use a signal line for calculation if the histogram often changes directions and has small val
FREE

The "Deviation Scaled Moving Average Crosses" indicator is a powerful technical analysis tool designed for the MetaTrader 5 trading platform. It facilitates informed trading decisions by visually presenting the interaction between two moving averages, both of which are smoothed and scaled to offer enhanced insights into market trends. This custom indicator is developed by mladen and is copyright-protected for the year 2023.
Using a unique approach, the indicator displays two types of deviatio
FREE
A brand new indicator from the developer of MOST (Moving Stop Loss) indicator Anıl Özekşi.
Optimized Trend Tracker OTT is an indicator that provides traders to find an existing trend or in another words to see which side of the current trend we are on.
We are under the effect of the uptrend in cases where the prices are above OTT ,
under the influence of a downward trend, when prices are below OTT
it is possible to say that we are.
The first parameter in the OTT indicator set by the

This EA offers features:
Stoploss (Risk Management), Take Profit (Money Management), Tralingstop and Tralling-Step (after candles), breakeven (strategy), partial sale (strategy), closing the order (strategy), Customizable settings:
1: magic number 2: Commentary 3: Risk, Riskmin and Riskmax 4: total orders 5: SL-(Strategy) 6: TP (true/false points) 7: Initial sale end Breakeven 8: Day positive end trading 9: day range 10: Trailing stop Normal end Intelligent (Candles strategy) 11: Trading St
FREE

OnBoard stats is a panel that show in a single view a lot of usefull information about working orders and trading account. It has 4 different sub-panels (from left to right): Symbols order statistics : it can be found symbols for which there are orders (market or pendings). Symbol with pendings are colored with "Pendings color". Clicking on a specific symbol row, chart will be changed to that symbol. Current symbol statistics : informations about the "current" symbol, the one which is opened in
FREE

매우 간단하지만 효과적인 지표입니다.
이는 이동 평균 MA가 구성되는 Ichimoku 지표의 KijunSen 라인을 기반으로 합니다. 이 두 선이 교차할 때 매수 또는 매도 신호가 발생합니다. 나는 거래할 때 KijunSen 표시선을 자주 사용합니다. 가격이 이 선보다 높으면 매수에만 집중하고, 이 선보다 낮으면 매도에 집중합니다.
또한, 기준선을 평균화하고 기준선 이동평균을 생성한 후 이러한 선의 주요 교차점이 중요해지면서 더욱 밝고 신뢰할 수 있는 거래 신호를 제공합니다. 이러한 교차점은 기회를 나타낼 뿐만 아니라 시장에서 현명한 결정을 내리는 촉매제 역할을 하여 거래자가 변화를 명확하고 자신감 있게 인식할 수 있도록 해줍니다. 결과적으로 KijunSen은 도구일 뿐만 아니라 금융 변동의 바다에서 길잡이 역할을 하는 별이 됩니다.
MT4 버전 지표 링크:
https://www.mql5.com/ru/market/product/96120
지표 매개변

This is a free version and is forecasting only 5 bars The FourierExtrapolationMAFree indicator transforms and extrapolates the Moving Average function by the Fast Fourier Transformation method.
1. The transformation period is set by two vertical lines, by default the first blue line and the second pink.
2. By default, the Moving Average (MA) line is drawn in red.
3. By Fourier Transform, the indicator builds a model of N harmonics, which is as close as possible to the MA values. The model
FREE

Fundamentação teórica Rate of Change - taxa de mudança (ROC) O ROC é um oscilador que flutua acima e abaixo de uma linha de zero, medindo a variação percentual de preços ao longo de determinado período. O ROC de 20 períodos mede a variação percentual de preços ao longo de 20 períodos, quanto maior a diferença entre o preço atual e o de 20 períodos atrás, maior o valor do ROC. Quando o indicador está acima de zero, a variação percentual é positiva indicando tendência bullish, se o indicador está
FREE
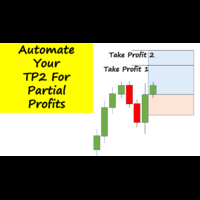
Have you ever been in a winning trade and wanted to close say half of position to lock in some profit. Well, this expert advisor does just that for you, and it's absolutely free. What you need to do is set what percentage of your trade you'd like closed and then set the price you like to close at. It that simple.
To get a better understanding of how it works, then watch the video below.
Note: The EA only works with one timeframe, changing timeframes will result in lose of all data by the E
FREE

Probability-Based Indicator This indicator analyses price movements of a given period to obtain crucial information for probability distribution analysis such as their mean and standard deviation, Once it has such piece of information it does all the necessary calculations and finally calculates the probability that the current market value will go above or below the given period bars. Since this indicator effectively leverages the power of probability which doesn't lie, It is a powerful indicat

Many traders use Price Action as entry and exit signal. Since the beginning of chart analysis, traders have found several candlestick patterns that can indicate possible "behaviors" of the market. Candlestick Pattern indicator is an indicator for MetaTrader platform that can detect many of these patterns and show them on screen or to alert traders about them. though they detect slightly different sets of candle patterns. Candlestick Pattern indicator also has a more modern look compared
FREE

G Trade Broker Check – Instantly Evaluate Broker Performance Across Multiple Accounts and Leverage Settings
Take your trading to the next level by analyzing your broker’s performance in real time! With G Trade Broker Check , traders can effortlessly track their broker’s behavior over the past 24 hours on any symbol added to the Market Watch in MT5. Whether you’re comparing multiple brokers, testing different account types, or analyzing varying leverage setups, this powerful Expert Advisor pro
FREE

https://t.me/mql5_neuroExt actual version Signal https://www.mql5.com/ru/signals/1511461
You can use any tool. The bases will be automatically created at the start of the Learn. If you need to start learning from 0 - just delete the base files. Initial deposit - from 200 ye. Options:
DO NOT ATTEMPT TO TEST WITHOUT NEURAL NETWORK TRAINING!
it is enough for the balance graph after training to be horizontal.
generating a training base is extremely simple.
there is a ready-made training
FREE
Zig Zag Multi Time Frame Indicator counts in how many consecutive candlesticks the current Zig Zag "lit" on the different Time Frames. It can be used for both trend signal strategies and range breakout strategies. Shows simultaneously on all Frames in how many candles we have had Zig Zag value in the current swing. The Zig Zag period can be adjusted in the Indicator settings.
Maximize Your Trading Potential with Our Trailing Stop Expert Advisor! Are you tired of watching potential profits slip away due to unpredictable market fluctuations? Say goodbye to missed opportunities and hello to consistent gains with our revolutionary Trailing Stop EA, designed to safeguard your profits and minimize losses during your trading journey.
Why Choose Our Trailing Stop EA? 1. Flexible Trailing Stop Methods : Whether you prefer a fixed distance in pips or a percentage-based appr
FREE

Spire - показывает трендовый, сигнальный, свечной прорыв в сторону верхней или нижней границы канала, а так же временную или долгую консолидацию в виде прямоугольного канала. Сигналы тренда не перерисовываются. В основу идеи индикатора входит Bollinger Bands.
Изменяемые параметры Signal trend -изменение цветовой гаммы сигнального символа тренда Lower limit - изменение цветовой гаммы нижней границы канала Upper limit - изменение цветовой гаммы верхней границы канала Internal field -изменение
FREE

The indicator automatically calculates and displays the level of the maximum real volume Point Of Control (POC) of the Market Profile for the array of candles highlighted by a rectangular area. This will significantly increase the accuracy of your position entries when trading POC bounces and reversals. Attention when testing the demo version! In the MT5 strategy tester , there is no possibility of dragging a rectangle and this is a problem of limitations of the MT5 strategy

Sapphire Strat Maker Alt is an EA builder ( Expert Advisor Builder) . With it you can easily create new strategies and optimize them to find the bests parameters to improve your results at maximum. The objective is to bring the capabilities of MQL5 to everyone, even if you don't know how to code. Check out the Pro Version clicking here - Sapphire Strat Maker .
With this Expert Advisor you can create strategies by combining the indicators provided by the EA. A few of the functionalities a
FREE

Quantic MultiIndices Introducing Quantic MultiIndices, meticulously engineered to operate on four assets: US500, US30, Nasdaq, and DE30. Built upon the renowned concepts of breakout strategies, it is crafted to ensure precision and long term reliability . Key Features and Operational Insights: Timeframe: 1-hour (1H) timeframe.
Robust Risk Management: risks a user-specified amount of money per trade. (Default: $50).
Strategic Use of Trailing Stop and Stop Loss: Employs a volatility-based tra
FREE
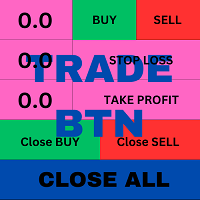
T his is an ON CHART trade management panel. In other words, ON CHART Lot Size, Buy, Sell, Stop Loss, Take Profit, Close Buy, Close Sell and Close All buttons! *IMPORTANT NOTE: Input settings are NOT usable. You can change or insert Stop Loss and Take Profit values only on the chart panel. (See the below video!) This one is MT5 version!
BUTTONS List: 1. Lot Size - (0.01) is default click on it and insert the lot size with which you want to open a trade. 2. Stop Loss - (0.0) is default click on
FREE

Индикатор для синхронизации и позиционировании графиков на одном и более терминалах одновременно. Выполняет ряд часто необходимых при анализе графиков функций: 1. Синхронизация графиков локально - в пределах одного терминала при прокрутке, изменении масштаба, переключении периодов графиков, все графики делают это одновременно. 2. Синхронизация графиков глобально - тоже самое, но на двух и более терминалах, как МТ5, так и МТ4. 3. Позиционирование графика на заданном месте при переключении периодо
FREE

Order Entry - Probably the easiest way to enter an order If you like this perhaps you might consider buying the pro version https://www.mql5.com/en/market/product/64353?source=Site+Profile+Seller An aid for entering orders. Features: * Drag & drop tool to adjust price, stop loss and take profit levels. * Calculates lot sizes automatically based on risk entered, currency pair and stop loss / price levels.
Description It enables you to visually enter a trade's price, stop loss and take profit
FREE

Great dashboard for market analytics. Help you to analyze the values of the Moving Average indicator and prices.
Using this dashboard you can: find signals from the Moving Average from all timeframes; find signals from the Moving Average from all symbols; check - how far the Moving Average is from the price; check - the Moving Average value has changed; 2 types of signal.
Modes of operation (switched by a button on the graph): current value of Moving Average; the difference between the cu
FREE
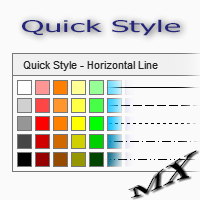
The Quick Style utility is designed for facilitation and acceleration of working with the properties of graphical objects. Left-click a graphical object while holding the Shift key to open the quick access window for configuring the object properties. In the window, you can change the color, style and line width with one click, including those of other graphical objects. All changes are displayed immediately. To close the Quick Style , simply click the free space on the chart. The utility is eas
FREE

Full Automated Trading panel . it works on any trading instruments: Forex, Stocks, Futures, Indices, CFD, Bonds, Cryptocurrencies; interface minimization function; flexibility of use;
Join my channel and check video of it ===> https://t.me/Ash_TheTrader/4986
Features :
Auto SL and TP Auto Close partial Auto Trailing Session Time Alert Time of trading Alert Profit and Percentage and etc.
FREE

Trend Fibonacci is a unique indicator that combines a power of Fibonacci sequences and ranges. Channel Group: Click Here
How to read:
- There are three zones --> red, gold and green
- Red candlestick = downtrend
- Green candlestick = uptrend
- Gold candlestick = no established trend
Inputs: Per = number of bars used for calculations FirstRatio = first Fibonacci ratio (Or use any ratio you want) SecondRatio = second Fibonacci ratio (Or use any ratio you want)
!! IF YOU PURCHASE TH
FREE

ICT Kill zone and Macros Indicator mark and display the following zone times on the chart: Kill zones Kill zone Forex Asian
London Open New York Open London Close Central Bank Dealing range
Kill zone Indices Asian London Open New York AM New York Lunch New York PM Power Hour
Macros London 1 London 2 New York Am 1 New York AM 2 New York Lunch New York PM 1 New York PM 2
Silver bullet London Open New York AM New York PM
Sessions Asian London New York
Chart The display of Kill zone ,

This indicator is designed according to the combination of WPR and Stoch indicators, when WPR goes up and Stoc goes up quickly too, the price may meet strong resistance, many times short order will take profit, but if the price break through it, Long positions are more likely to be profitable, and the reverse held true as well. You can adjust the parameters of WPR and Stoc to Adapt the symbol you operate. Click here to look the advanced edition: https://www.mql5.com/en/market/pro
FREE
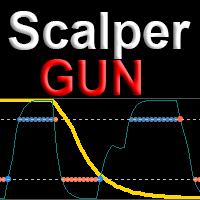
Scalper gun - главное оружие для торговли скальпингом и свингом, с визуализацией и алертом точек входа. Индикатор работает как в трендовых, так и в нетрендовых рыночных условиях. Подходит начинающим и опытным трейдерам. SCALPER GUN превосходит по скорости, качеству визуализации и точности входа популярные топовые индикаторы этого сайта!!!
Перед покупкой скачайте демо Scalper gun и сравните с аналогичными индикаторами для скальпинга в тестере MT4. Особенности Это готовая торговая система с виз

Hi there! Since I am starting commercial and non-commercial product publishing I would highly appreciate: If you like this product, please rate it. That will help to promote not only this product, but indirectly another ones. So, such promotion will help to make some money from commercial products. Thus, I will have opportunity to fund my another directions of trading researches like bot development using mql4 and mql5 programming languages as well as python written products like crypto bots. If
FREE

Transform your way of analyzing the market with our innovative trend and support/resistance indicator!
By combining the robustness of pivot points, the sensitivity of price adjustment, and the reliability of moving averages, our indicator provides a comprehensive and intuitive view of price behavior. Whether to detect emerging trends, track significant price shifts, or map critical support and resistance zones, this tool is your reliable guide amidst market volatility (BMF WIN).
T ested f
FREE

The main objective of this indicator is to determine entry and exit points, that is why ExactArrow draws nothing but arrows showing entry and exit points. In spite of apparent simplicity of the indicator, it has complicated analytic algorithms which determine entry and exit points. The indicator generates exact and timely entry and exit signals which appear on the current candle. The indicator generates an average of 1-2 candles before its analogues do. The indicator is very easy to use. Open Bu
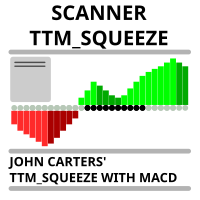
Market scanner based on the indicator published here Download the 'John Carters TTM Squeeze with MACD' Technical Indicator for MetaTrader 5 in MetaTrader Market (mql5.com) . Only the instruments that are in the Market Watch window are scanned. Maximum number of scanning tools up to 5000. The scan timeframe is selected from the timeframe panel of the terminal. To use it, open any chart and attach the Expert Advisor to the chart, the 'Search' button will appear in the upper left corner. When you
FREE

This Price indicator aid you to read prices of a bar without using native MT5 instuments like crosshair.
The indicator gives you the OPEN HIGH LOW CLOSE and 50% bar prices of the current or one of the previous bar.
Parameter setting are: TimeShift: Used for bar selection (0 stand for current 1 for previous 2 for 2 bars ago) Other parameter are using for esthetics. Each Label can be moved away from its initial position.
FEEL FREE TO REPORT BUG AND REVIEW THIS INDICATOR. THANKS
FREE

About. This indicator is the combination of 3 Exponential Moving averages, 3,13 and 144. it features Taking trades in the direction of trend, and also helps the trade to spot early trend change through Small moving averages crossing Big Moving averages Product features 1. Have built in Notification system to be set as the user desires (Alerts, Popup notification and Push Notification to Mobile devices) so with notification on, you do not need to be at home, or glued to the computer, only set and
FREE
전략: 미국 시장이 열리면, 양이 크게 증가하고 따라서 변동성이 있다. 가격은 미리 정의된 범위에서 '브레이크아웃'하는 경향이 있습니다. 예를 들어, 이전 영국 거래 시간 동안 한 세트. 타임 브레이크아웃을 통해 이러한 브레이크아웃 기회를 쉽게 거래할 수 있습니다. 특징: 시간 기반 브레이크아웃 분석: 이 전략은 역사적으로 더 높은 시장 변동성과 증가된 거래 활동을 보여주는 특정 시간 간격에 초점을 맞추고 있다. 이 지식을 활용함으로써, 시간 및 범위 브레이크아웃 전략은 이러한 목표 기간 동안 브레이크아웃 기회를 효과적으로 식별합니다. 가격 범위 평가: 이 전략은 최적의 브레이크아웃 수준을 결정하기 위해 범위 분석을 사용합니다. 그것은 특정 기간 내의 가격 범위를 계산하여 가격이 미리 정해진 임계값을 초과할 때 시스템이 잠재적인 브레이크아웃을 식별할 수 있도록 한다. 사용자 정의 가능한 매개 변수: 시간 및 범위 브레이크아웃 전략은 사용자가 거래 선호도에 맞게 다양한 매개 변수를 조

パラボリックのデータをもとにトレンドの方向性を1分足から月足まで表示します。 1分足から 月足 まで表示されているので今どの方向に価格が動いているのかがすぐに分かります。
更新はティク毎ではなくディフォルトでは1秒毎、もちろん変更も可能なのでチャートの表示が遅くなるようなことはありません。
機能:
どの通貨でも表示可能になります。
アイコンの色を指定することが可能になります。
表示位置(X軸、Y軸)が変更可能 になります。
表示位置 (左上 、 右上 、 左下 、 右下) が 指定 が可能 になります。
フォント を指定することが可能になります。
フォントサイズ が 変更可能 になります。
アイコンのサイズ が 変更可能 になります。
週足、 月足 の非表示 が 可能 になります。
FREE

A Simple clock that on the left side "Time" shows r espectively the TimeCurrent, followed beneath by the TimeLocal. On the right hand side we have the remaining minutes and seconds of the current candle. TimeLocal is synced every 500 miliseconds however, the TimeCurrent and the time left on the candle are synced every tick, so this can lead to inconsistencies on the readings so keep that in mind.
This indicator have no plots or buffers so it cannot be used in any time based EA.
FREE
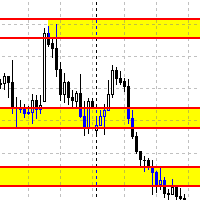
Данный советник автоматически переносит SL в зону безубытка, и по мере увеличения текущей прибыли переносит SL все выше. В отличие от стандартного трейлингстопа, этот автоматически работает со всеми открытыми позициями, которые открыты у текущего символа. Так же если выставлен флаг автоматически выставлять SL, то в случае пустого SL, автоматически выставит его.
FREE
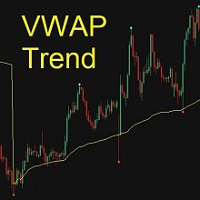
The Anchored VWAP (Volume-Weighted Average Price) indicator is a popular technical analysis tool used by traders and investors to analyze the price action over a period of time. This indicator will automatically identify the trend turning points to help traders more easily see when market is continuing the trend, pulling back, or reversing by crossing the VWAP line. Stack on multiple time frame periods to use like other moving average indicators. You can customize price calculatio

Что такое RSI? Индикатор RSI (Relative Strength Index, индекс относительной силы) — это индикатор, который измеряет соотношение восходящих и нисходящих движений. Расчет ведётся таким образом, что индекс выражается в диапазоне от 0 до 100. Как понять RSI?
Если значение RSI находится равно 70 и больше, считается, что инструмент находится в состоянии перекупленности (ситуация, когда цены выросли выше, нежели того ожидал рынок). Значение RSI на уровне 30 и ниже считается сигналом о том, что инст
FREE

The indicator shows when there are overpricing and divergences over a normalized MACD Plus, it displays signals with configurable alerts, self-regulating dynamic overprice levels, and a simple setup and interface. The indicator that automatically calculates overprices ranges! MACDmaxmin is an indicator based on the MACD oscillator that effectively identifies trend changes in price, as it is a momentum indicator that captures the trend and shows the relationship between two moving averages of th

As a seller, I have a unique Expert Advisor on the MQL5 Market which I would like to offer. Even though I cannot guarantee success with this product, I can assure that it works and that it will help the consumer pass their Prop Firm challenges. It can be successfully used with 1H time frame and on the GBPCHF currency pairs but it can also be applied to other symbols and time frames.
Moreover, I am offering a free risk management EA as an GIFT with this expert advisor. It will help users detec
FREE

Advanced Trend Builder is a trend indicator using the original calculation algorithm. ATB can be used on any data and timeframe. My recommendation use for calculation numbers 4 - 16 - 64 - 256 and so on ..., but this is only recommendation. The middle of the trend wave is a special place where market behavior is different, when developed ATB was main idea to find the middle of the wave trend. Input parameters: Bars will be used for calculation - number of bars used for a trend line calculation.
FREE

Chart Buddy는 거래 차트에 재미를 더하기 위해 설계된 엔터테인먼트 도구입니다. 캐릭터가 차트 오른쪽을 따라 움직이며, 가격 움직임을 응원하는 듯한 인상을 주어 거래 경험에 독특하고 즐거운 요소를 추가합니다. 거래에 직접적인 영향을 미치지는 않지만, 애니메이션은 가벼운 휴식을 제공하며 개인적인 지원자가 있는 것처럼 느끼게 합니다. 주요 기능: 가격 움직임 지원 : 캐릭터는 가격 방향(상승, 하락 또는 포지션에 따라) 응답하여 움직이며, 마치 시장을 응원하는 것처럼 보입니다. 캐릭터 선택 : 세 가지 캐릭터(다람쥐, 스모 선수, 소녀) 중에서 선택하거나 사용자 지정 이미지를 업로드하여 경험을 개인화할 수 있습니다. 커스터마이징 가능한 애니메이션 : 캐릭터의 이동 속도와 타이밍을 설정하여 사용자 취향에 맞게 조정할 수 있습니다. 시각적 엔터테인먼트 : 애니메이션 캐릭터는 거래 환경에 생동감 있고 인터랙티브한 요소를 추가합니다. illust STAMPO 소개 이 도구는 무료 이미지
FREE

This indicator calculates support and resistance prices in multi-timeframe with different formulation and draw them on the chart that style do you choose. And If you want, Indicator can alert you when the current price arrive these pivot levels. Formulations: Classic, Camarilla, Woodie, Demark, Floor, Fibonacci
Alert Options: Send Mobil Message, Send E-mail, Show Message, Sound Alert
Levels: PP, S1, S2, S3, S4, S5, R1, R2, R3, R4, R5, TC, BC and Middle Points Why do you need this indicator:

Moving average indicator to work with the F12 Replay simulation and replay tool.
In this way, the F12 Replay tool now supports the moving average indicator.
F12 Replay: https://www.mql5.com/pt/market/product/38313
This is a product developed by Renato Fiche Junior and available to all MetaTrader 5 users!
Partners: "Águia Traders" team ( Eagle Traders ) by Larissa Sihle #aguiatraders #larissasihle
Input Parameters
Period Shift Method
FREE
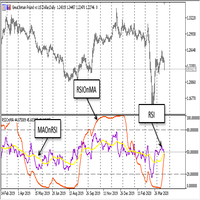
The EA trades on two indicators iMA (Moving Average, MA) and one iRSI (Relative Strength Index, RSI). Decision on trade signals is only made when a new bar appears, while positions are trailed and closed (in case of profit) at every tick. An unconventional solution was applied: The Slow indicator averaging period is calculated as the Fast averaging period multiplied by two, while the RSI averaging period is always equal to the Fast averaging period. This reduces the number of par
FREE

This indicator will draw two lines to represent the adjustment value, which can be used in both the Dollar and the Index.
The main advantage of this indicator is that it has two lines, one representing the adjustment calculated from the previous day and the other representing the adjustment calculated on the current day. The calculation of the adjustment on the current day is a great differential, since it will be possible to make operations in order to sleep bought or sold according to the a
FREE

The utility is a checklist where you can write all the rules of your trading system and keep it on the chart in front of your eyes. As a rule is executed, mark it with a tick. To the right of each rule, you can write the "strength" (percentage) of the rule. And if there is a tick next to the rule, then all "forces" are summed up in the "Total" line.
For the convenience of visual perception, you can set the color for displaying the “Total” value.
Panel options: Title - The title of the panel
FREE

Autumn-Harvest EA
Features Multiple strategies for entry and exit Open buy and sell positions and set applicable amounts for each Smart stop-loss and trailing stops levels EA can be set to only maintain own deals or any open deal eMail and telegram alerts on buy/sell signals ( * Configure the email tab under options for trade opportunity email alerts to work ) Monitoring using heartbeat checks
About This EA is capable of opening trades using various strategies. Once the trades are open it a
FREE

The ShowSessions indicator for MT5 shows up to two, self-selected, time intervals, for a free choosen number of days past and a few future days. Weekends are marked with an additional red vertical line. The indicator makes manuel backtesting of strategies more easily, but you can use ist for daily trading as well. Please note that the server time does not always correspond to the actual time.
FREE
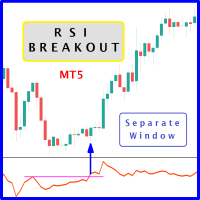
The likelihood of farther price movement increases when Relative Strength Index oscillator "RSI" breaks through its historical resistance levels in conjunction with prices breakout of resistance levels. It's strongly encouraged to confirm price breakout with oscillator breakout since they have comparable effects to price breaking support and resistance levels; similar perception is applied to short trades. Concept is based on find swing levels which based on number of bars by each side to confir
FREE
MetaTrader 마켓은 거래 로봇과 기술 지표들의 독특한 스토어입니다.
MQL5.community 사용자 메모를 읽어보셔서 트레이더들에게 제공하는 고유한 서비스(거래 시그널 복사, 프리랜서가 개발한 맞춤형 애플리케이션, 결제 시스템 및 MQL5 클라우드 네트워크를 통한 자동 결제)에 대해 자세히 알아보십시오.
트레이딩 기회를 놓치고 있어요:
- 무료 트레이딩 앱
- 복사용 8,000 이상의 시그널
- 금융 시장 개척을 위한 경제 뉴스
등록
로그인
계정이 없으시면, 가입하십시오
MQL5.com 웹사이트에 로그인을 하기 위해 쿠키를 허용하십시오.
브라우저에서 필요한 설정을 활성화하시지 않으면, 로그인할 수 없습니다.