MetaTrader 5용 Expert Advisor 및 지표 - 143

Trend TD is a trend indicator. Thanks to the algorithm of this indicator, the signal will never go against the trend. Thanks to the two lines forming a narrow channel, the algorithm for analyzing entry points, the algorithm controls the reversal moments at the moment when the upper line of the channel has reversed and it is possible to visually draw a line crossing the upper line with itself in the past, while crossing the lower line at one point. If this rule is fixed, then the signal will b
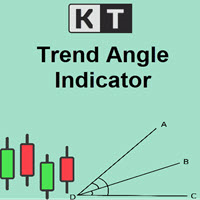
The KT Trend Angle helps to identify ranging and trending markets. The idea is to only enter a trade following the market trend if the slope is steep enough.
An angle is the ratio of the number of bars to the number of points: The bars mean the time offered by standard (M1, M5, etc.) and non-standard time frames. Points represent the unit of price measurement with an accuracy of 4 or 5 decimal places.
Input Parameters Period: An integer value to define the intensity of angled trendlines. Angl

The EA works with 24 pairs, it has been programmed with specific indicators designed by me, it is not the result of optimizations on past facts and events. The EA is fully customizable from input. The EA is able to detect countertrend movements and therefore opens hedging positions until the new signal to protect the account from strong drawdowns (this is a rare fact. In the backtest 2 or 3 times at most) but it still manages to reduce the drawdoWn and avoid major stop losses. Don't judge EA by
A very good indicator for experienced and professional traders . A practical approach to trading. Easy to understand. A helping tool for traders looking for price movements .
Signals: Signal Number 1: When yellow line which is a signal line crossing the zero line towards downward direction is a selling opportunity. Signal Number 2:
When yellow line which is a signal line crossing the zero line towards upward direction is a buying opportunity.
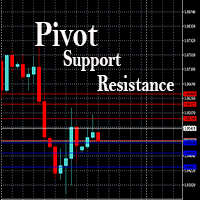
This EA is designed to calculate and draw Pivot Point, Support and Resistance for your selected time frame on the chart.
Works on all currency pair and on any time frames available on MT5.
To make sure the EA works, you need to select the pivot time frame as well as the candle shift that you want to calculate the pivot.
0 = Current candle on chart
1 = Previous 1 candle on the chart

2 copies left at 49 USD. Next price is 99 USD . set file
- This is a very aggressive trading strategy, based on a modified MACD indicator. It is used to analyze the anomalous zones of the market + author's methodology to restore the critical movement.
The strategy was developed taking into account the movement of the currency pair USDCHF and the best rates of trade just on it.
Recommendations:
- H1 USDCHF - Leverage of 1:500 or higher (ideally 1:1000 or 1:2000) - Minimum deposit 100 units -
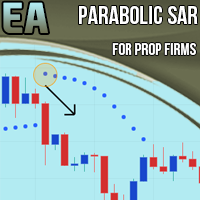
Parabolic SAR EA for Prop Firms is an Expert Advisor designed specifically to overcome the challenges of Proprietary Firms such as MyForexFunds and obtain a founded account. In fact, it has specific functions to comply with the rules imposed by the companies that offer managed accounts.
- It is based on a strategy with Parabolic SAR , EMA and ATR indicators that tell the EA when to open positions and where to set the stop loss.
- Works on all Forex pairs, recommended on M5, M6, M10 timeframes
KT Forex Blau Balance combines elements of momentum and volatility. It helps you identify entry and exit points.
Blau Balance consists of two moving averages (a slow-moving average and a fast-moving average) intersecting key transition points in market price. The indicator turns green or red when one is above or below the other, signaling to buy or sell trade signals.
It can be used in currency pairs and other markets that your MT4 or MT5 platform supports. Both short-term and long-term trade

Forex에서 편안한 작업을 위한 다중 통화 거래 로봇. 최소한의 사용자 정의 가능한 매개 변수가 있으므로 초보자와 숙련 된 거래자 모두에게 적합합니다. 예를 들어 "EURUSD"와 같이 하나의 통화 쌍에 거래 로봇을 설치하고 결과를 보기만 하면 더 이상의 조작이 필요하지 않습니다. VPS 서버와 브로커에 대해 까다롭지 않습니다. 지속적인 최적화가 필요하지 않은 안정적인 봇 - 일단 설치, 구성 및 잊어버리십시오. *write me after purchase to get the second version as a gift
Signal: https://www.mql5.com/en/signals/1722303 MT4 - https://www.mql5.com/en/market/product/86883
요구 사항:
타임프레임 M15
최소 보증금 $1000
레버리지 1:500
VPS 서버
봇 설치 및 구성:
1. EURUSD 통화 쌍에 봇 설치
2. M15 기간

Do you know what is The Blue Ocean Strategy ?
It is when an entrepreneur goes on a brand new market with no concurrence because nobody knows about it. This way, the entrepreneur is in a situation of monopoly and can enjoy this situation as long as nobody comes into the market. And you know what ? This situation is reproducible in bot trading thanks to the Blue Ocean Strategy EA MT5.
I’m a prop firm trader and I use it myself to make all my trades. After many years of use, a friend told me

The KT De Munyuk is a trend-based indicator that uses Parabolic SAR to identify the market direction. The indicator shows the PSAR in the form of green/red dots using a separate window. Buy Signal: When a green dot appears after a series of at least three red dots. Buy Exit: When a red dot appears on the current or next higher time frame. Sell Signal: When a red dot appears after a series of at least three green dots. Sell Exit: When a green dot appears on the current or next higher

In MetaTrader, plotting multiple horizontal lines and then tracking their respective price levels can be a hassle. This indicator automatically plots multiple horizontal lines at equal intervals for setting price alerts, plotting support and resistance levels, and other manual purposes. This indicator is suitable for Forex traders who are new and looking for chances to make quick profits from buying and selling. Horizontal lines can help traders find possible areas to start trading when the

KT XMaster Formula is a buy & sell signal indicator that works magically on most of the timeframes and currency pairs when used correctly.
The indicator uses calculations based on moving averages, RSI, and MACD. It is usually appropriate for scalping and trend trading - whether you are a novice or an experienced trader, the signals generated by this indicator are simple to understand and implement.
Overview The indicator comprises green and red dots arranged in wavy lines. These dots correspo

KT Forex Trend Rider uses a trend following algorithm developed specifically for the Forex market to provide reliable buy & sell signals across the major currency pairs. It works best on major FX pairs and all time-frames.
Features
It comes with a Multi-Timeframe scanner that can search for upcoming signals across all the time-frames. It comes with four preset profiles to facilitate trading for scalpers, tick-trend, swing, and trend traders. It marks the potential reversal points in the market.

XFlow shows an expanding price channel that helps determine the trend and the moments of its reversal. It is also used when accompanying transactions to set take profit/stop loss and averages. It has practically no parameters and is very easy to use - just specify an important moment in the history for you and the indicator will calculate the price channel.
DISPLAYED LINES ROTATE - a thick solid line. The center of the general price rotation. The price makes wide cyclical movements around the
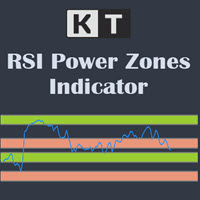
The KT RSI Power Zones divides and shows the movement of RSI into four different power zones to identify the potential support and resistance zones using the RSI.
Bull Support The bull support ranges from 40 to 50. The price is expected to reverse to the upside from this zone.
Bull Resistance The bull resistance ranges from 80 to 90. The price is expected to reverse to the downsize from this zone.
Bear Support The bear support ranges from 20 to 30. The price is expected to reverse to the ups

Multy TDM this bot works using the Trend TD indicator. The multicurrency bot works with 12 pairs, pairs can be changed and others can be used.
The essence of the work is to open a small series of orders and exit the market either in profit or with losses, but exit and not linger and open the next series on the signals of the indicator. The heart of this algorithm is the formula for exiting the market, when to exit and with what profit or loss, how many orders can be allowed to be used in a

The BSI stands for Bar Strength Index. It evaluates price data using a unique calculation. It displays readings in a separate window. Many financial investors mistake this indicator for the Relative Strength Index (RSI), which is incorrect because the BSI can provide an advantage through its calculation method that the RSI indicator does not. The Bar Strength Index (BSI) is derived from the Internal Bar Strength (IBS), which has been successfully applied to many financial assets such as commodit

The KT Tether Line is a trend-following tool consisting of three indicators that work together to generate trading signals. It can correctly identify market trends while signaling trade entries. It was first introduced by Bryan Strain in the Stock & Commodities magazine in 2000 in "How to get with the trend and out at the end."
The Concept
When a market trend is confirmed, the most challenging part is determining the timing of the entries. This indicator alerts you to potential trend reversals

Advance Trend Intellegence EA is Powefull Expert Advisor base on trend following strategy. This expert using advance dynamical algorithm to cathching the market trend. With this EA orders that are made accurate entry orders in the market in tune with the trend signal. This EA have a good performance that has been tested more than 1 years with real ticks history data.
Although this EA can be use on any pairs, but please Use this EA on EURUSD Pair at M15 timeframe. Account type : HEDGE.
Advanc

Um Inside Bar é um dos principais sinais de continuidade de uma tendência existente e as vezes reversão, pois nos mostra locais especiais de entrada, possibilitando uma boa taxa de Risco x Retorno. É simples visualizar um Inside Candle. Esse padrão é formado por apenas dois candles. O primeiro deve ser, preferencialmente grande, e o segundo deve estar integralmente contido dentro dos limites de máxima e mínima do primeiro.

Current : This first version of AlgotradeClub EA was developed by the strategist with a focus on CFD operations on Global Indices (Us500, UsTec, Fr40, etc.). Operates the main direction of the trade only buy positions opening positions in bar opening respecting the minimum distance as parameterized. There is an option to open sell positions after “n” buy positions, placing Stop Gain of each sell when the buy position “n+1” is executed. The closing of each trade takes place through the financial
Algo Bot is an expert advisor that is designed and optimized for GBPUSD. It is extremely easy to use, just open the GBPUSD pair, load the bot and activate Algo Trading. You can leave the default values. This bot does not use any technical indicator, its algorithm is based on price action, placing BuyLimit and SellLimit orders in optimal zones for GBPUSD.
The parameters of the EA are: Magic number: Number to identify the positions of this EA. Points to place the next order: Points at which the

Harpoon :It is a fully functional automated system that uses a tested strategy to exit statistically significant price levels and adapts to different conditions. This system is adjusted taking into account the delay in the execution of orders at different stages of the transaction. Expert Advisor uses price action to determine levels, which is an undeniable advantage compared to constantly lagging indicators. Signal : https://www.mql5.com/en/signals/1251860
Considering that this expert must

Stack Manager is a MT5 utility that is built to help traders: manage existing stacked trades (multiple trades opened on the same symbol) copy SL / TP levels to newly opened trades update SL / TP levels for all stacked trades, if one SL or TP level is modified calculate and show global SL / TP in currency and points (for all open trades in a stack) SL / TP autocomplete from phone (if left on a VPS, traders can place orders on a phone and SL / TP levels will be copied from the existing trades)
Id

Ichimoku Aiko MTF is a collection of technical indicators that show support and resistance levels, as well as momentum and trend direction. It is a multi-timeframe indicator so you don't need to change the chart timeframe when you want to see the ichimoku clouds on a higher timeframe. eg. The chart timeframe is M15 and you want to see on the M15 timeframe chart the H1 ichimoku indicators (the ichimoku in Metatrader can't do that) that's why you need to use Ichimoku Aiko MTF.
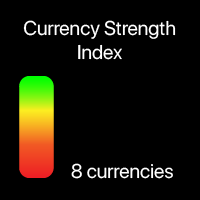
Current strength of the 8 major currencies My #1 Utility: includes 65+ functions, including this indicator | Contact me if you have any questions The indicator is displayed in a separate window, it can be moved to any place on the chart. In the input settings you can adjust: Interface theme : dark / white; Prefix and Suffix, if the currency pairs on your broker have it:
(e.g. if Symbol is "EURUSD .pro ", please set " .pro " as a Suffix); Panel size Font size
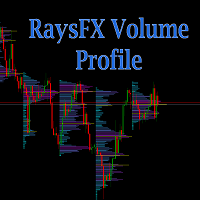
Calculation method The calculation method is summing the number of deals performed at a certain price. Alternatively, the volumes at a certain price can be summed if the real volume type is set in the parameters. The trade data is interpolated based on the most accurate terminal data available (М1 timeframe data). Each bar is divided into several trades based on the estimated price movement inside the bar. This is a distinguishing feature of the product setting it apart from other ones that hav
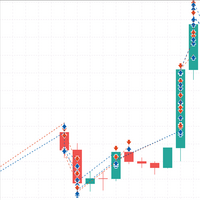
MT4 Version : https://www.mql5.com/en/market/product/87060 Matrix Hacker는 헤지 계정 전용이며 랜덤 워크를 사용하므로 과거는 중요하지 않습니다. EA는 시장에서 안정적인 기반을 유지하고 매도호가와 매수호가를 모두 다룰 것입니다. 거래자에 따라 다양한 크기와 수량으로 매수 및 매도 매수 및 매도. 이것은 여전히 최적화에 대해 알아야하고 과도하게 활용하지 않아야하기 때문에 초보자에게는 권장되지 않습니다. 작은 핍을 스캘핑하고 범위를 유지하기 위한 설정을 사용하는 것이 좋습니다.
이 EA는 잠재적으로 4개의 거래를 열 수 있으므로 이를 이해하여 입력의 크기가 올바른지 확인하십시오. 고정 로트 크기를 사용하므로 고정 랏으로 4개의 거래를 고려해야 합니다. 라이브로 거래하기 전에 먼저 데모에서 이 EA를 사용하고 확신할 때까지 증분 로트로만 라이브로 이동하십시오. 모든 마이크로 로트에 대해 $1000를 권장합니다. 데이

Supply / demand zones: observable areas where price has approached many times in the past. My #1 Utility: 65+ features , including this indicator | Contact me for any questions | MT4 version The indicator shows where the price could potentially be reversed again. Usually, the more times the price has been rejected from the level, the more significant it is. In the input settings you can adjust: Enable or disbale Weak zones; Show or hide zone description; Font size; Set the basi
Absolute volatility for each day for the last 4 weeks My #1 Utility: includes 65+ functions, including this indicator | Contact me if you have any questions The indicator is displayed in a separate window, it can be moved to any place on the chart. In the input settings you can adjust: Interface theme : dark / white; Calculation method: price, pips, points, % change;
Panel size Font size

Art of Scalper는 정확하게 거래하고 가격 반전에 의존하는 완전 자동화된 Expert Advisor입니다. EA는 시장 주문을 사용하여 거래하고 시간 평균을 사용하여 성능을 개선합니다. 이 EA는 XAUUSD, GOLD에서 가장 잘 작동하며 AUDUSD, GBPUSD, NZDUSD, USDCAD, USDCHF 등에서도 작동합니다. 이 시스템을 거래할 때 VPS를 사용하는 것이 좋으며 모든 브로커와 호환됩니다. 테스트 결과와 최적화된 설정을 다시 확인하세요.
요구 사항:
거래 쌍 - GOLD, XAUUSD, EURUSD 등
기간 - M1,M5,M15,M30,H1
최소 보증금 - $100
레버리지 - 1:500
브로커 - 모든 브로커
특징:
- 조정 가능한 입력이 있는 완전 자동 모드.
- 고급 경제 뉴스 필터링
- 모든 유형의 실행으로 다른 시장에서 주문을 보류하여 작동합니다.
- 손절매 관리의 엄격한 사용, 모든 거래는 사전에 보호됩니다.
-

TPM Cross (trend power moving cross) - is a trend following strategy based on custom signal points. Indicator consists from main custom moving chart line and trend power line. Indicator defines up and down movements by it's trend power and custom moving direction. When current market's trend looses it's power and opposite trend starts - power trend line crosses moving and indicator plots an arrow. Main indicator's adjustable inputs : movingPeriod - period of moving line trendPeriod - period

Impulse fractals indicator - is counter-trend oriented complex market fractal pattern. Market creates bull/bear impulse, trend starts, fractals on impulsed wave are an agressive pullback signals. Buy arrow is plotted when market is bearish and it's impulse showed up-side fractal, and sell arrow is plotted when market is bullish and it's impulse showed dn-side fractal. Main indicator's adjustable inputs : impulsePeriod - main period of impulse histogram filterPeriod - smoothes impulse accordi

Strategy Name: Horse Trader Robot HT01 Description: Horse Trader Robot HT01 is a fully automated robot. This uses a price action strategy, advanced money management. It is most effective in trend reversal. Maintained excellent risk- reward. Tested in real accounts with profits and guarantee of profit in future. Suitable for both beginners and experienced traders. It will put trade at market price once signal generated. Once trade is activated stoploss is placed as per strategy and take

Deriv EA
New price $199 USD , future price will be $399 USD
INTRODUCTION Deriv is MT5 broker which provide a wide range of derivatives exchange to its clients. On this broker we find a number of indices which includes Volatility 10 index, Boom 1000 index, Crash 1000 index and many more. After i have been trading for 6 years on this broker i then decided to come up with an Expert Advisor to automate the process. Hence i developed this simple bot based on 2 Moving Average Cross Overs. Take you

The purpose of the Combo OnOff indicator is combine differerent tecniques and approachs to the market in order to spot signals that occur simultaneosly. A signal is more accurate if it is validate from more indicators as the adaptive expectations can be used to predict prices.The On-Off feature and alarms help to look for the better prices to enter/exit in the markets
Moving Averages are statistics that captures the average change in a data series over time
Bollinger Bands is formed by upper

Trailing Stop toolbox MQL5, better and friendly. Trailing Stop tool box using Moving Average, Parabolic SAR, Ichimoku Kijun-sen, trailing stop normal, trailing stop by candle, trailing stop by targets and trailing stop by lowest, highest candle numbers. Manage orders by currency pairs and comments, trailing one or many orders at same time. Mql4 versition: https://www.mql5.com/en/market/product/68181
Workflow: Set your comment, profit, stoploss, lotsize, t imeframes and chose indicator for begi

한국어 – Larry Connors TPS - 자동화된 트레이딩 시스템 Larry Connors TPS - 자동화된 트레이딩 시스템 버전 2.0 – Matthew Wills 제작
이 Expert Advisor (EA) 는 Larry Connors의 시간, 포지션 및 스케일링(TPS) 트레이딩 시스템 을 자동화한 것으로, 그의 책에서 처음 소개되었습니다.
“High Probability ETF Trading”
Amazon 링크 전략 개요 Larry Connors의 TPS 시스템 은 시장 되돌림(Pullback) 을 활용하여 단계적으로 포지션을 확장 하면서 최적의 리스크 대비 수익률 을 제공합니다. ETF, 현금 지수, 개별 주식 및 기타 평균회귀(mean-reverting) 자산 에 적용 가능
200일 이동평균(SMA) 위에서 거래할 때 가장 효과적
RSI 신호 및 스케일링 규칙 에 따라 매매 실행 표준 TPS 트레이딩 규칙:
1️

Floating peaks oscillator - it the manual trading system. It's based on Stochastik/RSI type of oscillator with dynamic/floating overbought and oversold levels. When main line is green - market is under bullish pressure, when main line is red - market is under bearish pressure. Buy arrow appears at the floating bottom and sell arrow appears at floating top. Indicator allows to reverse signal types. Main indicator's adjustable inputs : mainTrendPeriod; signalTrendPeriod; smoothedTrendPeriod; tre

Monitor your favorite Symbols My #1 Utility: includes 65+ functions, including this tool | Contact me if you have any questions This tool opens in a separate window: it can be moved (drag anywhere), and minimized [v]. You can adjust the Watchlist on the panel: Click [edit list] to add / remove the Symbols from the Watchlist. Calculated value: it may either be the last [closed bar], or the current [floating bar]. Select the [timeframe] for calculation. There are 2 types of the value sorti
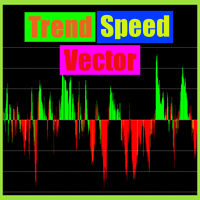
Trend speed vector - is the oscillator for manual trading. System measures trend direction and it's speed. Histogram shows 4 colors: Lime --> Strong up movement with good gain speed; Green --> Up movement with low gain speed Red --> Strong down movement with good gain speed; Orange --> Down movement with low gain speed Green and Orange histograms show weak market's movements and thуese places excluded from signal points. Buy arrow is plotted during strong down movement when bearish gain speed i

Floating gain meter is the manual trading system that works with local trends and it's scalping. Histogram represents bull/bear floating trend gain. Green color histogram shows choppy market with bullish pressure, Orange - shows choppy market with bearish pressure. Lime and Red colors shows "boiled" places in market. As a rule buy arrow is placed after strong Down movement when it's power becomes weak and choppy market starts. And sell arrow is plotted after strong Up movement when it's power

MAC_iCHIMOKU is an Indicator best for Scalping and Swing Both. It can be used for: All Pairs: Forex, Cryptocurrencies, Metals, Stocks, Indices. All Timeframe All Brokers All type of Trading Style like Scalping, Swing, Intraday, Short-Term, Long-Term etc. Multiple Chart This Indicator is based on Upcoming Trend Probability made with an unique Combination of Moving average, Ichimoku Cloud, Price Action and Support Resistance zones. If you are a Scalper or Swing Trader, then this Indicator will

Pullback points indicator - is the manual trading system, that shows most popular market prices. Indicator measures bull/bear waves pressure and looks for "consensus" prices. As a rule these points are crossed up and down very often and opened trade has several chances to be closed in positive zone. Mainly, such points is the good base for "common profit" types of strategies. Indicator also represents "common profit" scalping method of trading as default one. Main Indicator's Features Signals

Adama EA is true trend-following, optimized specifically for trading GBPJPY on timeframe M30.
This currency pair has a significant pip value, and with the right configurations, it is an ideal choice for traders seeking to capitalize on market moves. Adama utilizes one of the oldest and most reliable trading strategies used by institutional traders, and along with internal calculations Adama is designed to provide a sustainable, realistic form of investment.
To achieve maximum efficiency and ensu

Good money/risk management is more than just position sizing, it's much more. Successful traders analyze your trading activities and keep an eye on your key figures. With the help of AccountMan you can also do this very conveniently, analyze your trading activities for the purpose of professional money / risk management. Evaluate your trades by trade symbol to see if trading is profitable overall with these. Would you like to keep an eye on your individual strategies? e.g. which strategy works b

Noize Absorption Index - is the manual trading system that measures the difference of pressure between bears forces and bulls forces. Green line - is a noize free index that showing curent situation. Zero value of index shows totally choppy/flat market.Values above zero level shows how powerfull bullish wave is and values below zero measures bearish forces.Up arrow appears on bearish market when it's ready to reverse, dn arrow appears on weak bullish market, as a result of reverse expectation.


MACros is based on Exponential Moving Average Crossover:
It can be used for: All Pairs: Forex, Cryptocurrencies, Metals, Stocks, Indices. All Timeframe All Brokers All type of Trading Style like Scalping, Swing, Intraday, Short-Term, Long-Term etc. Multiple Chart
*** MT4 Version-->> https://www.mql5.com/en/market/product/87538
Notification Setting: All type of notifications and Pop-Up available with this Indicator. (Can manually ON/OFF the notification as per requirements.)
Special Note: It

"Pattern 123" is an indicator-a trading system built on a popular pattern, pattern 123.
This is the moment when we expect a reversal on the older trend and enter the continuation of the small trend, its 3rd impulse.
The indicator displays signals and markings on an open chart. You can enable/disable graphical constructions in the settings.
The indicator has a built-in notification system (email, mobile terminal, standard terminal alert).
"Pattern 123" has a table that displays signals from se
Hello! I am a professional trader with experience trading on the Forex and Moscow Exchange margin markets. Trading in total for about 14 years. For all the time of trading, I have gained tremendous knowledge, experience and understanding of the essence of the market. I want to tell you that for a beginner, the market seems like a place to make easy profits. But this is an illusion and a big mistake. The market changes all the time, volatility changes, trends are replaced by flats, and flats by t
This indicator compares volumes from the same period to previous days instead of calculating the average of previous candles, so it is possible to detect volume anomalies more accurately.
I have always been bothered by seeing very large volumes at the beginning of a trading day and almost no volume throughout the day, making volume-based strategies very limited. This indicator can verify the strength of the volume of candles based on previous days, so it is possible to perceive volumes that are

Scanner and Dashboard for Money Flow Index MT5 The Money Flow Index (MFI) is a technical oscillator that uses price and volume data for identifying overbought or oversold signals in an asset. It can also be used to spot divergences which warn of a trend change in price. The oscillator moves between 0 and 100.
Advantages of the Scanner: - Full Alert Options. - Multi Timefrare - Works for all instruments including Currencies, Indices, Commodities, Cryptocurrencies and Stocks. - Fully customisabl

This Indicator analyses the Trend and shows signals. When you open the Chart , Indicator shows you Buy or Sell Signal as Alert. Usage: Activate Algo Trading , Activate the Indicator and drag new currencies into chart. Indicator shows you Buy or Sell Signal as Alert.
Results
- Buy Signal
- Sell Signal
- No Signal For any question please don't hesitate to contact.
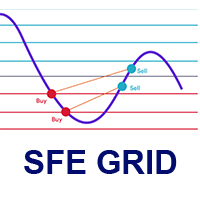
This EA is an Utility for define and execute a grid strategy. Join to the telegram group you can find in my profile page for have access to the different strategies proposed by the SFE community. BACKTEST AND LIVE The EA must be used on a M5 timeframe chart.
The current version works only in the Long side, and with symbols like BTC, ETH, GOLD, Stock Indices, STOCKS.
Do not work on Forex symbols.
This is a deliberate restriction, because the idea behind is use the strategy under 'reasona
RISK CONTROL MANAGER
Now You can have the same control over risk management as big trading rooms, institutional investors and hedge funds. Managing risk is a fundamental operation for your brokerage. Choose your maximum desired risk exposure in percentage to Your account, set it on the RISK CONTROL MANAGER, the EA will check and make sure that You'll never exceed that. When You ignore the trading risk, and you leave your operations open, that potentially could lead to catastrophic trade expos
Boleta de Operação que funciona para o Mercado B3 feita para Mini Indice e Mini Dollar com Cálculo de Risco e Retorno da Operação. Características e informações: Ao colocar o EA no gráfico inicialmente serão apresentados 1 painel e 3 linhas todos com informações a respeito de operações, saldo e cálculo que facilitam o Trader a ter um operacional mais seguro e menos arriscado. O intuito desta ferramenta é fornecer dados em tempo real para que o Trader (ANTES MESMO DE ABRIR A ORDEM) consiga obter

MMD의 다이아몬드
Diamond by MMD는 가격 행동에 중요한 장소를 식별하는 고급 지표입니다. 이 표시기는 모든 시간대에서 차트의 가격 반응 영역을 감지하고 표시합니다. MMD 방법론에서 지식 피라미드의 요소 중 하나인 다이아몬드는 매우 엄격한 조건을 충족하는 양초입니다. 다이아몬드에는 두 가지 주요 유형이 있습니다. - 표준 다이아몬드 - 역 치매. 이 두 모델은 자동으로 식별되어 차트에 표시됩니다. 지표는 예를 들어 H1 간격의 M5 간격에서 다이아몬드를 표시할 수 있습니다. 지표의 기본 설정은 현재 차트가 열려 있는 기간에 다이아몬드를 표시합니다.
표시기 매개변수에 대한 설명입니다. 표준 다이아몬드 사용 - 모델 00100에서 다이아몬드를 표시하거나 숨깁니다. 반전된 다이아몬드 사용 - 모델 0010100에서 다이아몬드를 표시하거나 숨깁니다. 다이아몬드 시간 프레임 - 다이아몬드가 표시되는 간격을 지정할 수 있는 옵션입니다. 예를 들어 M1 또는 H1 캔들로 차트에

Time Line by MMD is a simple indicator that supports historical data analysis and trading on statistical models that follow the MMD methodology.
Start Time - specifying the time when we start analyzing and playing the MMD statistical model Time Duration in minutes - duration of the model and its highest effectiveness (after the end of the line, the price returns - statistically - to the set level) Lookback days - the number of days back, subjected to historical analysis Base Time Frame - the b

Fully automated trading system - No manual intervention required.
This algorithm, developed in Switzerland, specializes in buying and selling the EURGBP currency pair within seconds and trades for you around the clock.
See for yourself and use our demo version to experience the full power of our Expert Advisor (EA).
How do you generate your passive income?
Asset: EURGBP
Settings: See screenshot below
Starting Lot: Aggressive 1000.- USD per lot 0.01 (~15% profit p.m.)
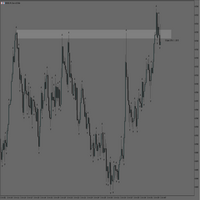
MT5 Rectangle Extender Indicator is a simple and easy tool that automatically extends any box/rectangle drawn on the chart to the right edge of the screen. This tool can be used for easy drawing of zones and can help with determining future areas of interest on the chart once price trades back to those levels. Very suitable for supply and demand, order blocks, POI's (Points of Interest) mapping on charts. Sometimes its better to have a zone than a single price level as price can shoot above or
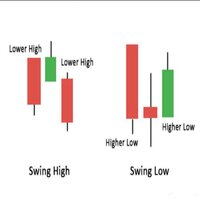
This indicator plots any and every swing high or swing low on your chart.
A swing high or low candle formation comprises of a minimum of 3 candles whereby the middle candles high/low is the highest or lowest point amongst the three candles. The direction (bullish/bearish) of the middle candle is irrelevant. Swings are very useful patterns that can be used to determine market structure as well as potential price reversal points on a chart.
This indicator is derived from the Bill Williams Fracta
The effectiveness of the adviser is confirmed by trading on a real account. Signal https://www.mql5.com/ru/signals/1986060 The Invest Time President Expert Advisor uses many different strategies, including mean reversion, trend following, and a smart grid system with variable take profit levels that adapt to market conditions. Unlike conventional grid systems, where the risk is very high compared to the potential profit, Invest Time President will open trades only under suitable market conditio

"The Holy Banker"에 대한 자세한 정보는 영어 설명을 읽어 주세요. 영어 설명에는 이 트레이딩 로봇이 시장 조건에 따라 다양한 입증된 전략을 사용하는 방법, 사용되는 자산, 최소 예치금 요구 사항, 레버리지 비율 등 중요한 정보가 포함되어 있습니다. 영어 설명을 읽으면 "The Holy Banker"가 어떻게 거래 효율성을 향상시키고, 스트레스를 줄이며, 더 많은 자유 시간을 얻고, 거래를 자동화할 수 있는지 이해할 수 있습니다. 일관된 수익을 얻고 거래 성공률을 높이는 솔루션을 찾고 있다면, "The Holy Banker"는 당신에게 적합한 시스템입니다. 이 시스템은 전문적인 거래 환경에서 장기적인 성공을 원하는 트레이더를 위해 특별히 설계되었으며, 거래에서의 다양한 도전을 극복하는 데 도움을 줍니다. "The Holy Banker" 커뮤니티에 가입하면 다른 성공적인 트레이더들과 교류하고, 더 많은 전략을 배우며 거래 기술을 향상시킬 수 있는 기회를 얻을 수 있습니다

Outbreak is a fully automated robot that follows breakouts in EURUSD. It opens several trades a day and closes them the same day. Always just one order open with StopLoss. More than 80% of the trades are profitable in historical backtests and in the Live trading signal >>
Live tradingl of the second strategy here >>
NO m artingale, grid trading or other dangerous method used, that at the end erases your account. Usually Outbreak is scalping the market, cutting small profits f
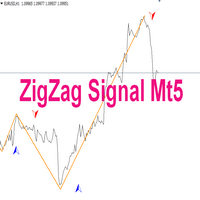
Indicator description: Indicator - ZigZag Signal is created on the basis of a well-known and popular indicator - ZigZag. The indicator can be used for manual or automatic trading by Expert Advisors. 1. The ZigZag Signal indicator has alerts of different notifications for manual trading. 2. If used in Expert Advisors, the indicator has signal buffers for buying and selling. You can also prescribe and call the indicator as an external resource and other settings and applications: (email me in a

Expert Advisor for Automatic Stop Loss and Take profit , calculated by Pips and cover all major pairs . you can activated the EA in your chart then place orders manually and the EA will be place TP and SL automatically for all opened orders , covered Buy market , Sell Market , Buy stop , Sell Stop , Buy limit , Sell limit . it is an easier tool that help you manage your order without effort . 10 Pips = 100 Points Pending orders SL and TP will be placed once order is activated . MT4 Version : ht

Xtrade Trend Detector is an indicator capable of finding the best opportunities to take a position in any stock market. Indeed, it is a great tool for scalpers but also for Daytraders. You could therefore use it to identify areas to trade, it fits easily on a chart. I use it to detect trends on Big timeframes and take positions on Small timeframes. Don't hesitate to give me a feedback if you test it.

Promotion $66 lifetime for you.
The principle of this indicator is very simple: detecting the trend with Moving Average, then monitoring the return point of graph by using the crossing of Stochastic Oscillator and finally predicting BUY and SELL signal with arrows, alerts and notifications. The parameters are fixed and automatically calculated on each time frame. Example: If you install indicator on EURUSD, timeframe M5: the indicator will detect the main trend with the Moving Average on this ti
MetaTrader 마켓은 MetaTrader 플랫폼용 애플리케이션을 구입할 수 있는 편리하고 안전한 환경을 제공합니다. Strategy Tester의 테스트를 위해 터미널에서 Expert Advisor 및 인디케이터의 무료 데모 버전을 다운로드하십시오.
MQL5.community 결제 시스템을 이용해 성능을 모니터링하고 원하는 제품에 대해 결제할 수 있도록 다양한 모드로 애플리케이션을 테스트할 수 있습니다.
트레이딩 기회를 놓치고 있어요:
- 무료 트레이딩 앱
- 복사용 8,000 이상의 시그널
- 금융 시장 개척을 위한 경제 뉴스
등록
로그인
계정이 없으시면, 가입하십시오
MQL5.com 웹사이트에 로그인을 하기 위해 쿠키를 허용하십시오.
브라우저에서 필요한 설정을 활성화하시지 않으면, 로그인할 수 없습니다.