MetaTrader 5용 Expert Advisor 및 지표 - 102

1. Why did I develop this series of indicators
I found that most traders need to use multiple time frame indicators. They usually switch time frame to see indicators. However, once the timeframe is switched, you cannot see the corresponding relationship between the price in the smaller timeframe and the indicator in the larger timeframe . For example: if your price chart is in H1 timeframe, you can see H4, D1 and W1 indicators in H1 timeframe Chart. This is more helpful for you to find th



Running in AUDUSD, automatic trading USDCAD and UCDNOK, EA is a trend hedging strategy, not doubling, not gridding, not too many parameters need to be adjusted simply and practically. Parameter settings: Transaction: EA only works when Transaction=true. Lots: order quantity. SL_money: A list of all currencies to be liquidated in a unified way for the amount of losses. Less_stop: If the net value is less than what, the warehouse will not be opened. Recommended platform: ECN, other platforms with

1. Why did I develop this series of indicators
I found that most traders need to use multiple time frame indicators. They usually switch time frame to see indicators. However, once the timeframe is switched, you cannot see the corresponding relationship between the price in the smaller timeframe and the indicator in the larger timeframe . For example: if your price chart is in H1 timeframe, you can see H4, D1 and W1 indicators in H1 timeframe Chart. This is more helpful for you to find th

Hello all friends What I will present today is a grid system that doesn't have grid. Its work is Open to buy and sell at the same time. Or choose to open either side in the settings. The weakness of this system is that when the graph runs one way for a long time, it is very damaged. I have prepared a function for reducing damage.Details about how to set up according to the youtube link.

Attention: New update - 4 major practicality improvements!
1) Alarm 2) Midas text value 3) Click panel 4) Can be connected to an EA to operate in semi-automatic mode
Attention - This indicator does not work perfectly in backtest due to MT5 peculiarities (Reading hotkeys or panel clicks) . My suggestion is that you test Automatic Vwap Midas which has automatic operation to analyze the calculation and then buy Start if you think the indicator will match your operating.
This indicator is use

Just $10 for six months!!!. This will draw Order Blocks just by clicking on a candle. It will use the body or the wicks. It can also draw the mean threshold of the candle open/close or high/low. As a drawing tool, it is not active all the time after adding it to the chart. Activate by pressing 'b' twice on the keyboard within a second. If activated but then decided not to draw, deactivate by pressing 'b' once. Box color depends if candle is above or below current price. Settings/Inputs: Number

Just $10 for six months!!! Displays previous weeks Highs & Lows. You can set the number of weeks to display levels for, also the line style, color and width. This is very useful for traders using the BTMM and other methods like ICT. I'll be creating more indicators for MT5 for the BTMM. Send me your suggestions to my Telegram: https://t.me/JDelgadoCR Take a look at my other products at: https://www.mql5.com/en/users/jdelgadocr/seller

Just $10 for six months!!! Displays previous days Highs & Lows. You can set the number of days to display levels for, also the line style, color and width. This is very useful for traders using the BTMM and other methods like ICT. I'll be creating more indicators for MT5 for the BTMM. Send me your suggestions to my Telegram: https://t.me/JDelgadoCR Take a look at my other products at: https://www.mql5.com/en/users/jdelgadocr/seller

Strategy Description: This EA is a trend EA. The idea is the simplest trading method of chasing up and down. It is used to cut off losses in time with mobile stop loss to make profits run. This EA mainly trades EURUSD and XAUUSD. Parameter settings: Transaction: EA will only work if Transaction=true. Lots: Single hand count, it is recommended to order 1 standard hand at 10000USD, i.e. 0.1 hand at 1000USD. Maxi_point: Maximum point difference limit. It depends on the decimal number of gold quotat

The DYJ Williams Percent Range is a unique High quality and easy to use and affordable trading tool because we have incorporated a number of proprietary features and Williams' Percent Range indicators. The Indicator values ranging between -80% and -100% indicate that the market is oversold. Indicator values ranging between -0% and -20% indicate that the market is overbought. Input Parameters WPR settings InpSpread = 50 -- When the spread is greater than or equal to 50, the signal is ignor

The expert trades at the opening of the market after the weekend, focusing on the price gap (GAP). Various sets of settings are ready (trading against or towards the GAP). At the same time, various options are available in the expert settings, allowing you to create your own unique sets yourself. Download settings (sets): https://www.mql5.com/en/blogs/post/747929 Currency pairs for which the sets have been developed: GBPUSD, AUDUSD, NZDUSD, USDCAD, EURGBP, EURCHF, GBPCAD, GBPAUD, AUDCHF, AUD
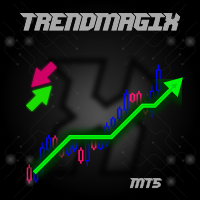
Unique trend trading algorithm with advanced filtering and many features which should become a part of your trading arsenal. This indicator can give you also trading advisors (with take profit target), success rate scanner and much more.
Important information
For additional detailed information you can visit the 747Developments website.
Features Easy to use (just drag and drop to the chart) Possible to use with any trading instrument Possible to use on any time-frame Take profit advisors Succ
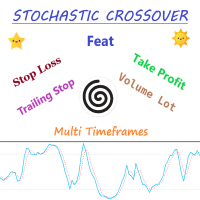
Expert Advisor Description - Basically, EA will open position in case of cross between main line and signal line on stochastic. - Unique to this EA, using the two pre-set stochastic so that the EA can open the trade position. - The first stochastic determines the cross, while the second stochastic determines the overbought or oversold levels.
Parameters Description - Volume_Lot => Number of lots determined from the balance percentage. Example Balance = 1.000 USD, Volume Lot = 100, Then lot i

Stairway to heaven It is an advanced trading system. This is a fully automatic Expert Advisor. ONLY TWO INPUT TO SELECT FOR THE TRADER 20 YEARS BT IN DIFERENT PAIRS Stairway to heaven . It is a 100% automatic system, the system controls both the inputs and the batches, the operator just has to place the robot on the graph and let it act It is an ideal system for people who do not want complications or strange configurations. The system is self-sufficient, performing all the work.

The indicator shows Profit Zones on the chart, displaying the beginning and end of the local trend Profit Zone PRO is perfect for all Meta Trader symbols: currencies, metals, cryptocurrencies, stocks and indices
Advantages of the Profit Zone PRO indicator:
Input signals without redrawing The algorithms of the indicator allow you to find the ideal moments to enter a transaction (purchase or sale of an asset), which increase the success of transactions for 100% of traders. The indicator has two

Expert Advisor Description Strategy using two classic indicators in MetaTrader, stochastic oscillator and moving average Accompanied by multi timeframe and parameter that can be changed according to the strategy that suits you
Feature Money Management : Stop Loss, Take Profit, Trailing Stop Trading Option : Stochastic Oscillator, two Moving Average, Multi Timeframes https://youtu.be/3dXAUUnxg1s
youtubeembedcode.com/pl/ http://add-link-exchange.com

This indicator is based on the ICCI.
If a long pattern is detected, the indicator displays a buy arrow.
If a short pattern is detected, the indicator displays a sell arrow. Settings
CCI Period - default set to (14) Features
Works on all currency pairs and timeframes
Draws Arrows on chart Colors
Line Color
Line Width
Line Style
Arrow Color This tool can help you analyse the market and indicates market entry.

Backtest from 2015-2019 MetaQuotes Data Every Tick Mode.
Start depo 10000 USD Lot size: 0,5 (You can modify it but maintain the ratio)
EA created for EURUSD M15
Open transaction based on RVI + Momentum + MA Crossover
Close transaction based on Stochastic
The parameters of indicators have been optimized.
Change manually only lot size.
EA does one transaction at the time.
No adding position, no martingale, no grid.
To avoid risky situations.
Fell free to increase lot size while you
The DYJ Average Directional Movement Index is a unique High quality and easy to use and affordable trading tool because we have incorporated a number of proprietary features and Average Directional Movement Index indicators. The DYJ ADX recommends buying when +DI is higher than -DI, and selling when +DI sinks lower than -DI. MT5 real account video demo: https://youtu.be/McRzAkyP5I0 Input Parameters ADX settings InpADXPeriod = 14 -- ADX: averaging period InpADXLevel = 40 -- ADX Level

The DYJ Moving Average Cross is a unique High quality and easy to use and affordable trading tool because we have incorporated a number of proprietary features and Moving Average indicators. The Indicator is based on the following idea: crossing of two Moving Average lines (Fast and slow ) is used as a signal for opening and closing a position together. Go Long when Fast MA (MA1) crosses above Slow MA (MA2). Go Short when Fast MA (MA1) crosses below Slow MA (MA2). The EA uses dynamic alloca

Ondas de Divergência. Antes do mercado tomar um sentido e se manter em tendencia, existem sinais que podem ser lidos, nos permitindo assim entender o "lado mas forte", e realizar trades de maior probabilidade de acerto com risco reduzido, esses movimentos são persistentes e contínuos, proporcionando excelente rentabilidade. Ondas de Divergência é um histograma que acumula a divergência de entre preço e volume a cada tick, permitindo assim encontrar pontos de absorção, áreas de acumulo e distrib

We all dream of becoming a foreign exchange trading expert, making a lot of money and having a large number of trading fans who adore us. There seems to be only one thing standing in our way: actually learning how to enter and leave the foreign exchange market. Most trading strategies put their emphasis on finding out when to enter the market. Whether it’s technical or fundamental, everyone is looking for an entry signal. However, this only covers half of the trade. As any trader knows, there ar

Institutional Levels is an intelligent, fully automated Expert Advisor. This algo is arranged in such a way that the EA uses levels of importance combined with price action, without reliance on indicators. The strategy behind it is based on the teachings of a professional traders, and ex traders. It will find untested levels at which institutions are known to be interested in, in the number of candles you’ve set and will make trades based on these levels, re-test and trend. It will automaticall
Boleta de negociação, adiciona automáticamente as ordens Take Profit e Stop Loss quando excutada uma ordem de compra ou venda. Ao apertar as teclas de atalho (A, D, ou TAB), serão inseridas duas linhas de pre-visualização, representando as futuras ordens de take profit (azul) e stop loss (vermelho), as quais irão manter o distanciamento especificado pelo usuário. Ditas ordens só serão adicionadas ao ser executada a ordem inicial. Ao operar a mercado, as ordens pendentes de take profit, e stop lo

Stop Loss with Profit
This utility / expert for MetaTrader 5 modifies the stop loss of all your operations dynamically and automatically to ensure the minimum benefits you want, and be able to operate with or without Take Profit.
Maximize your benefits, by being able to trade with Unlimited Take Profit. You will ensure the number of minimum points you want to earn in each operation and the stop loss will be adjusted as long as the benefit of the operation grows.
For example: you open a purcha

스캘핑 스킬은 조용한 시간을 위한 안전한 스캘핑 전문가 어드바이저입니다. 숙련된 트레이더와 초보자 모두에게 적합합니다. FIFO 요구 사항이 있는 미국 중개인을 포함한 모든 중개인과 협력하여 우선 이전에 열린 거래를 마감합니다. EA는 Martingale 또는 order grid를 사용하지 않습니다. 모든 주문에는 가상 손절매가 수반되며 1포인트부터 핍으로 이익을 얻을 뿐만 아니라 손익분기점 및 추적 정지 기능이 있습니다. 차트는 주문 실행 속도와 슬리피지에 대한 정보를 표시합니다. 계산 기간은 EA 설정에서 설정됩니다.
MT4 버전: https://www.mql5.com/en/market/product/36925
권장 사항 실제 돈으로 사용하기 전에 센트 거래 계정에서 최소한의 위험으로 고문을 테스트하십시오. 최소 보증금 - 0.01 로트에 대해 $ 300;
고문은 귀하의 예금을 보호합니다. 연속된 무익한 주문의 수가 지정된 값 을 초과하면 EA는 무익한 거래를

The DYJ ThreeMACross is based on three Moving Average indicators. ThreeMACross is based on the following idea: crossing of three Moving Average lines (Fast, Middle and slow ones) is used as a signal for opening and closing a position together. Go Long when Fast MA (MA1) crosses above Middle MA (MA2), and Middle MA (MA2) crosses above Slow MA (MA3). Go Short when Fast MA (MA1) crosses below Middle MA (MA2), and Middle MA (MA2) crosses below Slow MA (MA3). The Expert Advisor also features money m
DYJ GlobalForexTradeWarPowerSignalMT5는 지표 PowerSignal을 기반으로 합니다. 모든 통화 쌍 및 기간에 사용할 수 있습니다.
PowerSignal은 추세 강도가 75%에서 100%보다 높을 때 최상의 진입점을 권장합니다.
EA는 여러 통화와 여러 시간대를 분석하고 내장된 지표 PowerSignal 지표를 기반으로 최상의 진입점을 선택합니다. 혁신적인 저가와 고가의 위치에 따라 입구 가격을 결정하다. 대부분의 거래 전략은 시장에 진입할 시기를 찾는 데 중점을 둡니다. 기술적인 것이든 근본적인 것이든 모두가 진입 신호를 찾고 있습니다. 그러나 이것은 거래의 절반에 불과합니다.
모든 거래자가 알고 있듯이 모든 거래에는 시장 진입과 시장 퇴출의 두 부분이 있습니다. 틀림없이 이러한 작업 중 더 중요한 것은 마지막 작업입니다. 그것이 궁극적으로 이익을 얻거나 손실을 중지하기로 결정하는 곳이기 때문입니다.
따라서 이제 역사의 가격 차트가 아닌 통화
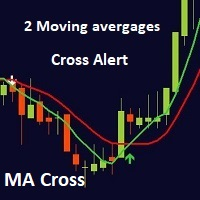
MA cross ALERT MT5 This indicator is a full 2 moving averages cross Alert ( email and push notification "mobile" ), 2 MA with full control of MA method and applied price for each moving average "slow and fast", -simple, exponential, smoothed, linear weighted. - close, open, high, low, median price, typical price, weighted price. you can modify periods as well for both MA. For any suggestions don't hesitate, thanks

The indicator shows: Average ATR over a selected number of periods Passed ATR for the current period (specified for calculating ATR)
Remaining ATR for the current period (specified for calculating ATR) Remaining time before closing the current candle Spread The price of one item per lot The settings indicate: Timeframe for calculating ATR (depends on your trading strategy) Number of periods for calculating ATR The angle of the chart window to display Horizontal Offset Vertical Offset Font size

Pulsar it is a Secure Automated Software for trade Forex market and indices.
The architecture is a Fully Automatic Autonomous Robot Expert capable of Independently analyzing the market and making trading decisions.
Pulsar It is an advanced trading system. This is a fully automatic Expert Advisor.
NO INPUT TO SELECT FOR THE TRADER ALL AUTO MATED
THIS SYSTEM IS ALWAIS IN THE MARKET IN THE TWO DIRECCTION MAKE WINING CYCLES
PULSAR . It is a 100% automatic system, the system controls
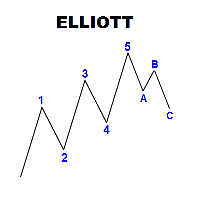
Panel with a set of labels for marking the Elliott wave structure. The panel is called up by the Q key, if you press twice, you can move the panel according to the schedule. The panel consists of seven rows, three colored buttons, each of which creates 5 or 3 labels of wave marking. Correction, consist of 3 tags, or five with a shift, you can break the chain of tags when installed by pressing the Esc key The optimal font for labels is Ewapro, write me a private message and I will give it to you

복사기 MT5는 하나의 컴퓨터 또는 VPS 서버에 설치된 여러 MetaTrader 4(MT4) 및 MetaTrader 5(MT5) 계정 간의 거래를 가장 빠르고 안정적으로 수행하는 복사기입니다. 트랜잭션은 MASTER 계정에서 SLAVE 계정으로 복사되며 0.5초 미만의 속도로 텍스트 파일을 통한 정보 교환으로 인해 복사가 발생하며 매개 변수를 구성할 수 있습니다. 거래 복사기는 MASTER 계정의 모든 변경 사항을 높은 정확도로 제어하고, SL 및 TP 수준을 조정하고, 부분 및 전체 주문 마감, 보류 주문 수정 등을 지원합니다.
복사기는 인터넷이 아닌 동일한 컴퓨터의 터미널 간에 작동합니다! MT4와 MT5 단말기 간의 거래를 복사하려면 두 버전의 제품을 모두 구매해야 합니다.
MT4 제품 버전: https://www.mql5.com/en/market/product/45791
이 거래 복사기가 할 수 있는 것: 한 계정에서 여러 계정으로 또는 여러 계정에서 하나

Extended version for MetaTrader5 of famous Yellow Expert Advisor . The fully automated Yellow MT5 Hedge EA works on short-term trend changes creating the price channel set in the parameters. Trading is carried out at the external borders of this channel by opening positions in different directions with different lot sizes. The strategy is simple, but effective. With adequate money management, the probability of stable earnings is very high.
Presence of a sufficient number of parameters allows

THE GOAT INDICATOR ON THE MQL5 MARKET! ️ GET THIS INDICATOR AND STOP LOOKING FOR ANOTHER INDICATOR ️ ️ GET IT NOW BEFORE PRICE INCREASE! ️ SPECIAL DISCOUNT FROM 138$ -> NOW ONLY 88$!!! 2020 Breakthrough Indicator! Imagine that indicators can move the price/market! This indicator use for predict price movement! Using special algorithm for predicting the next price movement! This indicator can be used in any timeframes and any symbols! You can use it for binary option signal

The Expert Advisor analyzes tick micro-signals and determines the direction to open a position. Micro-signals are identified by predetermined codes, which in the optimization are recorded in the settings of the bot. When a bot sees the corresponding micro-signal, it reacts to it by opening a position and its accompaniment! The bot has good predictability. You can check the work of the bot on the simulation of real history, how to configure the tester will be shown in the screenshot. Also, we sh

Probably almost every trader at least once, but dreamed about non-lagging MAs. I embodied this dream in my indicator. Using this indicator, you can predict future values. But the main application of the indicator is to generate buy and sell signals.
Determining the market trend is an important task for traders. The Trendometer indicator implements an advanced algorithm for visualizing the market trend. The main purpose of the indicator is to assess the market. The indicator is designed to iden
Советник локирует убыточную позицию или сетку с указанным Magic number и в дальнейшем пытается свести убыток к нулю, или минимуму. Продолжительность операции зависит от параметров советника и может продолжаться от нескольких дней до нескольких месяцев. Параметры советника и их назначение: What position is locked Какого направления позицию или сетку позиций локируем. Buy или Sell.
Magic number Magic number позиции которую локируем. Width lock

EA is parsing trade signals from Telegram bot and executes it in MT5 terminal. To configure you need to complete the following steps: Specify the bot tokein in input settings. Specify a list of key words used for detecting a type of signal (Buy/Sell), for entry price and for stops. Specify default settings for stops and lot size in case incoming signal don't include these details.

Trade control panel for MetaTrader 5. Modified version of the panel from the article https://www.mql5.com/en/articles/4727 . Based on EasyAndFastGui library. Added option to close positions and trades separately. Can be used for controlling other EA which is running for example in VPS. More functionaly will be added with the future updates. No input parameters, just run EA as normally and enjoy. The window can be minimized.

Shoulder 1:500 0.01 - Lot of the first warrant for each Control Balance of $ a deposit 100 - Maximum lot 50 - Stop Loss in points 20 - Take Profit in points 40 - Distance to the averaging warrant in points 400 - The size of means for calculation of the first lot 2 - Multiplication coefficient for the warrant 124 - Magic number false is Printing of notices 0 - The commission for a tester and optimization

This expert places pending stop orders using the Hammer and Shooting Star candle patterns at trade levels calculated using highest and lowest price from the last 40 candles combined with Bar Range . It is a long term expert and is especially made for the GPB/USD pair , M 15 timeframe . All positions have Stop Loss and Take Profit and the option to be closed at the end of the day . Lot size may be fixed or % of the account balance . If Risk Percent parameter is left to zero , the EA will use th

Martha is an Expert Advisor (EA) that built based on grid method.
The idea is place buy or sell simultaneously when they are negative, wait and take the profit when the price is going back or passed the TakeProfit value. So this EA requires user adjustment setting itself between OrderLots with balance are used in the account. If you set TakeProfit value is negative, so this EA will waiting profit until price going back to the first price where order has been taken.
But the new order will be t

Indicator to mark the opening of the current day, and also the high, low and close of the previous day. It is possible to define which markings will be made and also the colors for each of the markings. It can be used in various trading assets such as Futures Markets, Stock Market, Forex, etc. You can choose to mark just the current day or for all days. When selected to mark only the current day, only that period will be marked on the graph. The markings that this indicator makes are very relev

Expert Advisor Description ErusFX 1 Percent Hunter is a simple expert advisor based on stochastic oscillator that will collect sell and buy positions until the profit condition is reached by 1%. Pairs recommendation : EURUSD TimeFrames : H4 Please backtest various variations of the EA settings to get the result that suits your desired
Setting Description Volume =====>>>>> Set Lot from balance, example balance 1.000, volume 100 than lot is 0.01, example balance 1.000, volume 300 than lot is 0.0

The indicator allows you to simplify the interpretation of signals produced by the classical MACD indicator.
It is based on the double-smoothed rate of change (ROC).
Bollinger Bands is made from EMA line.
The indicator is a logical continuation of the series of indicators using this classical and efficient technical indicator.
The strength of the trend is determined by Bands and main line.
If the bands width are smaller than the specified value, judge it as suqueeze and do not recommend tra
DSeize
DSeize - это индикатор для совершения покупки/продажи в MetaTrader 5. Простой и понятный индикатор, показывающий точки входа в рынок. Прекрасно подходит как для начинающих, так и для профессиональных трейдеров. Рекомендуемый таймфрейм H1. Рекомендуемые валютные пары: Мультивалютный. Работает как на 4-х, так и на 5-и значных котировках. Сигналы индикатора не перерисовываются. Особенности Вход совершается при закрытии часовой свечи и появлении индикатора.
Сигналы не перерисовываются. Сигн
MetaTrader 마켓은 과거 데이터를 이용한 테스트 및 최적화를 위해 무료 데모 거래 로봇을 다운로드할 수 있는 유일한 스토어입니다.
어플리케이션의 개요와 다른 고객의 리뷰를 읽어보시고 터미널에 바로 다운로드하신 다음 구매 전 트레이딩 로봇을 테스트해보시기 바랍니다. 오직 MetaTrader 마켓에서만 무료로 애플리케이션을 테스트할 수 있습니다.
트레이딩 기회를 놓치고 있어요:
- 무료 트레이딩 앱
- 복사용 8,000 이상의 시그널
- 금융 시장 개척을 위한 경제 뉴스
등록
로그인
계정이 없으시면, 가입하십시오
MQL5.com 웹사이트에 로그인을 하기 위해 쿠키를 허용하십시오.
브라우저에서 필요한 설정을 활성화하시지 않으면, 로그인할 수 없습니다.