MetaTrader 5용 새 Expert Advisor 및 지표 - 83

[Google Translation] Trader Trainer is a robot capable of supervising your operations depending on a series of configurable rules. The configurable rules are: Virtual Initial Capital It allows you to define the amount of capital with which you want to start the training. It must match the capital of the demo account on which the training will be carried out for correct operation.
Profit Target You must achieve at least the profit target set to pass the training.
Trailing Drawdown Yo

This is a utility that helps you close market orders and pending orders (optional), using keyboard shortcuts. For me, it's more convenient and faster than clicking a button on the chart. You can set: Keyboard Shortcut Hotkey: You can change and use most of the keys on the keyboard.
Key combination (Ctrl, Shift) also available in case you want to use
(Note that not all combinations work). Magic Number Symbol: All Symbol, or Current Chart Symbol, or Select Symbol List Close Pending or

The "Morty" Expert Advisor is designed primarily for the M5 timeframe and the main currency pairs. The Expert Advisor actively uses the Martingale method in conjunction with three indicators "Moving Averages Crossover", "Top Bottom Price" and "Moving Average". Below are the tests for the EUR/USD M5 and GBP/USD M5 pairs for the period from 2018. Each trade is protected by a Stop Loss and Take Profit. In the parameters of the Expert Advisor, you can change the lot size, indicator values, Stop Loss
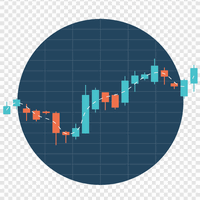
Some traders are guided by trading sessions during trading. Figure 1 shows the average price swing over one week. It can be seen that trading sessions on different days differ in their duration and activity. This indicator is designed to estimate the average price movement at certain intervals within a weekly cycle. It takes into account price movements up and down separately from each other and makes it possible to determine the moments when high volatility is possible in the market. On the ch

RSI Martingale is simply based on the RSI indicator. You can avail it for an affordable price right now because SET and OPTIMIZATION files are not yet available. The rules of the EA is when the indicator reaches the overbought condition, it will open a sell position and buy when the indicator reaches the oversold condition. When the trade is lost, the EA will trade the same position with a doubled lot size.
FREE

FX Advanced MT5 is a strategy from a well-known group EA Nation. It has been widely used by a large group of traders and by other trading communities. It opens a hedge trade for every new candle and opens grid when the position is on the losing side of the trade. This EA is designed to operate on the GBP/USD to make the best profits. If you have some questions, contact me directly or send me an email at jyutig1234@gmail.com .

If you can not create a background image for yourself (photo size and format must be changed), let me know. I make your photo for free. Otherwise, you can read the help file . A tool for chart management You can change the background image You can change the background color Change the color of the candles Volume colors, line charts and everything else You can also enable and disable some items Read the help file for more information
Settings:
Save Changes After Remove Tool
Back Ground
FREE

Have you bought a trading advisor, subscribed to a signal, or are you trading manually ?! Don't forget about risk management.
EA Hedger is a professional trading utility with many settings that allows you to manage risks using hedging.
Hedging is a trading technique that involves opening opposite positions to those already open positions. With the help of hedging, the position can be completely or partially blocked (locked).
For example, you have three open positions on your account: EURUS
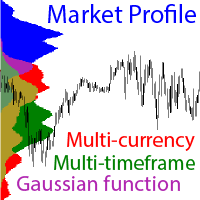
MT4 version - https://www.mql5.com/en/market/product/70776 Attention ! For correct work you need to download data for all instruments in all t imeframes ! The ability to display multiple currency pairs. The a bility to display data from smaller timeframes on the current chart. For example, displaying data from the M1 period on the H1 chart. Calculation of values using the Gaussian f unction (normal distribution formula). Flexible system of settings. Settings : symbol 1 – The Name of the

Trade in EURUSD: is a system to trade in EURUSD in 1 min. Can used in other pairs and timeframe, but is desing to EURUSD 1min.
Is easy to used, only select your initial lotaje, recomended 0.01 for every 3000$ of equity The system consists of a complex algorithm with multiple paths that can be activated in parallel or sequentially. All this algorithm is controlled by the autonomous maintenance system. The system detects a possible entry and starts a cycle, depending on the evolution of the mar

The Panel will read the floating profit/loss for the symbol of your chart and will plot the profit/loss numbers on the chart. It will work with manual trades or trades made by any expert advisor. The Panel shows the Max Drawdown in the base currency, floating profit/loss for both buy and sell orders. It will also show the same in Pips. The Panel is movable on the chart, so you can drag it using the mouse cursor.
FREE

Monkey Lite offers the following array of features: One-click instant order entry (short or long). Track total current orders and total current profit. Instant Close Buy, Close Sell, Close All button. Utility types Risk management, Graphical objects, Panels. Main features
Take Profit and Stop Loss by money (not pip). After the price reached the Take Profit threshold, trailing stop 20% of the current profit. After the price reached the Stop Loss threshold, the orders will be closed immediately.
FREE

The EA trades on the DERIV Broker SYNTHETIC instruments: Boom 500 Index, Boom 1000 Index, Crash 500 Index, Crash 1000 Index . Select the instruments accordingly in the input section. The EA waits for extreme events and profits when things normalize. Frequency of trades is between 1 to 8 trades per week depending on opportunities identified as " High opportunity " and " Normal opportunity ". High opportunity trades are 3 times normal volume. EA has one other input " betsize_percentage " . Th

Smartingale EA is a trading system that can operate martingale levels based on Ichimoku clouds . It´s possible to configure Ichimoku indicator, as soon as martingale parameters. Smartingale EA is optimized for EURUSD , M15 , but it can also be optimized for other pairs and timeframes. Download it now and let it trades. Let me know if you wanna some other set files! PM!

Stochastic force is an advanced version of the stochastic oscillator. Instead of using the regular price a more efficient price data is provided as an input for the oscillator which takes into account the price efficiency, volume and market noise. Also price is pre-filtered with the selected average type and then post-filtered by a hull moving average which provides a smooth transition of the oscillator. It eliminates maximum false signals and has the potential to become an integral part of any

The indicator helps the trader in identifying potential liquidity levels. The algorithm used in this indicator checks the behavior of the asset taking into account the price levels, momentum and volume analysis. Features:- Parameters for signal optimization and alerts. Usage:- The levels formed by the indicator can be helpful to traders in identifying potential entries, breakouts or reversals. it can assist traders of technical trading background or even pure price action trading.

This indicator is a trend indicator . It is based on moving averages. Very simple and very useful. One thing to keep in mind is that it is a trend indicator , so it is better to use it when the market is trending. Use on any pairs . It is not re paint indicator . It should not be used in ranging markets . Stop Loss, Entry and Exit can also be used with this indicator. You can see how to use this indicator in the screenshots. More useful on M15, H1, H4 time frames. Thanks For All.
MT4 Version i

Pick a start time and an end time and get levels based on the high and low of that time frame. Great for trading Session open or session breakout. The indicator draws a box around the start and end time, and then draws lines that extend until the next session start. If your wanting to determine high and low before NY, you could set, depending on your brokers time zone, a start of 12:00 and end of 15:00 and it would show you the price range of pre-ny, and then you can trade based on that.

In combination with the BT you can test python strategies. The BT has a history of M1 bars from 2016 onwards (over 5 years, source DukasCopy). At this moment the history for the basic 28 instruments will be available.
All time frames are deducted from these M1 bars (M5, M10, M15, M20, M30, H1, H2, H3, H4, H6, H8, H12, D1). Stepping through the history in M1 bar increment or multiple M1 bar increments. Orders and positions will be updated every increment.
All history bars of the instruments
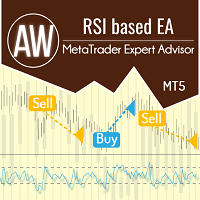
EA는 과매도 또는 과매수 상태에서 발생하는 가격 수익에 대해 거래하고 RSI 오실레이터에서 신호를 받으면 포지션을 엽니다. 시스템에는 많은 시나리오와 유연한 구성이 있습니다. 평균화, 첫 번째 및 마지막 바스켓 주문 마감 기능 및 자동 로트 계산 기능을 사용합니다. 고급 대시보드와 세 가지 유형의 알림이 있습니다. 문제 해결 -> HERE / MT4 버전 -> HERE / 지침 -> 여기 이점:
쉬운 설정 및 직관적인 패널 인터페이스 구성 가능한 표시기 신호 모든 유형의 악기 및 모든 기간에 적합 필요한 경우 평균화 사용 내장된 자동 로트 계산 첫 번째 및 마지막 바구니 주문을 마감하기 위한 내장 시스템 세 가지 유형의 알림: 푸시, 이메일, 경고 전략: EA는 과매도 또는 과매수 상태에서 발생하는 가격 수익에 따라 거래하고 RSI 오실레이터에서 신호를 받으면 포지션을 엽니다. 거래 행동을 위한 다양한 옵션 구현: 오실레이터 라인이 아래
Indicator that synchronizes the charts, that is, when the asset is replaced in one of the charts, all those that appear with the synchronized indicator are changed, with the same timeframe (Same_Timeframe = true) or with different timeframes (Same_Timeframe = false). The graphics to be synchronized are identified by color (Label). To synchronize the indicators, the indicator must be inserted in all charts to be synchronized, using the same color (Label). A box with the chosen color (Label) and

The robot opens positions from Tops and Bottoms
Perform trend reversal operations.
It has 3 levels of top and bottom measurement.
Trader can open and close position on 3 strength signals.
The expert also allows you to configure the maximum loss to move along with the price (moving stop).
Know our products
Edson Cavalca Junior Systems Analyst
WARNINGS
The buyer declares himself capable of: We do not provide any trading or risk management advice, ideal configurat

The legendary scalper is on the market! PROMO PRICE - $99 (Usual price $499)
EURONIS SCALPER – THE FULL AUTOMATED ROBOT FOR FOREX MARKET
MT4 version here!
ADVANTAGES Scalping strategy without gridding or the martingale method Uses Limit Orders for entry and TakeProfit for the best execution and no slippage Uses real and virtual (hidden) StopLoss levels Hedging and Netting modes supported (market execution) Custom indicators for a more accurate market entry and exit, without waiting fo

Forex trend has always been a friend of traders, and trend indicators help to identify the trend and make the right decisions. Market Figure indicator showing the trend zone - flat, not redrawing the previous values. Most of the trading systems developed by trading gurus are based on the trend. The indicator algorithm allows you to provide fairly accurate data not only about the current state of affairs, but also to make some predictions. Reacts quickly to trend changes, clearly shows the price

Krynsha is a trend indicator, a technical analysis tool that helps determine the exact direction of a trend: either an upward or a downward movement in the price of a trading instrument. Although these indicators are a little late, they are still the most reliable signal that a trader can safely rely on. Determining the market trend is an important task for traders. With this indicator, you can predict future values. But the main application of the indicator is to generate buy and sell signals.

Direct Hint is an arrow indicator for determining the trend, which can adjust to the price. Direct Hint is one of the most interesting trend indicators. On the highs, you can get several hundred pips in one trade with the trend. The indicator shows the direction of the trend. This is an arrow tool that provides ready-made signals. If an upward trend begins, the indicator draws a blue upward arrow. At the beginning of a downtrend, the instrument shows a red down arrow.
Direct Hint takes into a

About CrashBoom Stones is an expert advisor utility that gives you a signal to catch CrashBoom drops or spikes. It shows you a Red Sell arrow on Crash to sell, and a blue arrow on Boom to buy. It also gives you an alert when an arrow is shown. Note:
The utility does not show signals for the historical data in live mode, use the strategy tester to test this utility. The arrows shown are independent to the trends pane. The trends pane is more accurate when H1 and M30 agree.
Recommendations
FREE

The indicator is designed for pair trading with 2 highly correlated instruments.
Indicator charts can be displayed as lines or histograms. There is an MTF mode, the maximum and minimum deltas for the calculated number of bars are displayed with a check for a specified minimum value. It is possible to enable the calculation of trade operations with checking the current correlation coefficient for the minimum specified, the current delta in points or percent of the maximum (minimum) delta and

This indicator is used to identify key levels where the trend in price has a greater probability of halting and possibly changing direction. Interpretation of the degree of significance of a level depends on a trader's time frame. It is great to see how the prices respect each level of this support and resistance. This Indicator works for me very well. If you have good knowledge of Price Action then you can make profitable trades with this indicator. If candle take support or resistance on any o

Crossing points of the Ihano Trend technical indicator can be used as potential market reversal points. Thus, all intersection points will be optimal points at which the movement changes taking into account the indicator period. You can adjust the settings for any symbol and timeframe. The indicator filters signals using volatility control. At a certain interval, you can choose the optimal settings for any symbol and timeframe and work with them calmly. All calculations are based on opening pric

The Fractals indicator displays on the chart only fractals with the specified parameters in the indicator settings. This allows you to more accurately record a trend reversal, excluding false reversals. According to the classical definition of a fractal, it is a candlestick - an extremum on the chart, which was not crossed by the price of 2 candles before and 2 candles after the appearance of a fractal candle. This indicator provides the ability to adjust the number of candles before and after t

This indicator, It can be applied to any financial assets: forex, cryptocurrencies, metals, stocks, indices . And This indicator base on Golden cross with custom length signal
Settings
FastSignalLength : Length of Fast Signal SlowSignalLength : Length of Slow Signal TimeFrame : Choose time frame to calculate ShowDeadCrossOnly : Show Dead Cross Channel Only ShowSignalMedianOnly : Show signal median line only when ShowDeadCrossOnly set to false alertOn : Send alert alertsOnCurrent : Alert

MaRSI Scalper & Trader The combination of moving averages and RSI This setting is flexible so it can be set with regards to user test uses 1. For scalping 2. For long time trading
features 1. Sends push notifications 2. Sends alerts on computers 3. Draws Arrows 4. Draws respective indicators (this feature will be edited in the future)
Have feedback https://t.me/Tz_Trade_Logics or just call +255766988200 (telegram/whatsApp) Head to discussion page to leave your comments Improvement are on t
FREE

Small tool that shows the number of current trades and pending trades.
An alarm threshold can also be activated and the user is informed if it is exceeded. This prevents the broker's limit for open trades from being exceeded. For example at IC Markets the limit is 200 trades at the same time. If you are not informed when this threshold is reached, the broker will no longer open new trades, which can lead to heavy losses. Must be applied to a chart.
This indicator shows No Demand and No Supply signals for high probability trade entries and exits. Very powerful when combined with specific support and resistance zones to identify turning points in the market.
No Demand – the situation of a deficit of buyers in the up-move. Possible short position. Definition: (look at the below screenshots for illustration) Signal candle volume is lower than the previous two. Signal candle is bullish. Signal candle has an upper wick/pin. Confirmation candle

The indicator Bottom Touch determines the bottom in the market, from which a rebound or a global reversal may start with a high probability. Works best on more volatile markets and H1 , H4 , D1 timeframes. Does not work on timeframes above W1.
Consists of two lines Green and Gray . Bounces from the Gray line occur less frequently, but have the highest probability of a bounce or even a market reversal. Bounces off the Green line are more frequent, but less likely to bounce.
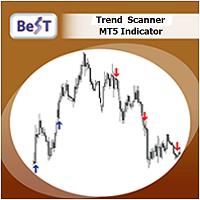
BeST_Trend Scanner is an MT5 Indicator that uses a proprietary algorithm in order to identify the most likely levels and probable moment for an upside or a downside trending price move.
BeST_Trend Scanner is a very useful tool that defines in advance and with a high statistical percentage of accuracy the subsequent Resistance & Support Levels of the anticipated upside or downside trending move of price and so
When used at its Reverse Entries Mode :
It generates Buy or Sell arrows at the

US30 Ninja is a 5 minute scalping indicator that will let know you when there is a trade set up (buy or sell). Once the indicator gives the trade direction, you can open a trade and use a 30 pip stop loss and a 30 pip to 50 pip take profit. Please trade at own own risk. This indicator has been created solely for the US30 market and may not yield positive results on any other pair.
This utility exports candle data which you chosed by input parameter to CSV file. Time Frames: M1,M5,M15,M30,H1,H4
Inputs:
StartTime: Start time for exporting data. EndTime: End time for exporting data. DataType: Close, Open, High, Low, Median(HL/2), Typical(HLC/3), Weighted(HLCC/4), Pip(H-L). DecimalSeperator: Decimal seperator for candle price data. (Default = ".") CSVDelimiter: Delimiter character for CSV file. (Default = ";") * This utility exports candle data horizontally. That
FREE

A scrolling Market Ticker that displays price changes from all symbols in the Market Watch list. Provides an easy snapshot of symbol prices, and keeps scrolling automatically while you trade and analyse the chart.
Options include: - MTF, eg choose to show price changes of the daily chart, or the hourly - use the live candle or the recently completed - font and background coloring
FREE

Индикатор показывает настроение слабой стороны и может использоваться как для внутридневной торговли, так и для скальпинга. Всё будет зависеть от контекста графика. Этот индикатор строит ценовой график в виде блоков (вертикальных прямоугольников, занимающих три ценовых уровня каждый), чем-то напоминающих ренко бары. Принцип построения основан на определённом изменении уровней BID и ASK (пояснения на скрине). При установке индикатора основной график становится невидимым и на белом поле происх
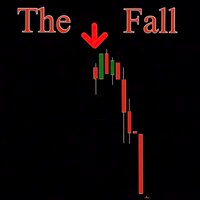
Hurry and buy before price doubles! *Non-Repainting Indicator Message Me Immediately After Purchase For VIP Installation Help and Free Trend Filter Indicator "The Fall" is an indicator that shows precise Sell reversals. A great arsenal to add to any chart. "The Fall" is designed to alert SELLS only. So Of course, Only Take The Arrows In a Downtrend Only For Best Results I Recommend www.CoinexxBroker.com as a great broker and the one I personally use *Non-Repainting *For Desktop MT5 Only *G

Magic Max EA PRO, works with Supply Demand Zones with all Currency pairs / Gold and with all timeframes. It is a new formula, and the very new features are two zone strength functions adjustable by Auto input! This is a great advantage in trading. When Candle reach to Demand zone it will take buy order and when it reach to supply it will auto take sell. This is the best EA which have indicator include to learn manual trading for newbie. We have added new feature here , now you no need to see i

Put Lion Moon to work now, this amazing and simple EA was carefully made and tested for the USD / CHF market exclusively in the 5m time frame, the purpose of this EA is to keep your capital safely and get constant profit monthly.
This EA can be used with little capital $ 100 and it works perfectly, I tried with $ 50 but it is advisable to start with a minimum of $ 100, I recommend using a VPS. You can also work a higher capital, you just have to raise the lots according to your capital, for e

WALKING ON THE CLOUD
TREND INDICATOR GREEN ARROW : UPTREND BLU ARROW : DOWNTREND
BASED ON SEVERAL TREND INDICATORS :
MOVING AVERAGE / ICHIMOKU KYNKO HYO / SUPERTREND / PARABOLIC SAR
HELP YOUR TRADING WITH THIS POWERFULL INDICATOR ! PROFITABLE IN EVERY TIMEFRAME AND IN EVERY CHART BUT THE SIGNALS ARE MORE ACCURATE IN H1 TIMEFRAME,SO I SUGGEST THIS TF RECEIVE DIRECTLY TO YOUR PHONE THE SIGNAL WHEN A NEW ARROW APPEARS PLEASE CONTACT ME FOR EVERYTHING

The only Market Ticker on the market! Add a professional novelty to your workspace, with built in mini-charts
A scrolling Market Ticker that displays price changes from all symbols in the Market Watch list. Provides an easy snapshot of symbol prices, and keeps scrolling automatically while you trade and analyse the chart. The ticker color (+/- price changes) are based on either the current or completed candle, and the previous candle.
Options include: - MTF, eg choose to show price changes o

Assistente para gerenciamento de ordens. Recursos: -> Definição de TP e SL -> Trailing Stop -> Breakeven -> Realização Parcial, manual ou automática -> Operação através de atalhos do teclado -> 3 setups possíveis, com acionamento através de atalho do teclado, permitindo níveis diferentes de TP, SL e Trailing Stop -> Definição automática ou manual do Lote -> Gerenciamento de Risco personalizável -> Contador regressivo para final do candle -> Informações sobre Resultado (em pontos), tanto no candl

이 프로젝트를 좋아한다면 5 스타 리뷰를 남겨주세요. 인스 타 그램: borelatech Volume-weighted average price는 총 거래량에 거래된 값의 비율입니다.
특정 시간대에 거래. 평균 가격의 측정입니다.
주식은 거래 수평선에 거래됩니다. VWAP는 종종 사용됩니다.
투자자의 거래 벤치 마크는 가능한 한 수동으로
실행. 이 지시자로 당신은 VWAP를 당길 수 있을 것입니다: 현재 날. 현재 주. 현재 달. 현재 분기. 현재 년. 또는: 이전 날. 이전 주. 지난 달. 이전 분기. 이전 연도.
FREE
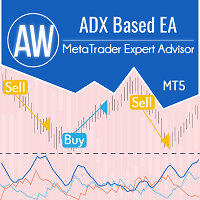
Expert Advisor는 ADX 표시기의 신호에 따라 거래합니다. PlusDi와 MinusDi의 상대적인 값으로 추세를 결정하는 고전적인 전략은 지표의 메인 라인에 의해 결정되는 추세가 활성일 때 사용됩니다. 거래는 현재 추세의 방향으로 이루어집니다. 문제 해결 -> 여기 / MT4 버전 -> 여기 / 지시사항 -> 여기 이점: 구성 가능한 표시기 신호 모든 유형의 악기 및 모든 기간에 적합 필요한 경우 평균화 사용 첫 번째 순서를 마지막 순서로 겹치는 플러그형 시스템 가상 테이크프로핏 세 가지 유형의 알림이 있습니다. 거래량을 자동으로 계산하는 기능 전략: Expert Advisor는 표시기 신호 ADX에 따라 작동합니다. 포지션을 열기 위해 메인, 마이너스, 플러스의 세 가지 지표 라인이 사용됩니다. 메인 라인은 추세의 강도, 즉 가격이 움직이는 활동을 보여줍니다. 그리고 다른 두 줄은 현재 추세가 무엇인지 나

This indicator looks for SIGNS of Buy and Sell
14 SIGNS: Crossover of 2 moving averages; Crossover of 3 moving averages; RSI Indicator; Stochastic Indicator; Crossing line 0 MACD;
Divergence of the RSI indicator; Divergence of the MACD indicator;
Divergence of the OBV indicator;
Divergence of the STOCHASTIC indicator; Three white soldiers candle pattern; Three black crows candle pattern; Hanging man candle pattern; Hammer candle pattern; Rupture Bands Bollinger.
The indicator plot

평면 및 추세를 결정하기 위한 표시기. 가격이 2개의 히스토그램과 2개의 선(빨간색 및 파란색) 중 하나보다 낮으면 판매 영역입니다. 이 버전의 표시기를 구매할 때 하나의 실제 계정과 하나의 데모 계정에 대한 MT4 버전 - 선물로(수신하려면 개인 메시지를 작성하세요)! 가격이 2개의 히스토그램과 2개의 선(빨간색 및 파란색) 중 하나보다 높으면 구매 영역입니다. MT4 버전: https://www.mql5.com/en/market/product/3793 가격이 두 라인 사이 또는 히스토그램 영역에 있으면 시장에 명확한 추세가 없습니다. 간단히 말해서 시장은 평평합니다. 표시기의 작업은 스크린샷에 더 명확하게 표시됩니다. 지표는 선행 데이터를 얻는 데 사용할 수 있습니다. 또는 현재 추세의 상태를 확인합니다.
The Lots Risk Sizer indicator will help you quickly determine the volume of a position in lots
The indicator has a collapsible panel at the touch of a button. When installed on a chart, it is located in the lower right corner in the form of a triangular button. Indicator parameters:
Risk - the amount of risk in the account currency (usd, eur, etc....). Enter only a whole number
Lots - risk in lots
Show description (On/Off) - show a text description of the displayed values
Display state

Non-lagging VOLATILITY indicator A radical modification of the ATR indicator, which corrected all of its shortcomings (the picture shows the difference with ATR). The indicator shows the swing size of the current market movement. Features: does not have a time window period, i.e. any subjective settings non-delayed, the extremums of the indicator always coincide with the extremum of the price (note the picture) is normalized by means of a color solution, i.e. it has the properties of an oscillat

ATR dynamic level The indicator calculates the price range within which the asset price moved for the specified period of time, and also builds the boundaries of the calculated range for the current week and for today. The levels are calculated from the beginning of the opening of the week (weekly) and from the beginning of the opening of the day (daily).
Features:
1) Support and resistance levels are always relevant, since these levels change along with the price movement. If the price has
Script that generates a report of possible ATM Straddle operations. It works for any asset on the spot market that has authorized stock options series on the B3 (Brazilian stock exchange).
Straddle operations presented in the report: Short Straddle operations Uncovered Short Straddle Covered Call Short Straddle Diagonal Covered Call Short Straddle (expiration of the covered call after the expiration of the short options) Iron Butterfly Iron Butterfly "Pozinho" Diagonal Iron Butterfly (diagona
每次一忙都會錯過訊號下單,或不想一直花時間盯盤下單,可以用這個工具掛單,讓MT5 自動 盯盤並在滿足條件後下單 。
demo : https://www.youtube.com/watch?v=JBPiFkixqT4 configuration: https://www.youtube.com/watch?v=D7xESKKD26o #############################################
使用場景:
一般交易可以分為2種,分別是: 左側交易: 價格到達關鍵位置時就下單交易,想要自動下單,可以使用buy limit和sell limit掛單 右側交易: 價格到達關鍵位置, 同時出現做多或做空訊號 時下單交易, 想要自動下單, 就 可以用本工具自動掛單 本工具會 在你指定的阻力區域偵測到做空訊號時,建空單 ; 並在你指定的支撐區域偵測到做多訊號時,建多單。 demo影片: https://www.youtube.com/watch?v=JBPiFkixqT4
####################################
FREE

Cross Entrance technical indicator crossing points can be used as potential market reversal points. Thus, all intersection points will be optimal points at which the movement changes taking into account the indicator period.
The advantage of this indicator is that it eliminates false signals during a sawtooth price movement and helps to maintain a position during a strong trend. When the trend changes, the Cross Entrance indicator uses line crossing indication. You can use the Cross Entrance
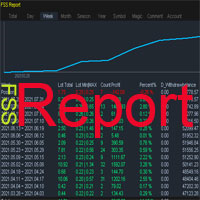
FSS_Report This is a professional report statistical indicator, which can be counted by day, week, month, quarter, year, magic and comment, and display the growth curve.
How to install: select "File" in your MT5 client 'menu,and open the folder "MQL5\Indicators",then copy file "FSS_Report.ex5",reload MT5 and enjoy. last update at 2023-05-18
v1.3 update info
1.fix bug about magic filter
2.fix bug about Comment filter
3.add path line
4.add func about addon work
Para List: UI_XY_Setti
Script that generates a report of possible Calendar options structures .
It works for any asset on the spot market that has authorized series of options on the B3 (Brazilian stock exchange).
The report presents the alternatives for assembling calendars structures, for a defined range of strikes, with the long option expiring in a certain number of months.
The main structures of the report are:
Calendar Calendar Line Covered Calendar Line In addition, the report presents alternatives to

Простой советник основанный на сигналах индикатора Relative Strength Index (RSI) в зоне перекупленности - продаем, в перепроданности - покупаем. Моя версия всем известного "Dynamic". Я рекомендую использовать этот советник в полуавтомате.
Добавляйтесь в друзья, присылайте свои интересные стратегии. Возможно после обсуждения всех нюансов напишу советника бесплатно . Параметры: "_Slippage" - Проскальзывание; "_
FREE
Boom and Crash UPGRADE
BOOM AND CRASH upgrade is a 100% adaptive expert advisor based on price movement. It has a built-in unique Smart Recovery algorithm. Only one trade at a time. Every trade has Stop Loss and Take Profit from very beginning, and they do not change. This is for those, who are looking for stable growth over the long run. SETTINGS SL-1000 TP-10000 TSTOP-7 TSTEP-5 MONEY MANAGEMENT-CONSTANT LOT VALUE FOR "MONEY MANAGEMENT"- 0.2 USE TIME CONTROL-FALSE START HOUR-Current START M

Advanced 4xZeovo MT5 Indicator (MetaTrader 5) Product Description 4xZeovo is a powerful trading indicator system monitoring 24/7 financial markets. Metatrader5 tool designed to find the best buying/selling opportunities and notifies the user. Making life easy for traders in helping with the two most difficult decisions with the use of advanced innovate trading indicators aiming to encourage users to hold the winning positions and take profit at the best times. Equipped with a unique tra

"Five Minute Drive" indicator that is designed to be used in the 5 minute timeframe only. One of its most important advantages is that it shows the general trend in the upper time frames when looking at the 5-minute timeframe. Therefore, when opening positions in the 5 minute timeframe, when it is in line with the trends in the upper timeframes, you are less likely to be upside down. If you can interpret the curvilinear and linear lines drawn by this indicator on the graphic screen with your geo
FREE

Dashboard, TP line and Profit/Loss labels are set to false by default for speeding up the optimization. Switch them to True before you start. There are many strategies inside this EA as follows: - Entry based on indicator signal "as shown on the trend indicator " - Opposite to trade entry with opposite martingale - Entries based on " support and resistance indicator ". - Normal martingale - Normal martingale with distance multiplier - Normal martingale with volatility index - Opposite martingal
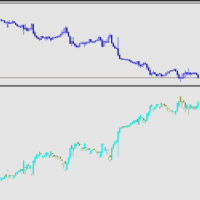
反转K线指标! 指标将主图的K线在副图中进行反转显示. 交易实用必备工具指标 波浪自动计算指标,通道趋势交易 完美的趋势-波浪自动计算通道计算 , MT4版本 完美的趋势-波浪自动计算通道计算 , MT5版本 本地跟单复制交易 Easy And Fast Copy , MT4版本 Easy And Fast Copy , MT5版本 本地跟单复制交易 模拟试用 Easy And Fast Copy , MT4 模拟账号运行 Easy And Fast Copy , MT5 模拟账号运行 The indicator of the attached figure shows that it is a mirror image of the candlestick chart of the main chart. The ordinate of the figure indicator is mirrored with the main image, and the coordinate value is a negative number.
For graphic reference o

任何交易者的最佳伙伴! 该EA加载后: 1.可以对无止损止盈的订单自动设置止盈和止损. 2.可以对盈利订单在盈利一定设置幅度后保护盈利 3.可以移动止盈止损
特性 1.可以对无止损止盈的订单自动设置止盈和止损.
2.可以对盈利订单在盈利一定设置幅度后保护盈利
3.可以移动止盈止损 自动止盈止损设置 自动设置止损止盈的开关
固定止损的点数设置 固定止盈的点数设置 自动使用波幅自动计算的TP设置 波幅自动计算的TP的风险系数设置 超过一定开仓时间的订单不再设置止盈止损. 止损保护设置 止损保护开关
止损保护启动点数设置 盈利保护点数设置
止损移动设置 移动止损开关
移动止损启动点数设置 移动止损回撤点数设置
有任何问题,欢迎交流...

Trend Dynamics Expert Advisor is a level trader designed to be as precise as possible.
Because of the extreme accuracy of the entries and the algorithms ability to filter out bad trades, the system does not take new trades every day.
The system was not optimized and has fixed indicator settings as its universally adaptable.
Be aware, that its recomended to run multiple pairs on the same account for more profit. Our Goal is to help you be way more profitable and way more stress free, so yo
Currency Pair Splitter, calculates the value of an individual country and display it's fluctuations and trend over a given period. It has three lines which gives a mean price for a given period of time. This product is accurate in determining the actual direction of a country economic growth and strength as a result of economic events happening in a country. It shows an optimum price where a currency can deviate. Example For a pair EURUSD . this indicator Calculates the Value of the Numerator E

This indicator plots the volume profile by Price on the chart
There are 5 ways to view it:
By Total Volume Traded; Volume Ticks(Forex) Separated by Buyers and Sellers; Buyers Only; Sellers Only and; Business balance (Buyers - Sellers).
It is possible to select how many days the profiles will be calculated.
On the current day it recalculates the histogram data for each new candlestick.
Another feature is to select the highest trading range by entering the desired percentage.
Th
FREE

Open Multiple Trades on MT5 in 1 click at one price. Enter the Symbol you want to trade Enter the Lot size Specify the number of trades you want to open Choose from a dropdown list whether you want to buy, sell, sell limit, sell stop, buy limit, buy stop If they are pending orders, state the number of pips away from the current price that you want to set the trades. Once you are done, click Ok and see the script open your trades in an instant What to Always Note Check the minimum stop levels f
MetaTrader 마켓은 MetaTrader 플랫폼용 애플리케이션을 구입할 수 있는 편리하고 안전한 환경을 제공합니다. Strategy Tester의 테스트를 위해 터미널에서 Expert Advisor 및 인디케이터의 무료 데모 버전을 다운로드하십시오.
MQL5.community 결제 시스템을 이용해 성능을 모니터링하고 원하는 제품에 대해 결제할 수 있도록 다양한 모드로 애플리케이션을 테스트할 수 있습니다.
트레이딩 기회를 놓치고 있어요:
- 무료 트레이딩 앱
- 복사용 8,000 이상의 시그널
- 금융 시장 개척을 위한 경제 뉴스
등록
로그인
계정이 없으시면, 가입하십시오
MQL5.com 웹사이트에 로그인을 하기 위해 쿠키를 허용하십시오.
브라우저에서 필요한 설정을 활성화하시지 않으면, 로그인할 수 없습니다.